Everyone Counts 2020-2022 – Results from the Third Nationally Coordinated Point-in-Time Counts of Homelessness in Canada
Table of contents
- Introduction
- Acknowledgments
- Key findings
- Methodology
- Enumeration of homelessness
- Survey of people experiencing homelessness
- Comparisons with previous counts
- Results from the Point-in-Time Count enumeration
- Results from the Point-in-Time Count survey
- Demographic characteristics
- Overnight location
- Duration of homelessness
- Shelter use
- Age of first homelessness experience
- Current episode of homelessness and reasons for housing loss
- Health challenges
- Experience as a youth in care
- Mobility between communities
- Sources of income
- Families with dependents
- 2SLGBTQI+
- Indigenous peoples
- Members of racialized groups
- Newcomer experience
- Veterans
- Housing loss and the COVID-19 pandemic
- Conclusion
- Annex A – 2020-2022 Point-in-Time Count Survey
- Annex B – Glossary
List of figures and tables
- Figure 1. Homelessness across overnight locations by region
- Table 1. Enumeration differences between COVID-19 periods
- Figure 2. Gender and age of respondents
- Figure 3. Census 2021 compared to PiT Count 2020-2022 – gender distribution by age
- Figure 4. Overnight location and gender identity
- Figure 5. Age and overnight location
- Figure 6. Duration of homelessness over the past 12 months
- Figure 7. Chronic homelessness by region
- Figure 8. Age of first homelessness by current age group
- Figure 9. Location and age of first experience of homelessness
- Table 2. Most common reasons for housing loss by age
- Figure 10. Health challenges
- Figure 11. Health challenges and age
- Figure 12. Health challenges among those who experienced youth in care
- Table 3. Top 5 sources of income by age group
- Figure 13. 2SLGBTQI+ identity and age
- Figure 14. 2SLGBTQI+ and health challenges
- Figure 15. Proportion of Indigenous respondents
- Figure 16: Indigenous identity and gender identity
- Figure 17. Age of first experience of homelessness and Indigenous identity
- Figure 18. Specified racialized group
- Figure 19. Racialized groups by overnight location
- Figure 20. Newcomer experience by region
- Figure 21. Newcomer experience by time in Canada
Introduction
Point-in-Time (PiT) Counts provide a one-day snapshot of homelessness in a community, including people experiencing homelessness in shelters and unsheltered locations, and those who are provisionally accommodated in transitional housing. They can also include people experiencing homelessness who are in health or correctional facilities or who are staying with others because they have no access to a permanent residence.
Previous nationally coordinated PiT Counts were held in 2016 and 2018:
- Homelessness Partnering Strategy Coordinated Canadian Point-in-Time Counts
- Everyone Counts 2018: Highlights - Reports
Everyone Counts 2020-2022, the Third Nationally Coordinated Point-in-Time Counts (PiT) of homelessness in Canada took place between March 2020 and December 2022. Originally scheduled for March and April 2020, the counts were extended until December 2022 to address pandemic-related risks. A total of 87 communities and regions implemented PiT Counts during this period and contributed their survey data to the national picture. This report incorporates data collected from across these communities, including counts that took place during pre-pandemic, mid-pandemic, and late-pandemic periods.
Acknowledgments
This report was prepared by Sajidul Quayum, Caren Love and Patrick Hunter at Infrastructure Canada. It reflects work by the National PiT Count Working Group and all communities and regions that conducted a PiT Count between 2020 and 2022. Each PiT Count was led by a local team, relying on dedicated people working with homelessness serving organizations, municipal staff, emergency services and volunteers who took the time to have conversations with people experiencing homelessness, to listen to their stories and understand their needs.
Communities and regions
Western and Northern
British Columbia
- Abbotsford
- Campbell River
- Chilliwack
- Comox Valley
- Cowichan Valley
- Cranbrook
- Fort St. John
- Kamloops
- Kelowna
- Merritt
- Nanaimo
- Nelson
- Parksville
- Penticton
- Port Alberni
- Prince Rupert
- Prince George
- Quesnel
- Sechelt / Gibsons
- Smithers
- Squamish
- Metro Vancouver
- Vernon
- Victoria
- Williams Lake
Alberta
- Calgary
- Edmonton
- Grande Prairie
- Lethbridge
- Medicine Hat
- Red Deer
- Wood Buffalo
Saskatchewan
- Prince Albert
- Regina
- Saskatoon
Manitoba
- Brandon
- Thompson
- Winnipeg
Yukon
- Whitehorse
Northwest territories
- Yellowknife
Central
Ontario
- Barrie (Simcoe)
- Belleville
- Brantford
- Cochrane District (Timmins)
- Dufferin County
- Durham (Oshawa)
- Guelph / Wellington
- Halton
- Hamilton
- Kenora
- Kingston
- Lambton
- London
- Nipissing / North Bay
- Ottawa
- Peel / Brampton
- Peterborough
- Sault Ste. Marie
- St. Catharines / Niagara
- Sudbury
- Thunder Bay
- Toronto
- Waterloo
- Windsor
- York Region
Québec (Health Regions)
- Abitibi-Témiscamingue
- Québec (Capitale-Nationale)
- Chaudière-Appalaches
- Côte-Nord
- Estrie
- Laval
- Mauricie-Centre-du-Québec
- Montérégie
- Montréal
- Lanaudière
- Laurentides
- Outaouais
- Saguenay-Lac-Saint-Jean
Eastern
New Brunswick
- Bathurst
- Fredericton
- Moncton
- Saint John
Nova Scotia
- Halifax
- Sydney / Cape Breton
Prince Edward Island
- Charlottetown
- Summerside
Newfoundland
- St. John's
Key findings
- Over 40,000 people were enumerated as experiencing homelessness across 72 communities and regions.
- Among the 67 communities and regions that conducted counts in both 2018 and 2020-2022, the overall number of people experiencing homelessness increased by 20%.
- The largest contributor to this change was unsheltered homelessness, which increased by 88%.
- Counts that were done late-pandemic had the largest changes in unsheltered locations and shelters, reporting increases of 125% and 57% respectively.
- Over two-thirds of respondents (69%) reported experiencing chronic homelessness, an increase from 60% in the 2018 count.
- The most common reason reported for recent housing loss was not having enough income, accounting for 28% of responses.
- Many respondents (44%) experienced homelessness for the first time before the age of 25.
- Nearly one in three (31%) respondents reported having had an experience in foster care, a youth group home, or other child welfare program.
- Nearly half of youth respondents (45%) had experiences of being a youth in care.
- Substance use (61%) and mental health (60%) issues were the most prevalent health challenges reported among all respondents.
- Single parents and couples with dependants represented 5% of respondents.
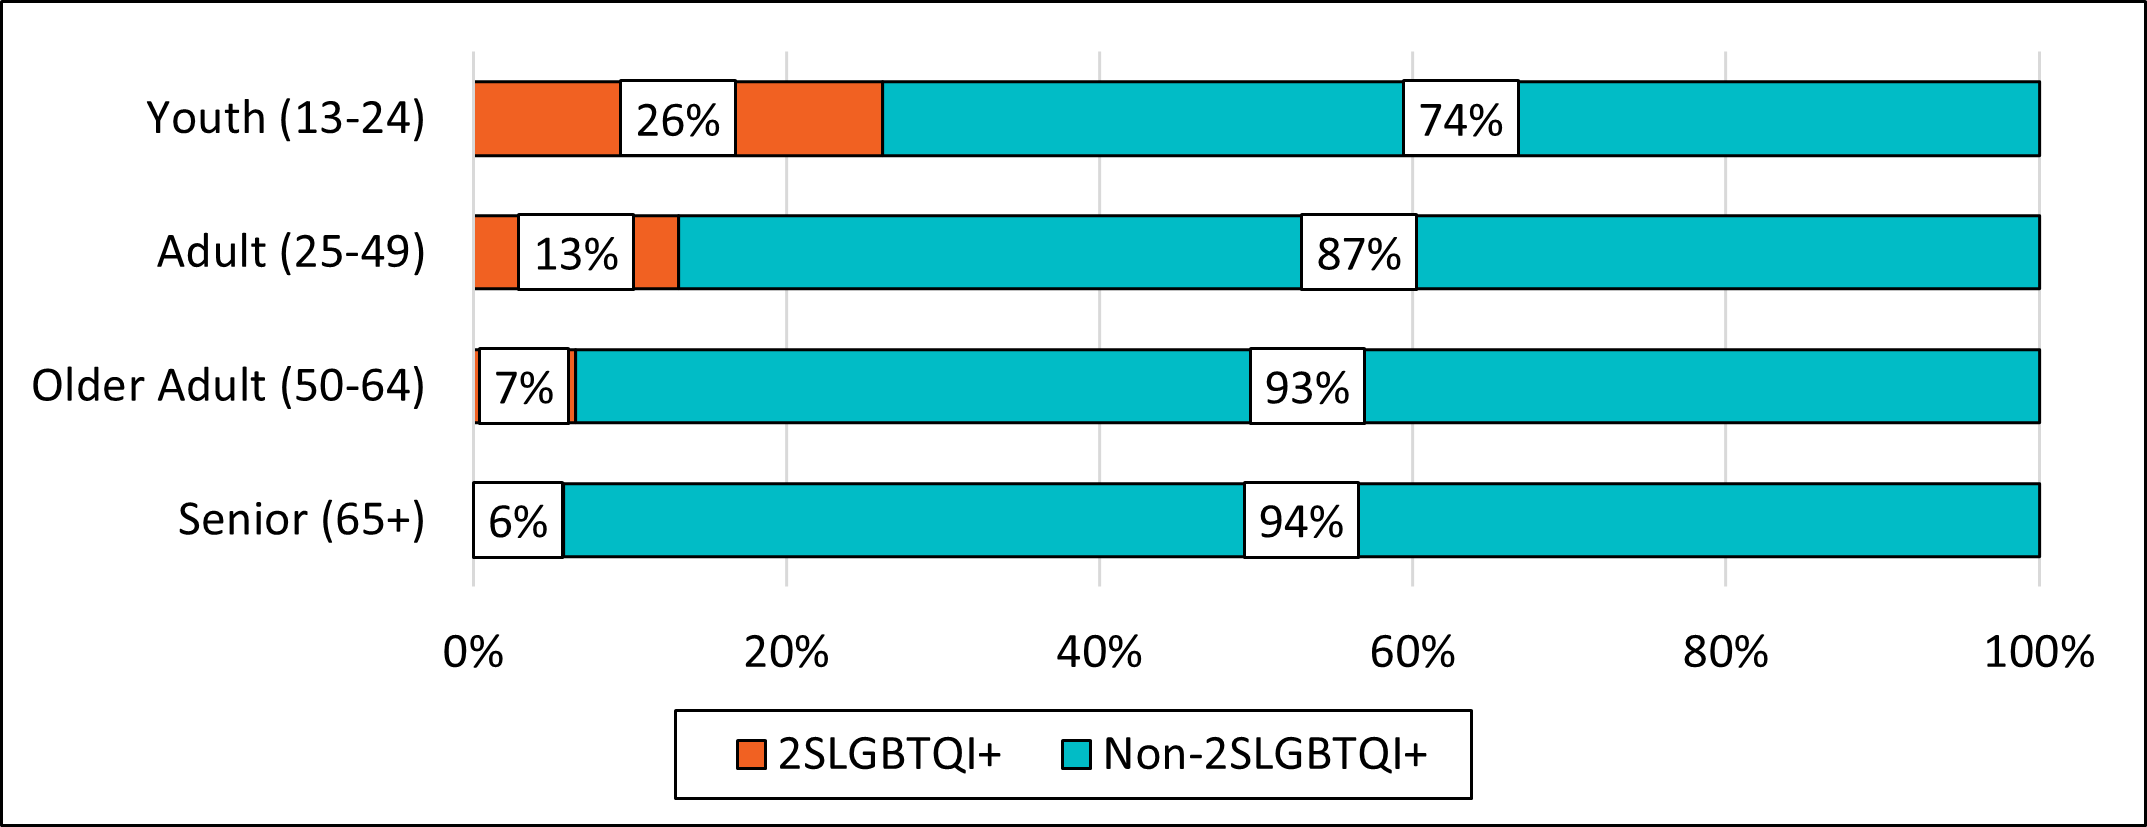
- Youth comprised the highest proportion (26%) of 2SLGBTQI+ responses.
- Indigenous respondents remain overrepresented among those experiencing homelessness, representing 31% of respondents.
- Veterans are overrepresented among those experiencing homelessness, representing just under 5% of respondents.
Methodology
The Point-in-Time Counts provide two sources of data: 1. a one-night enumeration of how many people experience homelessness in the community, and 2. survey responses from people experiencing homelessness. A total of 87 communities provided the results of their survey to inform the national understanding of homelessness, while 72 communities contributed comparable enumeration data.
Enumeration of homelessness
Participating communities and regions carry out an enumeration of homelessness in “core” locations, including:
- Unsheltered locations such as streets, alleys, parks, transit stations, abandoned buildings, encampments, vehicles, ravines, and other outdoor locations where people experiencing homelessness are known to sleep.
- Sheltered locations such as emergency shelters, extreme weather shelters, Domestic Violence shelters, and may also include hotel or motel rooms provided as shelter spaces.
- Transitional housing such as programs that provide longer-term housing solutions with supports intended to help individuals transition from homelessness to secure housing.
The enumeration of people experiencing homelessness in unsheltered locations was based on those who indicated that they were staying in an unsheltered location in the PiT count survey. Some communities also included a count of those who were observed to be experiencing homelessness outside, but who were not able to be surveyed (e.g., someone sleeping in an unsheltered location). The number of people experiencing homelessness in shelters and transitional housing locations were based on administrative data and occupancy reports supplied by service providers.
The enumeration is intended to identify how many people experience homelessness at a given time. Conducted over subsequent years, this information can be used to monitor progress in reducing homelessness.
Findings from the enumeration includes data from 72 communities and regions that reported their enumeration as part of the 2020-22 PiT Count. To facilitate comparison, communities and regions were grouped into the following areas:
- Western and Northern region: British Columbia, Alberta, Saskatchewan, Manitoba, Yukon and the Northwest Territories.
- Central region: Ontario and Québec.
- Eastern region: New Brunswick, Nova Scotia, Prince Edward Island and Newfoundland.
Survey of people experiencing homelessness
The second component of the PiT Counts is the implementation of a survey of people experiencing homelessness. The survey data includes the information from 87 communities and regions and encompasses 15 core questions (Annex A), collaboratively developed with participating communities, people with lived experience, academics and researchers, and professionals in the homelessness sector. Additional local questions may be added at the community-level, which may be present in local reports. The survey data are anonymous and self-reported. Respondents have the option to skip questions, as well as withdraw from the survey at any time. Communities survey people experiencing homelessness in the following locations:
- Unsheltered locations: such as streets, alleys, parks, transit stations, abandoned buildings, encampments, vehicles, ravines, and other outdoor locations where people experiencing homelessness are known to sleep.
- Homeless Shelters: emergency shelters, extreme weather shelters, Domestic Violence shelters.
- Transitional housingFootnote 1: programs that provide longer-term housing solutions with supports intended to help individuals transition from homelessness to secure housing.
- Hotels or motels: hotel or motel rooms that are provided to families or individuals experiencing homelessness in lieu of shelter beds.
- Hidden or staying with others: locations where people are living temporarily with others or accessing temporary accommodations, without guarantee of continued residency or access to a safe and permanent residence.
- Systems or health and correctional institutions: facilities that are regulated by either federal, provincial or municipal bodies. It includes locations such as hospitals, treatment centres, prisons, jails and detention centres.
Comparisons with previous counts
This report includes comparisons made between 67 communities and regions that participated in both the 2020-22 and 2018 Counts. Because most of the recent counts took place over the course of the COVID-19 pandemic, some changes may be attributable to the impacts of the pandemic. In particular, during the first year of the pandemic, shelters reduced bed capacity to enable physical distancing. Policies were also put in place to mitigate the impact of the pandemic on housing loss (e.g., the Canadian Emergency Response Benefit, eviction moratoria).
Additional information on the methodology for the Nationally Coordinated Point-in-Time Counts can be found in the 2020-2022 Point-in-Time Count Guide.
Results from the Point-in-Time Count enumeration
A total of 40,713 people were enumerated across 72 communities and regions in Canada. This includes 34,270 experiencing homelessness in sheltered and unsheltered locationsFootnote 2, and 6,443 people who were identified as provisionally accommodated in transitional housing programs.
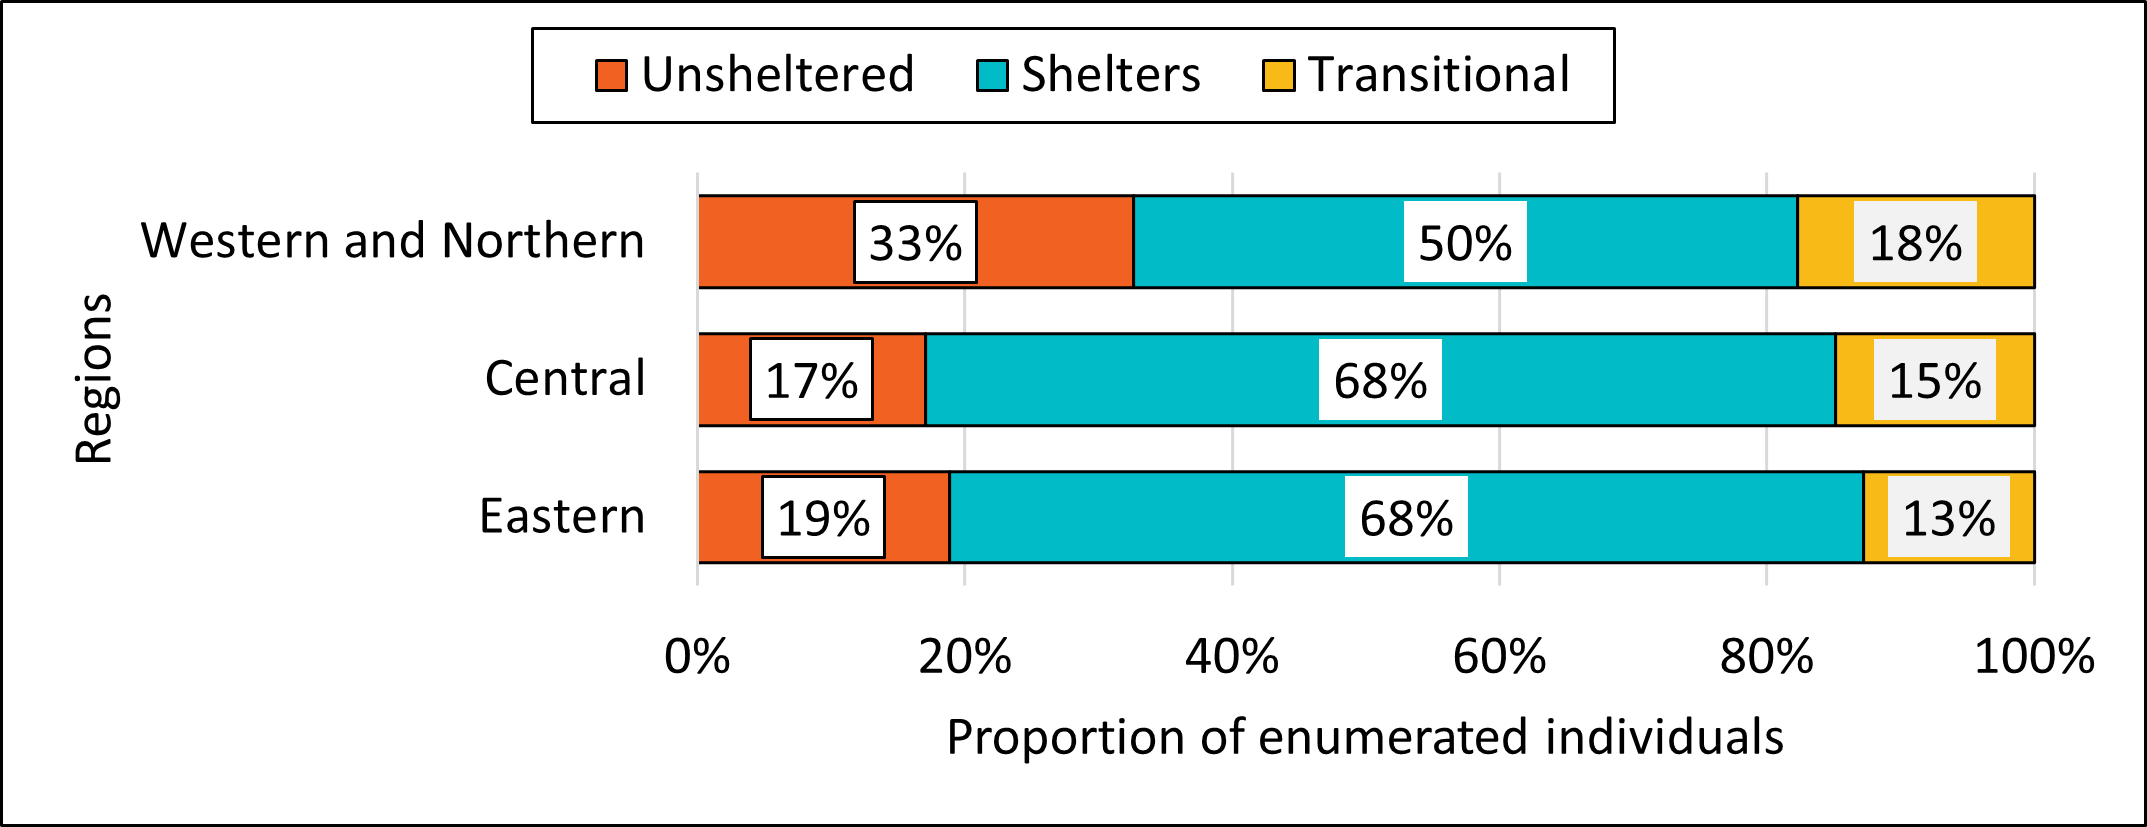
The majority of people were enumerated in shelters (61%) (e.g., emergency shelters, family or domestic violence shelters), followed by those in unsheltered locations (23%), including encampments, and those who were provisionally accommodated in transitional housing (16%). Communities in the Western and Northern region had a larger proportion of people in unsheltered locations (33%) compared to those in Central (17%) and Eastern regions (19%)Footnote 3.
Figure 1. Homelessness across overnight locations by region
-
Figure 1 - Text version
Figure 1. Homelessness across overnight locations by region Region Unsheltered Shelters Transitional Western and Northern 19% 68% 13% Central 17% 68% 15% Eastern 33% 50% 18%
By comparing community enumeration data against population data from the 2021 Census, at least 13 people were experiencing homelessness for every 10,000 people across the participating communities and regions. Rates were higher for communities in the Western and Northern region, where there were approximately 17 per 10,000 people. The Central and Eastern regions each had rates of 12 per 10,000 people.
Comparing 2018 and 2020-22 PiT Counts
Among the 67 communities and regions that conducted a count in 2018 and in 2020-2022, the overall number of people enumerated increased by 20%Footnote 4.
The number of people in unsheltered locations represented the largest increase with 88%, followed by a 14% increase in sheltered locations. In contrast, the number of people who were provisionally accommodated in transitional housing programs decreased by 11%.
There were increases in the number of people counted during each period of the pandemic (pre, mid and late)Footnote 5. The most notable change occurred in the late-pandemic counts, which found a 38% overall increase. Unsheltered homelessness was the main contributor, with increases of 56% in the pre-pandemic, 75% in the mid-pandemic, and 125% in the late-pandemic periods.
The change in sheltered homelessness counts varied across different pandemic periods. For counts conducted before the pandemic, there was a 9% increase. During the mid-pandemic period, there was a 1% decrease, while counts done in the late-pandemic period found a 57% increase in sheltered homelessness.
Timeline of the count |
Change in proportion of Unsheltered |
Change in proportion of Sheltered |
Change in proportion of Transitional housing |
Change in proportion of overall enumeration |
|---|---|---|---|---|
Pre-pandemic |
56% |
7% |
-5% |
18% |
Mid-pandemic |
75% |
-1% |
9% |
8% |
Late-pandemic |
125% |
57% |
-19% |
38% |
Overall |
88% |
14% |
-11% |
20% |
Results from the Point-in-Time Count survey
Findings from the survey includes data from over 25,000 surveys conducted across 87 communities and regions.
Demographic characteristics
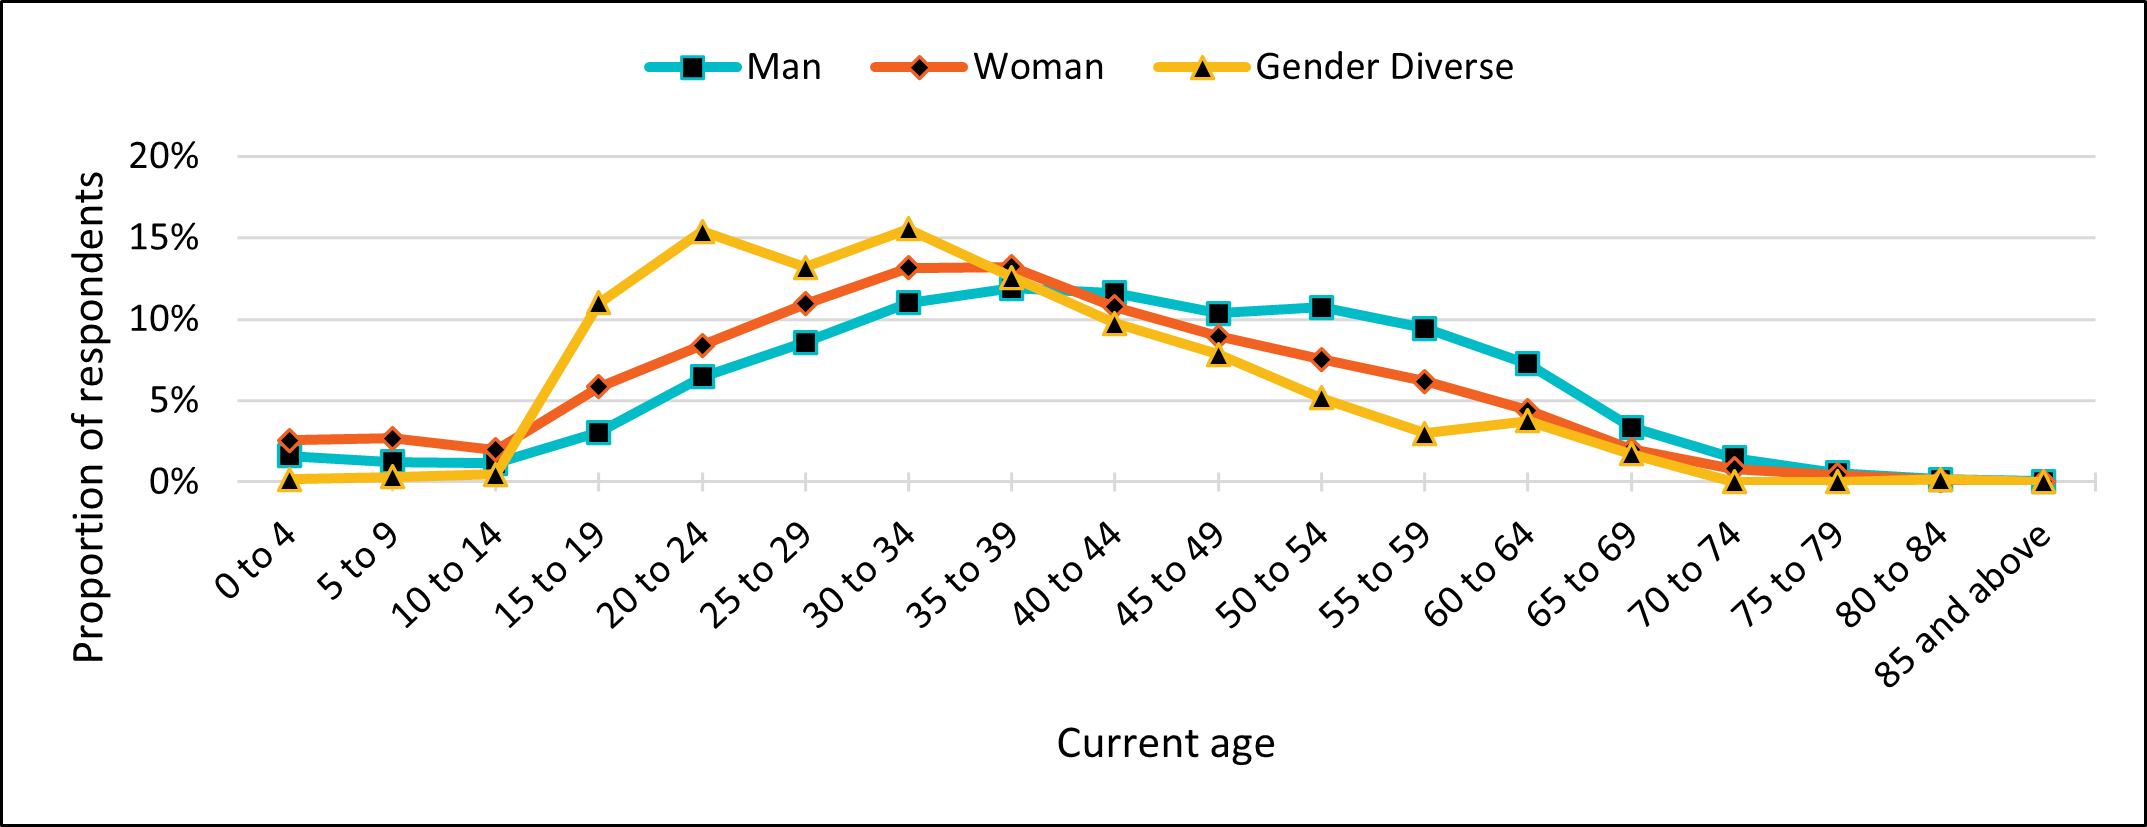
The majority of respondents were adults aged 25 to 49 (55%), followed by older adults aged 50 to 64 (24%), and youth aged 13 to 24 (12%). Seniors aged 65 and over, and dependent children aged 0 to 12 both made up 5% of those surveyed. Most respondents identified as men (63%), while 35% identified as women and 3% as gender diverse. Respondents identifying as men tended to be older, with an average age of 41, compared to women (35 years old) and gender diverse respondents (34 years old).
Figure 2. Gender and age of respondents
-
Figure 2 - Text version
Figure 2. Gender and age of respondents Current age Man Woman Gender Diverse 0 to 4 2% 3% 0% 5 to 9 1% 3% 0% 10 to 14 1% 2% 0% 15 to 19 3% 6% 11% 20 to 24 6% 8% 15% 25 to 29 9% 11% 13% 30 to 34 11% 13% 16% 35 to 39 12% 13% 13% 40 to 44 12% 11% 10% 45 to 49 10% 9% 8% 50 to 54 11% 8% 5% 55 to 59 9% 6% 3% 60 to 64 7% 4% 4% 65 to 69 3% 2% 2% 70 to 74 1% 1% 0% 75 to 79 1% 0% 0% 80 to 84 0% 0% 0% 85 and above 0% 0% 0%
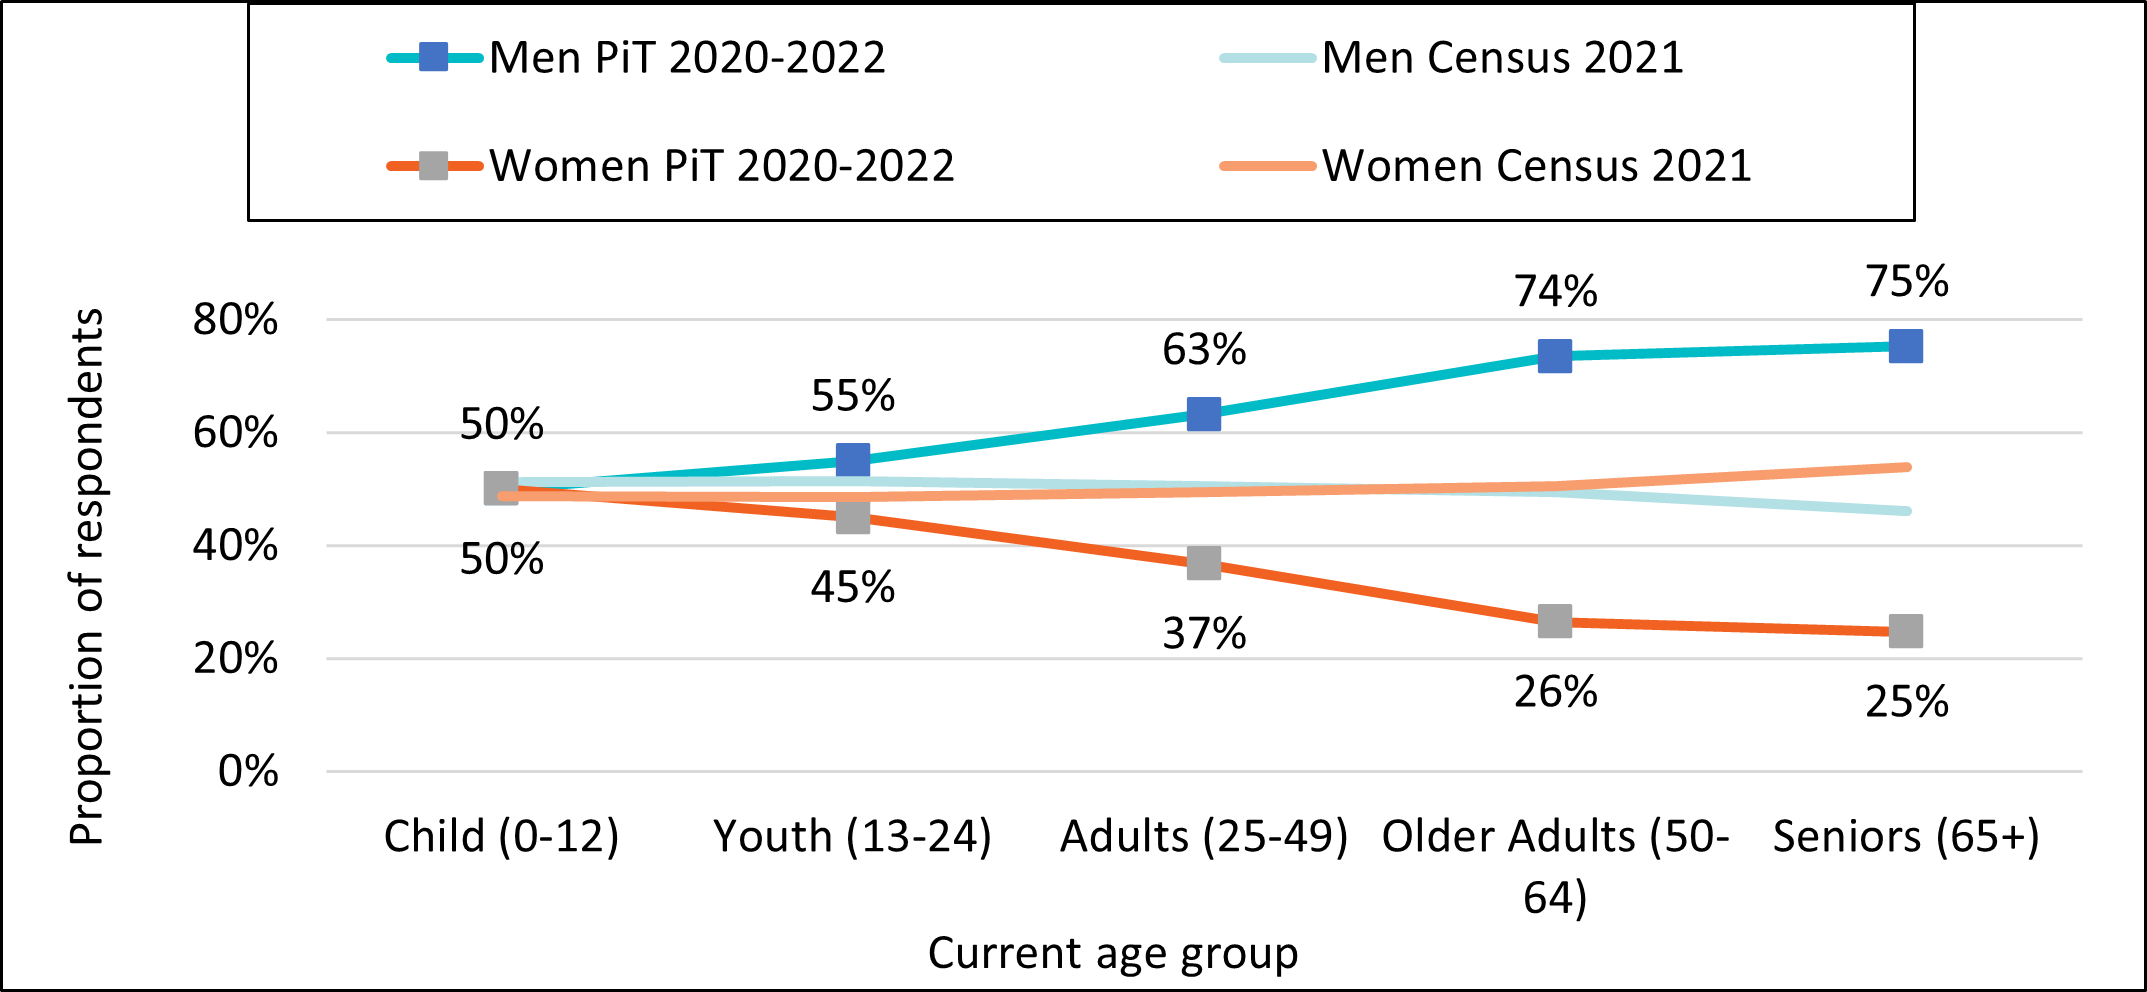
A larger proportion of men experience homelessness, beginning in the youth age group and continuing through to the seniors age group. In contrast, the general population has minimal differences between men and women for most age groups, with the exception of seniors, where women are more represented.
Figure 3. Census 2021 compared to PiT Count 2020-2022 – gender distribution by age
-
Figure 3 - Text version
Figure 3. Census 2021 compared to PiT Count 2020-2022 – gender distribution by age Current age group Men Women PiT 2020-2022 Census 2021 PiT 2020-2022 Census 2021 Child (0-12) 50% 51% 50% 49% Youth (13-24) 55% 51% 45% 49% Adults (25-49) 63% 51% 37% 49% Older Adults (50-64) 74% 49% 26% 51% Seniors (65+) 75% 46% 25% 54%
Overnight location
Respondents were asked about their overnight location on the night of the count. By comparing the demographics within each overnight location, it is possible to identify what services may be accessed by specific populations, and what populations may be underserved.
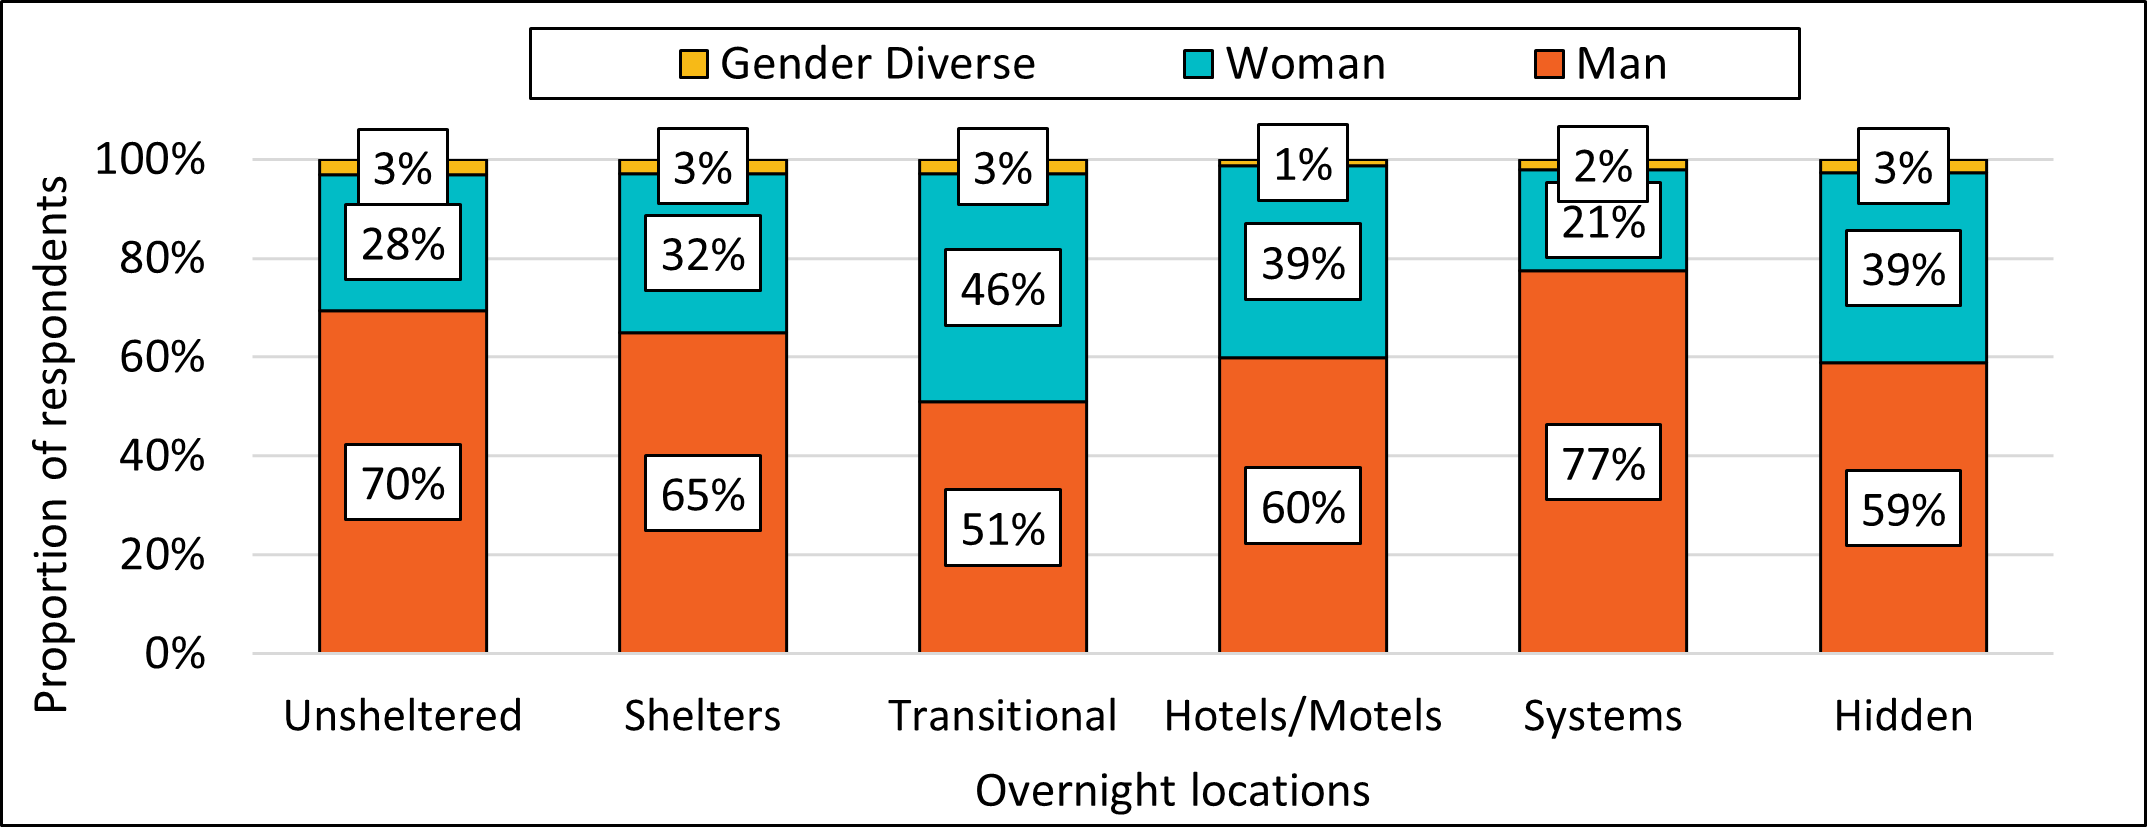
The majority of respondents in all overnight locations identified as men. Transitional housing was the only location where there was near parity between men (51%) and women (46%). Representation of women was higher in transitional housing locations (46%), in hotels/motels (39%) and hidden homelessness (39%) than in unsheltered locations (28%) and in systems (21%).
Figure 4. Overnight location and gender identity
-
Figure 4 - Text version
Figure 4. Overnight location and gender identity Genders Unsheltered Shelters Transitional Hotels/Motels Systems Hidden Man 70% 65% 51% 60% 77% 59% Woman 28% 32% 46% 39% 21% 39% Gender Diverse 3% 3% 3% 1% 2% 3%
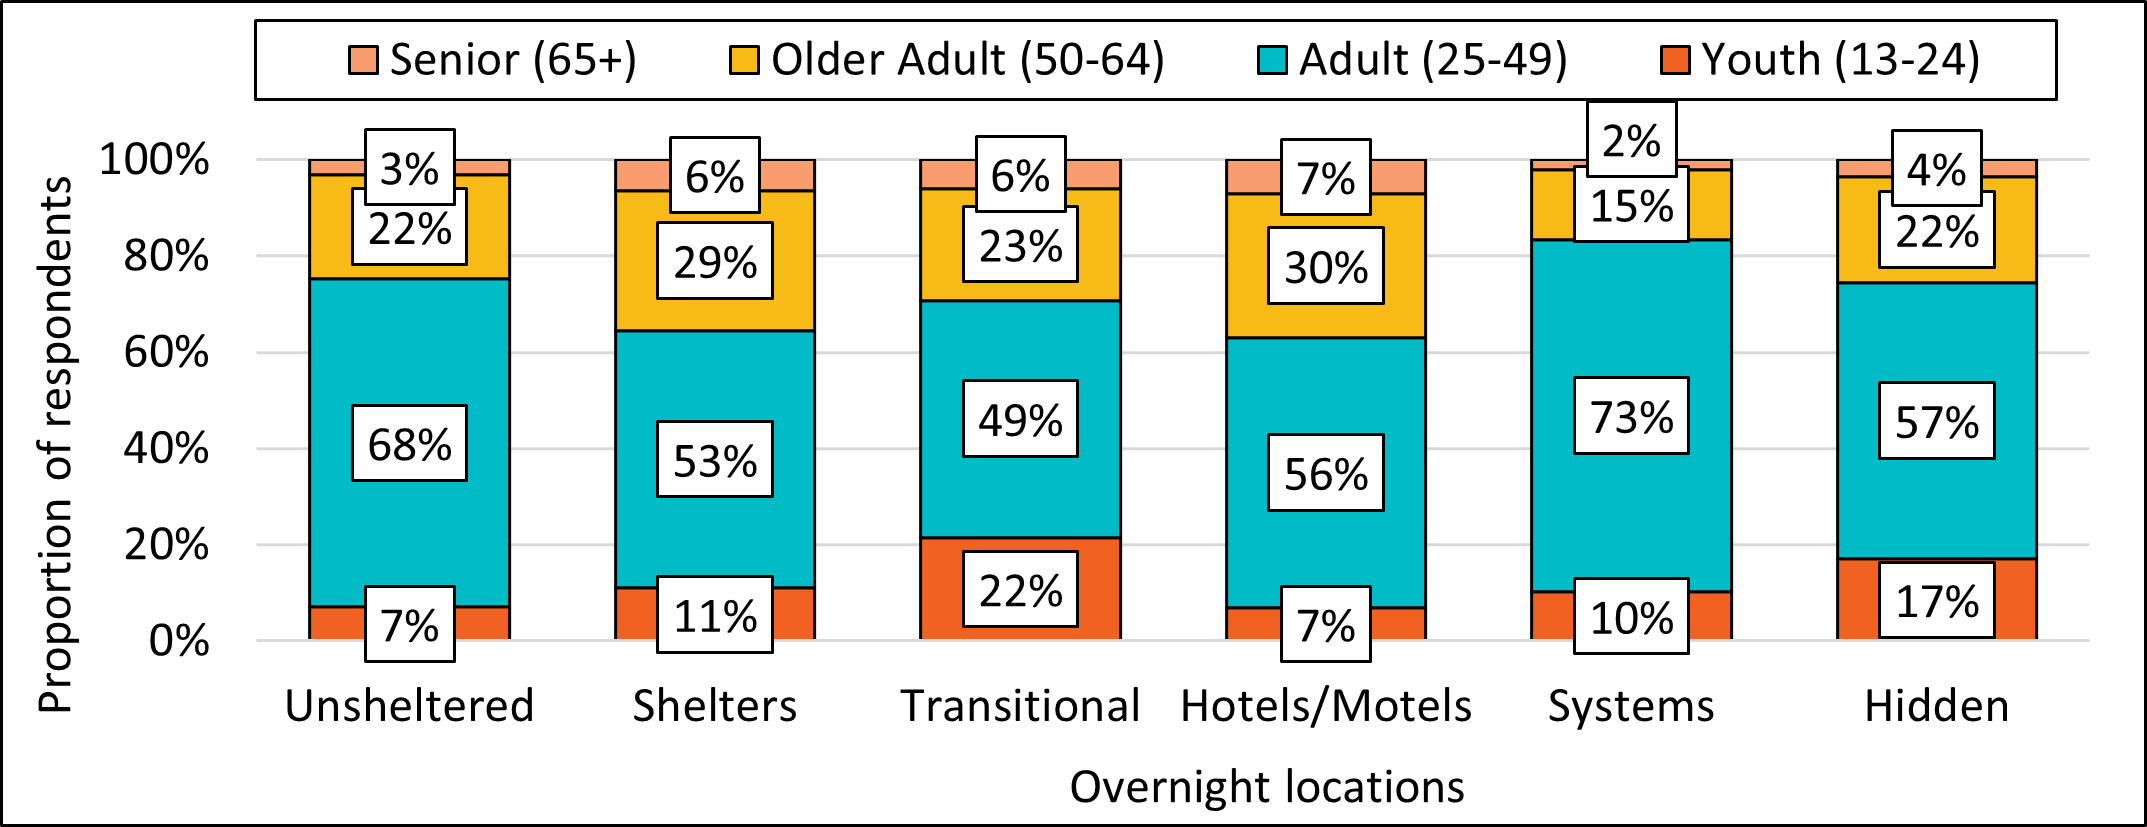
Adult respondents were most prevalent across all overnight locations, with the highest proportions seen in systems (73%) and in unsheltered locations (68%). The highest proportions of youth were among those provisionally accommodated in transitional housing (22%) and experiencing hidden homelessness (17%).
Figure 5. Age and overnight location
-
Figure 5 - Text version
Figure 5. Age and overnight location Age goup Unsheltered Shelters Transitional Hotels/Motels Systems Hidden Youth (13-24) 7% 11% 22% 7% 10% 17% Adult (25-49) 68% 53% 49% 56% 73% 57% Older Adult (50-64) 22% 29% 23% 30% 15% 22% Senior (65+) 3% 6% 6% 7% 2% 4%
Duration of homelessness
Survey respondents were asked how long they experienced homelessness over the past 12 months. An individual reporting six or more months of homelessness was considered as experiencing chronic homelessnessFootnote 6. It is important to note that rates of chronic homelessness will always be higher in point-in-time data than in data collected over the course of a year, since people experiencing chronic homelessness are more likely to be experiencing homelessness at a given time. Longer periods include a greater proportion of people who temporarily experience homelessness for short episodes throughout the year.
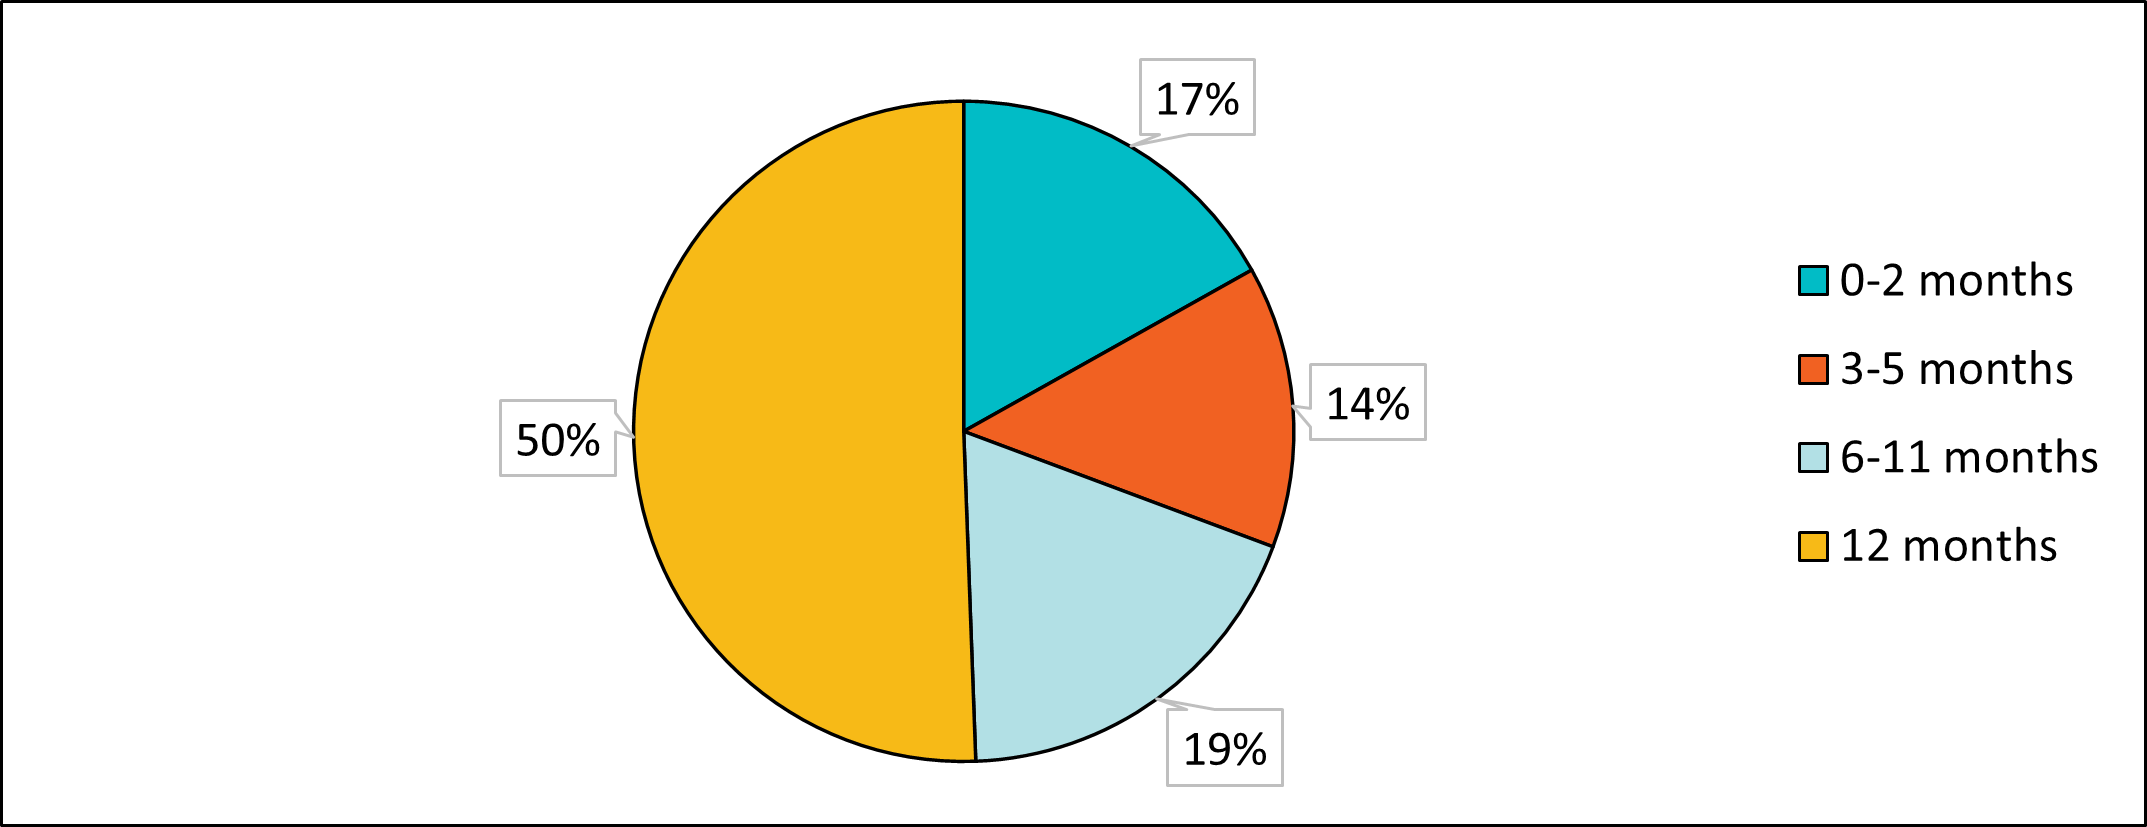
Among communities that had also participated in the 2018 PiT Counts, over two-thirds of respondents (69%) reported experiencing chronic homelessness, an increase from the 60% seen in the past counts. Half (50%) reported experiencing homelessness throughout the entirety of the previous 12 months.
Figure 6. Duration of homelessness over the past 12 months
-
Figure 6 - Text version
Figure 6. Duration of homelessness over the past 12 months Duration Proportion of respondents 0-2 months 17% 3-5 months 14% 6-11 months 19% 12 months 50%
Men were slightly more likely to report experiencing chronic homelessness (72%) compared to women (67%) and gender diverse respondents (70%). Rates of chronic homelessness tended to be lower among youth (58%) compared to adults (71%), older adults (72%) and seniors (68%).
Chronic homelessness was most often reported by respondents in unsheltered locations (83%), followed by those in hotels or motel (73%). Similar rates of chronic homelessness were seen in other locations, ranging from 68% for those experiencing hidden homelessness to 63% for those who were provisionally accommodated in transitional housing.
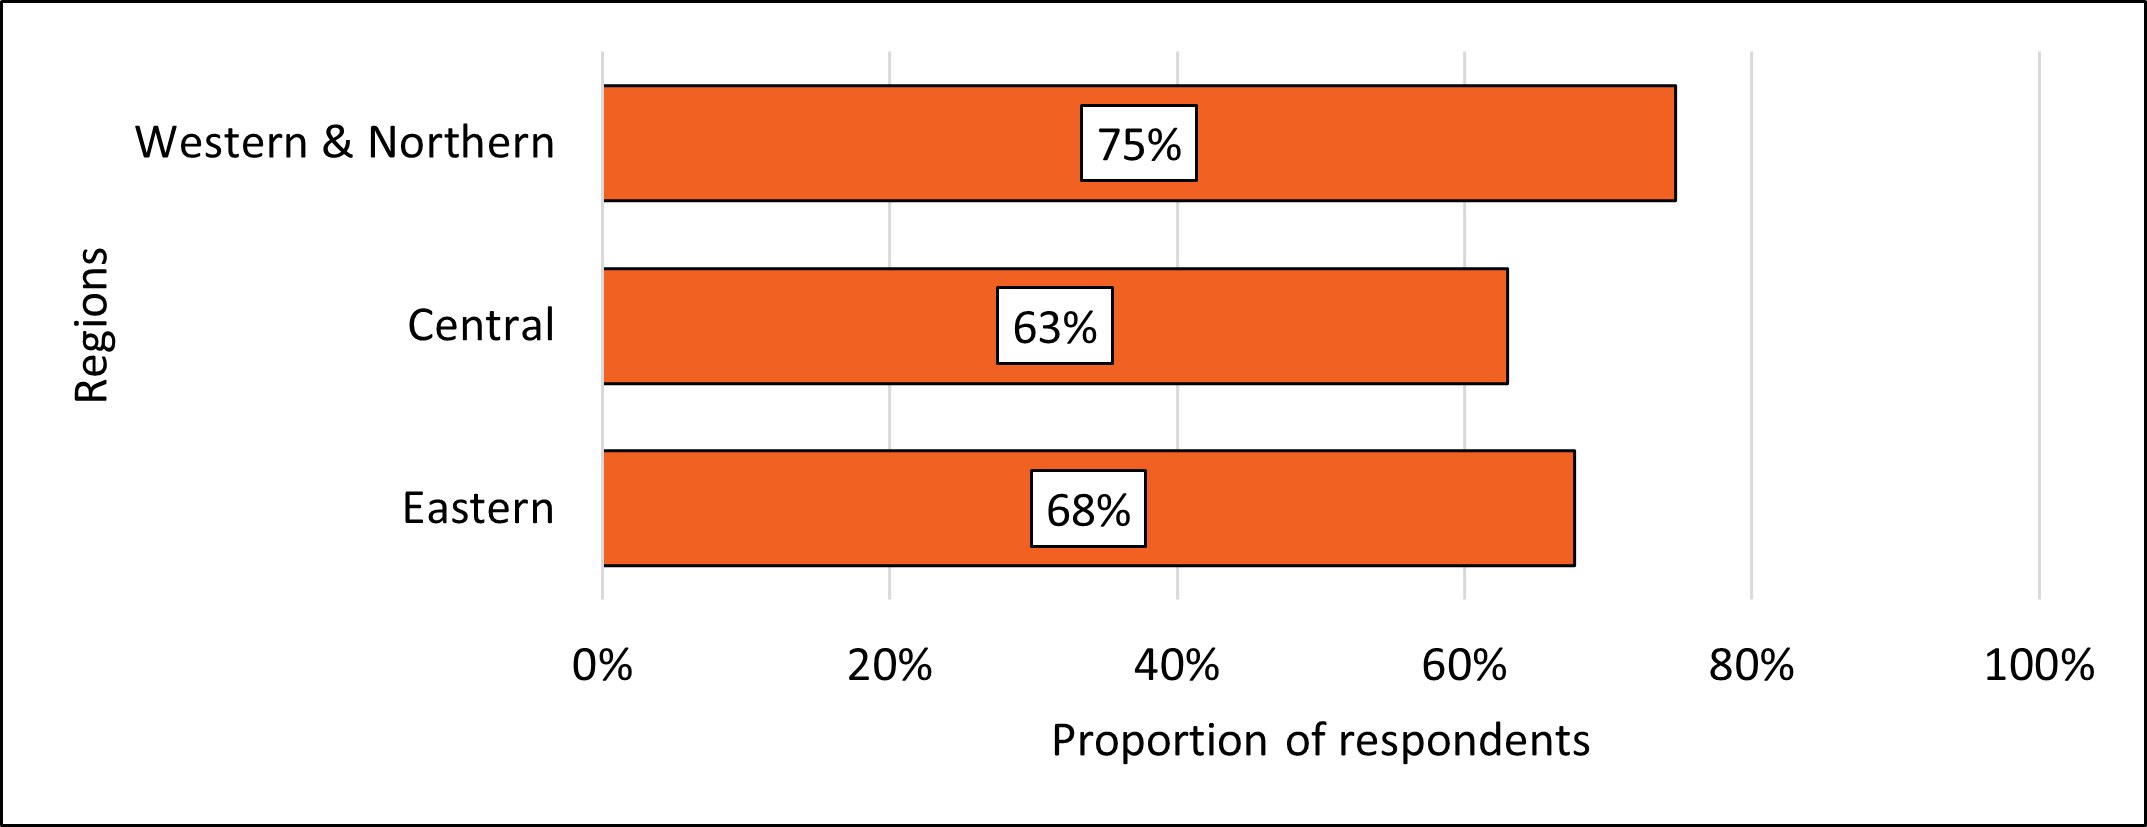
Respondents in the Western and Northern region were more likely to report experiencing chronic homelessness (75%) than those in Central (63%) and Eastern (68%) regions.
Figure 7. Chronic homelessness by region
-
Figure 7 - Text version
Figure 7. Chronic homelessness by region - East Central West & North Not Chronic 32% 37% 25% Chronic 68% 63% 75%
Shelter use
Approximately 75% of survey respondents reported using a shelter in the last 12 months. Shelter use in the last 12 months was least common among youth (69%) and most frequent among older adults (78%) and seniors (77%). There were no discernible differences among genders.
Reported shelter use over the past 12 months differed depending on overnight location. It was least common among those staying temporarily with others (44%), followed by those in transitional housing (52%), systems (52%) and unsheltered locations (57%).
Age of first homelessness experience
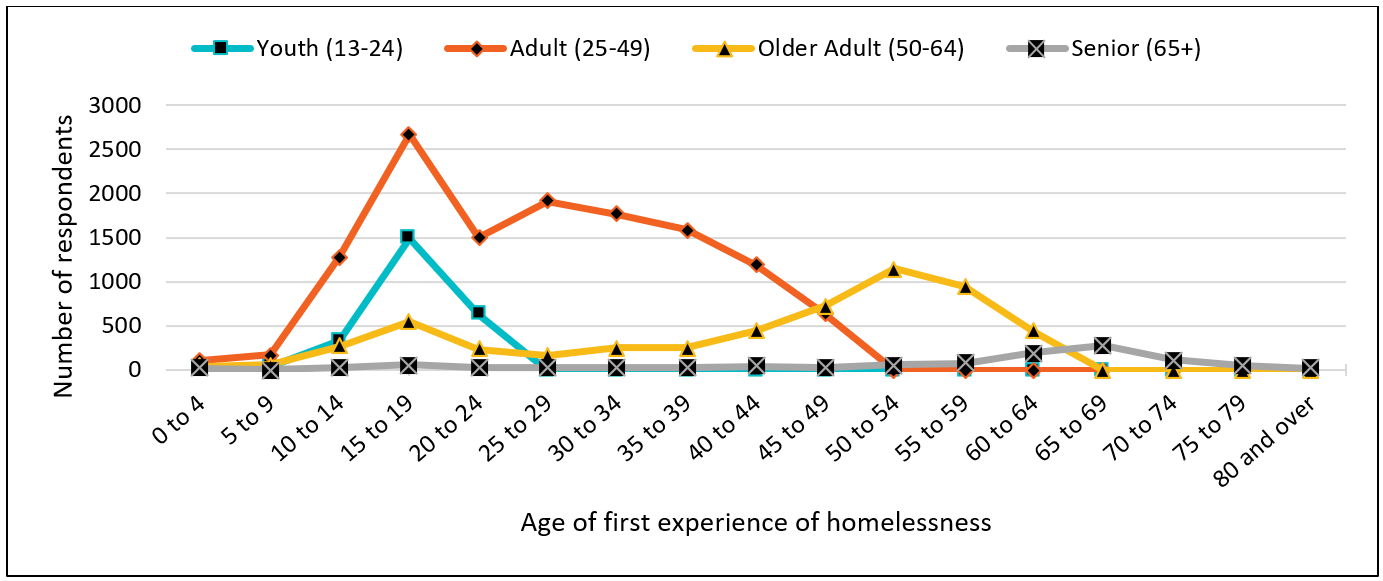
Survey respondents were asked about the age at which they first experienced homelessness. Many respondents (44%) experienced homelessness for the first time before 25, with the predominant age range between 15 and 19 (22%). Similar peaks within this age range were seen regardless of a respondent's current age. Nevertheless, among older adults and seniors, half (50%) reported having their first experience of homelessness at the age of 50 or above.
Figure 8. Age of first homelessness by current age group
-
Figure 8 - Text version
Figure 8. Age of first homelessness by current age group Age of first experience of homelessness Youth (13-24) Adult (25-49) Older Adult (50-64) Senior (65+) 0 to 4 29 110 43 15 5 to 9 41 172 56 8 10 to 14 338 1286 270 28 15 to 19 1489 2664 549 57 20 to 24 625 1502 236 32 25 to 29 0 1903 161 26 30 to 34 0 1763 255 23 35 to 39 0 1590 256 22 40 to 44 0 1179 448 42 45 to 49 0 630 727 33 50 to 54 0 0 1149 63 55 to 59 0 0 947 74 60 to 64 0 0 441 201 65 to 69 0 0 0 277 70 to 74 0 0 0 113 75 to 79 0 0 0 48 80 and over 0 0 0 18
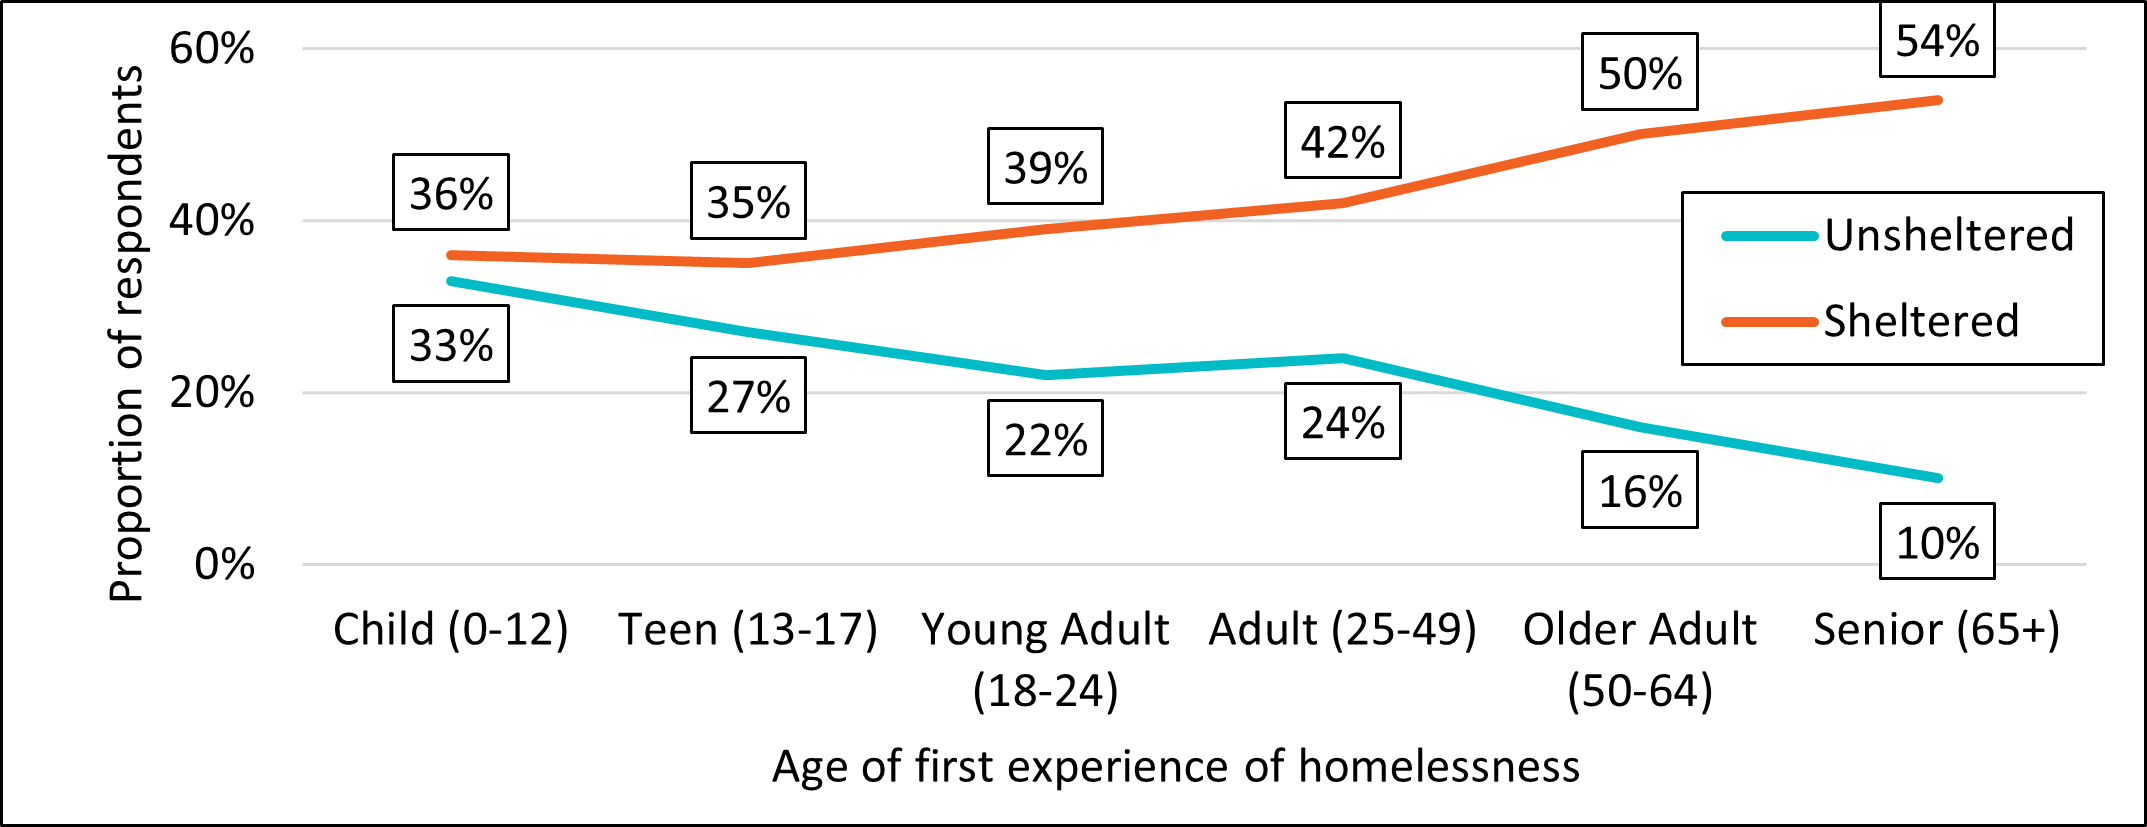
Early experiences of homelessness were linked to a higher likelihood of experiencing unsheltered homelessness. Conversely, as the age of initial homelessness occurrence rises, the likelihood of accessing shelter also increases.
Figure 9. Location and age of first experience of homelessness
-
Figure 9 - Text version
Figure 9. Location and age of first experience of homelessness Age of first experience of homelessness Unsheltered Shelters Child (0-12) 33% 36% Teen (13-17) 27% 35% Youth (18-24) 22% 39% Adult (25-49) 24% 42% Older Adult (50-64) 16% 50% Senior (65+) 10% 54%
The prevalence of chronic homelessness was greatest among individuals who had their initial experience of homelessness at a younger age. Among those who first experienced homelessness as a child, 78% reported experiencing chronic homelessness. This trend gradually decreased as age of first homelessness increased, with 55% of individuals who had their first homelessness experience as seniors reporting chronic homelessness.
Current episode of homelessness and reasons for housing loss
When asked about their current episode of homelessness, the majority (57%) of respondents reported losing their housing within the last 12 months, 23% between one and two years previously, and 20% three or more years ago. On average those who lost their housing within the last 12 months, have been experiencing homelessness for about six months. Results show that 63% of women were more likely to have lost their housing within the last 12 months, in comparison to men (55%) and gender diverse (55%). This is also consistent with findings looking at gender and chronic homelessness reported in the analysis of chronic homelessness data snapshot reportFootnote 7.
Survey respondents were also asked about the reasons for their most recent housing loss (respondents could indicate more than one). The most frequently identified response was not having enough income (28%), followed by substance use issues (18%), conflict with spouse or partner (14%) and conflict with landlord (14%). Women were more likely (13%) to report housing loss due to abuse by a partner compared to men (2%).
Reasons for housing loss also differed by age. Insufficient income was the most common reason for housing loss among adults (28%), older adults (30%) and seniors (32%), whereas conflict with a parent or guardian was most often reported by youth (30%).
Reasons for Housing loss |
Youth (13-24) |
Adult (25-49) |
Older Adults (50-64) |
Seniors (65+) |
|---|---|---|---|---|
1st |
Conflict with parent or guardian (30%) |
Insufficient income for housing (28%) |
Insufficient income for housing (30%) |
Insufficient income for housing (32%) |
2nd |
Insufficient income for housing (24%) |
Substance use issues (21%) |
Landlord tenant conflict (16%) |
Landlord tenant conflict (16%) |
3rd |
Substance use issues (17%) |
Conflict with spouse or partner (16%) |
Substance use issues (14%) |
Unsafe housing conditions (12%) |
4th |
Mental health issues (13%) |
Landlord tenant conflict (14%) |
Conflict with spouse or partner (12%) |
Conflict with other (10%) |
5th |
Unsafe housing conditions (11%) |
Mental health issues (10%) |
Unsafe housing conditions (11%) |
Conflict with spouse (9%) |
Health challenges
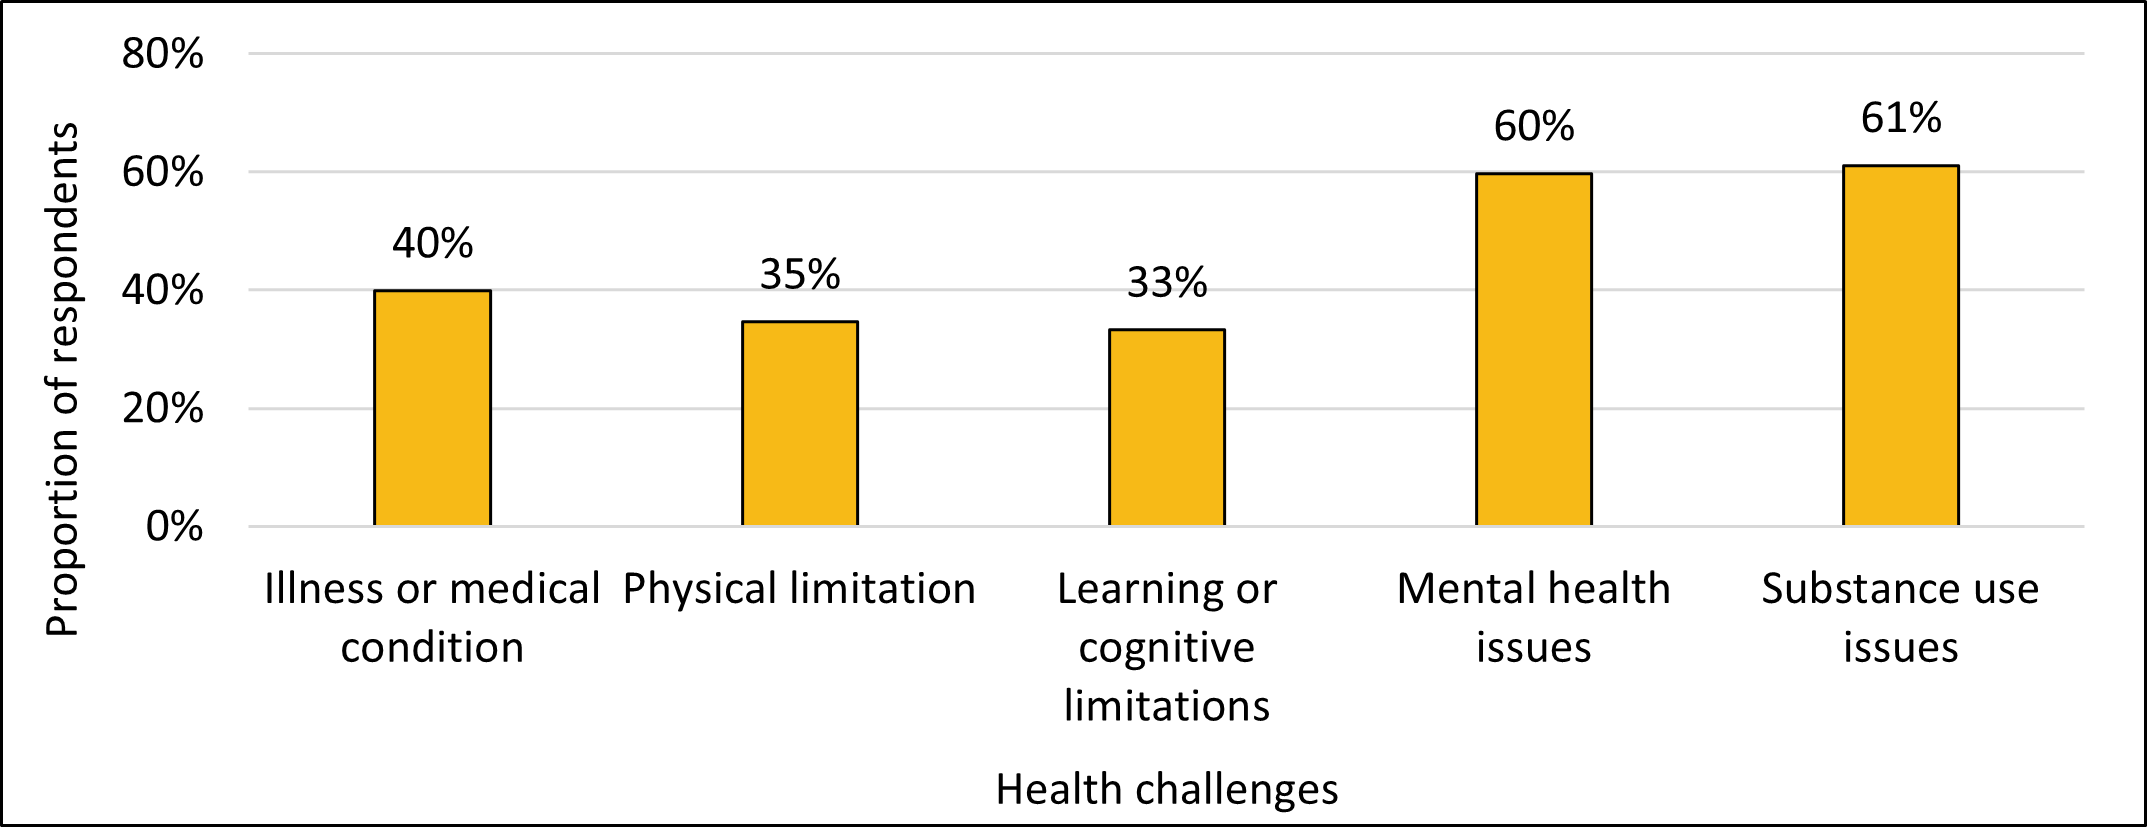
Information about health challenges was collected for the first time during the 2020-2022 Point-in-Time Counts. A large majority (85%) of respondents reported having at least one health challenge, and 67% reported having more than one. Substance use (61%) and mental health (60%) issues were the most prevalent responses.
Figure 10. Health challenges
-
Figure 10 - Text version
Figure 10. Health challenges - Illness or Medical issue Physical Disability Learning Disability Mental Health Issue Substance Use Issue Indicated a health challenge 40% 35% 33% 60% 61%
The prevalence of health challenges was higher among respondents who reported longer durations of homelessness. Prevalence of health challenges ranged from 81% for those who had homeless durations of 0 to 2 months to 87% for those who reported experiencing homelessness for 6 or more months.
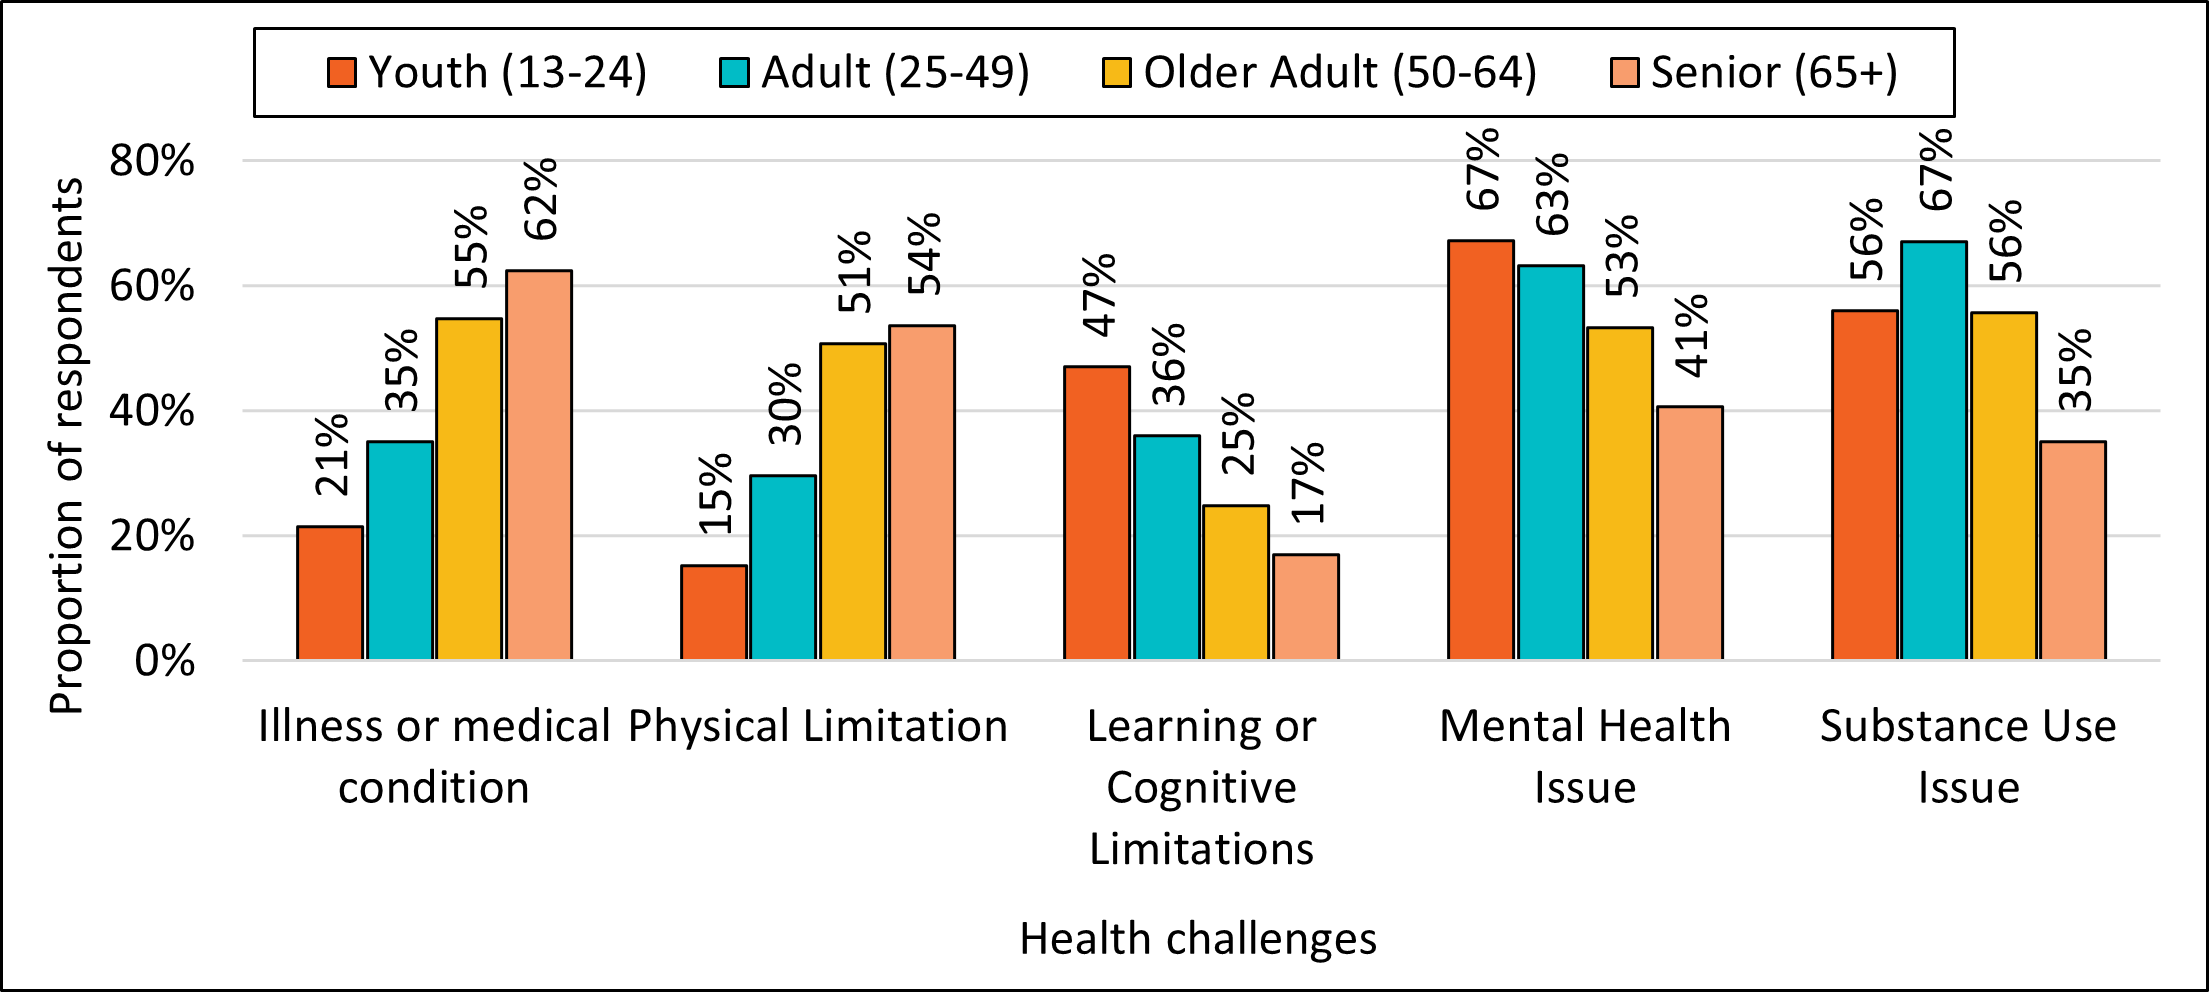
The type of health challenge varied across different age groups. The prevalence of mental health issues and learning or cognitive limitations tended to decrease with age, whereas illnesses or medical conditions and physical limitations increased. The prevalence of substance use issues was highest among adults (67%) and lowest among seniors (35%).
Figure 11. Health challenges and age
-
Figure 11 - Text version
Figure 11. Health challenges and age Health Challenge Youth (13-24) Adult (25-49) Older Adult (50-64) Senior (65+) Illness or medical condition 21% 35% 55% 62% Physical Limitation 15% 30% 51% 54% Learning or Cognitive Limitations 47% 36% 25% 17% Mental Health Issue 67% 63% 53% 41% Substance Use Issue 56% 67% 56% 35%
Experience as a youth in care
Respondents were asked to report if they had experiences of staying in foster care, a youth group home, or other child welfare program. This was reported by 31% of survey respondents. By region, respondents were more likely to have experiences as a youth in care in the Western and Northern region (39%) compared to Eastern (29%) and Central regions (27%). Rates were highest among those spending the night in unsheltered locations (38%), in systems (39%), or who were experiencing hidden homelessness (39%), compared to those in shelters (28%) or transitional housing (25%).
Experiences of youth in care were most common among youth, reported by nearly half (45%) of respondents. The percentage decreased with age, reported by 33% of adults, 24% of older adults, and 10% of seniors. Those who identified as gender diverse were most likely to report an experience as a youth in care (43%), compared to those who identified as men (29%) and women (34%).
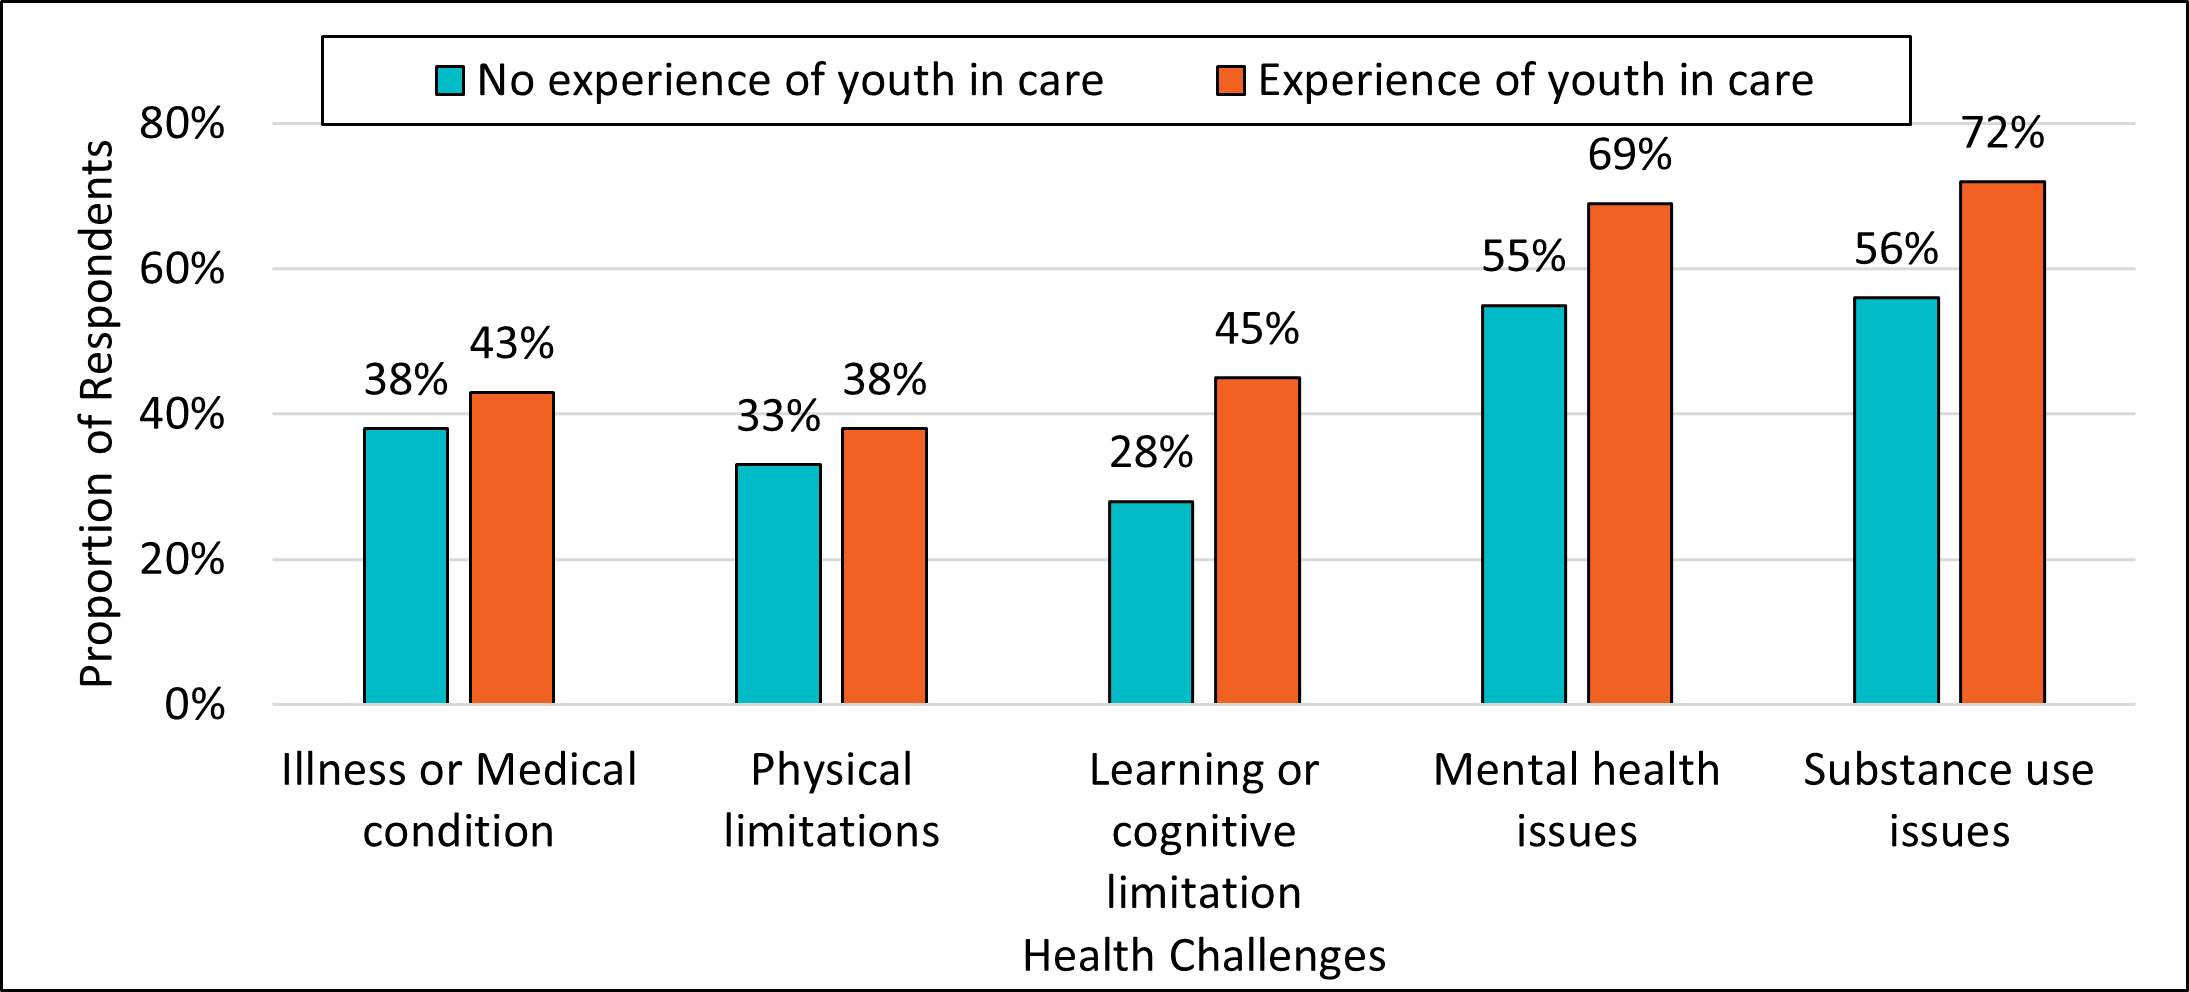
Respondents with experiences of youth in care reported higher rates for all health challenges, particularly for substance use issues, mental health issues and learning or cognitive limitations. When asked about their reason for housing loss, substance use was also cited more often (21%) compared to their counterparts (16%).
Figure 12. Health challenges among those who experienced youth in care
-
Figure 12 - Text version
Figure 12. Health challenges among those who experienced youth in care Health challenges Experience of youth in care No experience of youth in care Illness or Medical Condition 43% 38% Physical limitations 38% 33% Learning or cognitive limitation 45% 28% Mental health issues 69% 55% Substance use issues 72% 56%
Mobility between communities
Respondents were asked about where they had previously stayed and also about the duration of time within the current community. Those who have always lived in the community represented 13% of respondents. The remaining respondents had either come to the community within the last 5 years (44%) or had reported moving more than 5 years ago (43%).
Of those who did move, many identified first experiencing homelessness more than a year after moving to the community (40%) or more than a year prior to their move (43%). A smaller proportion first experienced homelessness within a year of their move (16%).
Sources of income
Respondents were asked about their current sources of income (respondents could indicate more than one). The majority (69%) reported having one source of income, with a further 23% reporting having two or more sources. The proportion of respondents who reported no income decreased with age, from 11% among youth, to 9% among adults, 6% among older adults and 2% among seniors.
Social assistance income was the most commonly reported source of income (45%), followed by disability benefits (25%), and employment income (12%). Seniors primarily relied on senior's benefits, while social assistance was prevalent across other age groups. Employment was more common among youth but decreased with age. Only 35% of those with dependants reported income from child and family tax benefits.
Principle sources of income |
Youth (13-24) |
Adult (25-49) |
Older Adults (50-64) |
Seniors (65+) |
|---|---|---|---|---|
1st |
Social assistance (43%) |
Social assistance (50%) |
Social assistance (46%) |
Senior's benefits (79%) |
2nd |
Employment income (21%) |
Disability benefits (25%) |
Disability benefits (34%) |
Disability benefits (13%) |
3rd |
Disability benefits (14%) |
Employment income (12%) |
Employment income (10%) |
Social assistance (8%) |
4th |
Tax benefits (9%) |
Informal sources (10%) |
Tax benefits (7%) |
Tax benefits (7%) |
5th |
Money from family and friends (9%) |
Tax benefits (9%) |
Informal sources (7%) |
Employment income (4%) |
Families with dependents
Overall, 10% of respondents reported being a member of a family and having at least one or more family member staying with them. Single parents and couples with dependants made up 5%, while the other 5% were couples without dependents. Single-parent families were largely female-led (79%).
The majority (61%) of respondents with dependents first experienced homelessness as an adult, while a third (34%) did so as a youth or child. Individuals with dependents were twice as likely (33%) to indicate that they were newcomers, in contrast to 15% of those without dependents.
2SLGBTQI+
Of all respondents, 13% identified as 2SLGBTQI+Footnote 8 compared to 4% of the general populationFootnote 9. This implies an overrepresentation of this group among people experiencing homelessness. Of those who identified as 2SLGBTQI+, 46% identified as bisexual, 12% as gay, and 9% as pansexual.
The rate of 2SLGBTQI+ responses was highest among youth (26%). The proportion decreased with age, accounting for 13% of adults, 7% of older adults, and 6% of seniors.
Figure 13. 2SLGBTQI+ identity and age
-
Figure 13 - Text version
Figure 13. 2SLGBTQI+ identity and age Age groups Non-2SLGBTQI+ 2SLGBTQI+ Youth (13-24) 74% 26% Adult (25-49) 87% 13% Older Adult (50-64) 93% 7% Senior (65+) 94% 6%
When asked about reasons for housing loss, 2SLGBTQI+ respondents cited mental health issues (15%) or having a conflict with a parent or guardian (12%) more often than their counterparts, 9% and 7% respectively.
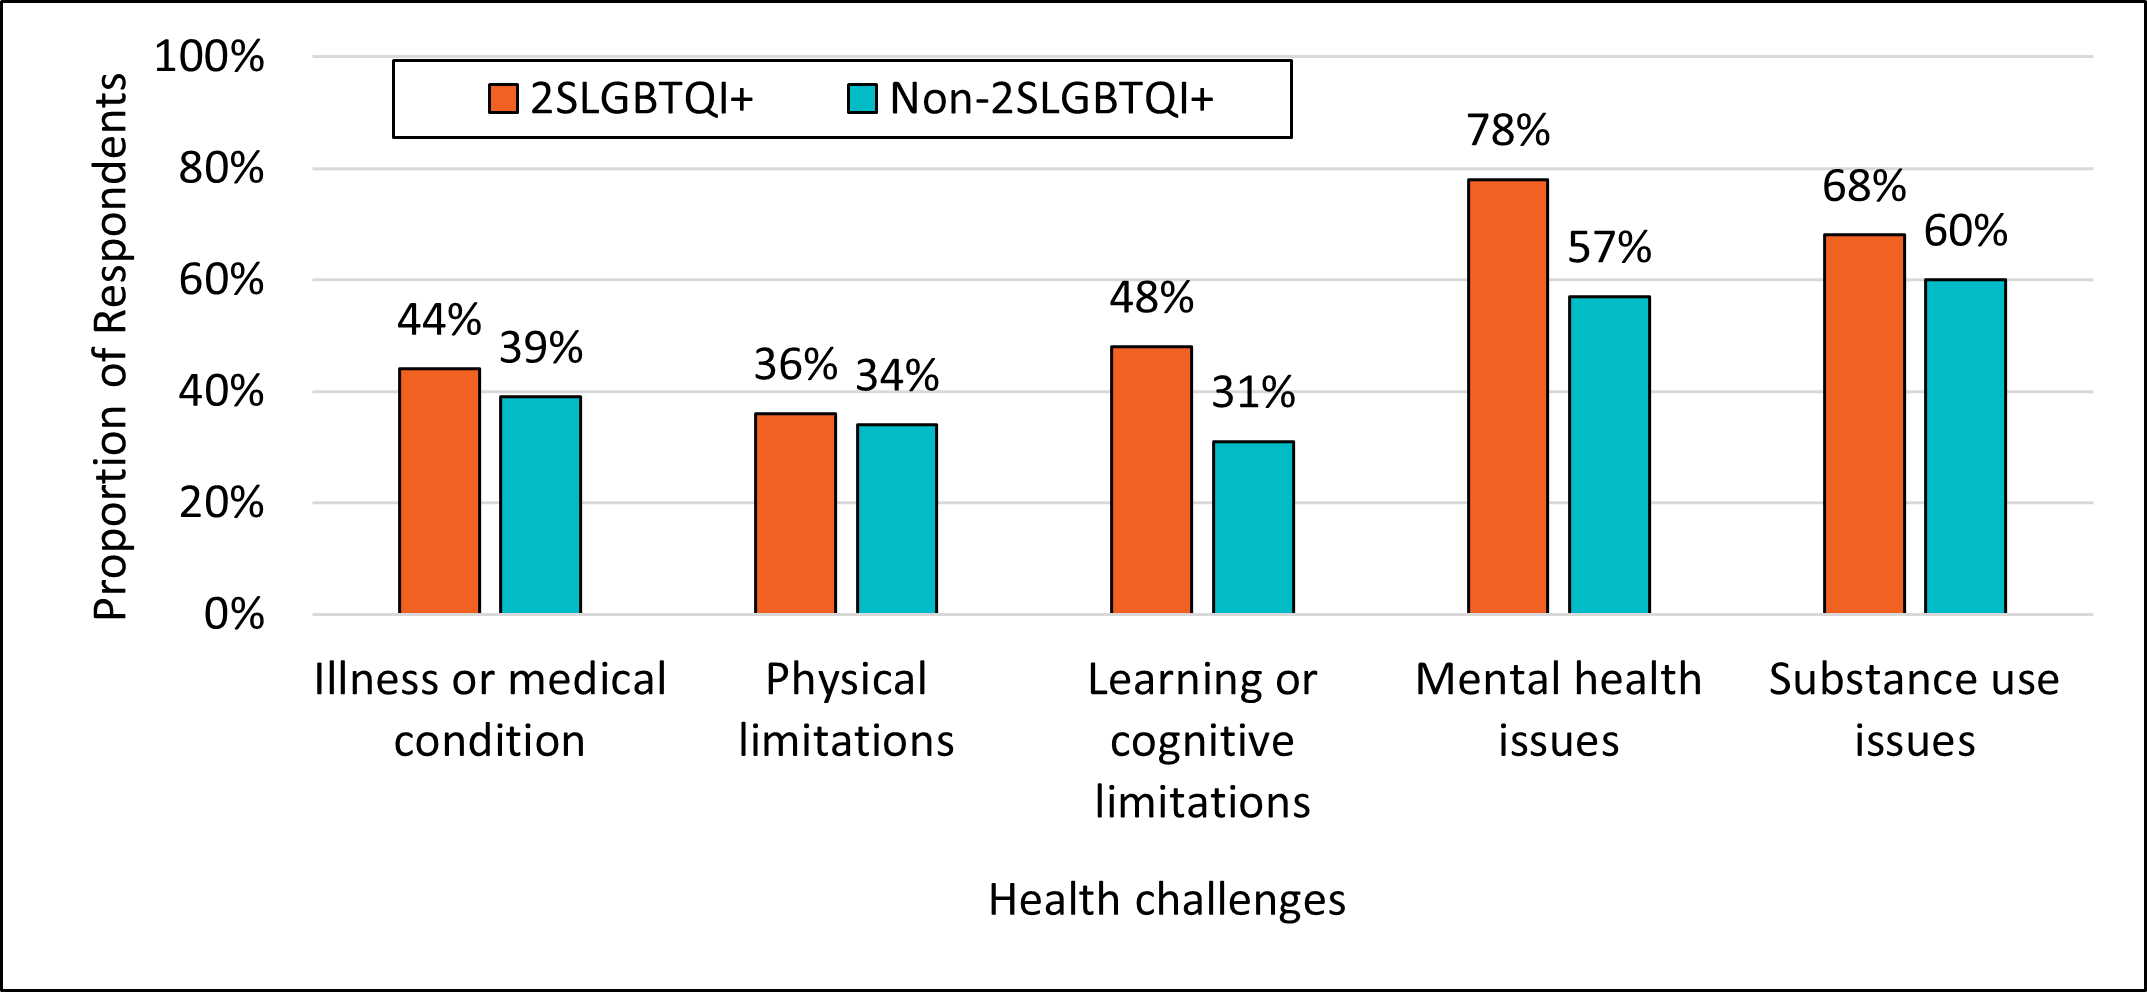
2SLGBTQI+ respondents had a greater likelihood of reporting all health challenges. Differences were greatest for learning or cognitive limitations and mental health issues.
Figure 14. 2SLGBTQI+ and health challenges
-
Figure 14 - Text version
Figure 14. 2SLGBTQI+ and health challenges Health challenges 2SLGBTQI+ Non-2SLGBTQI+ Illness or medical condition 44% 39% Physical limitations 36% 34% Learning or cognitive limitations 48% 31% Mental health issues 78% 57% Substance use issues 68% 60%
Indigenous peoples
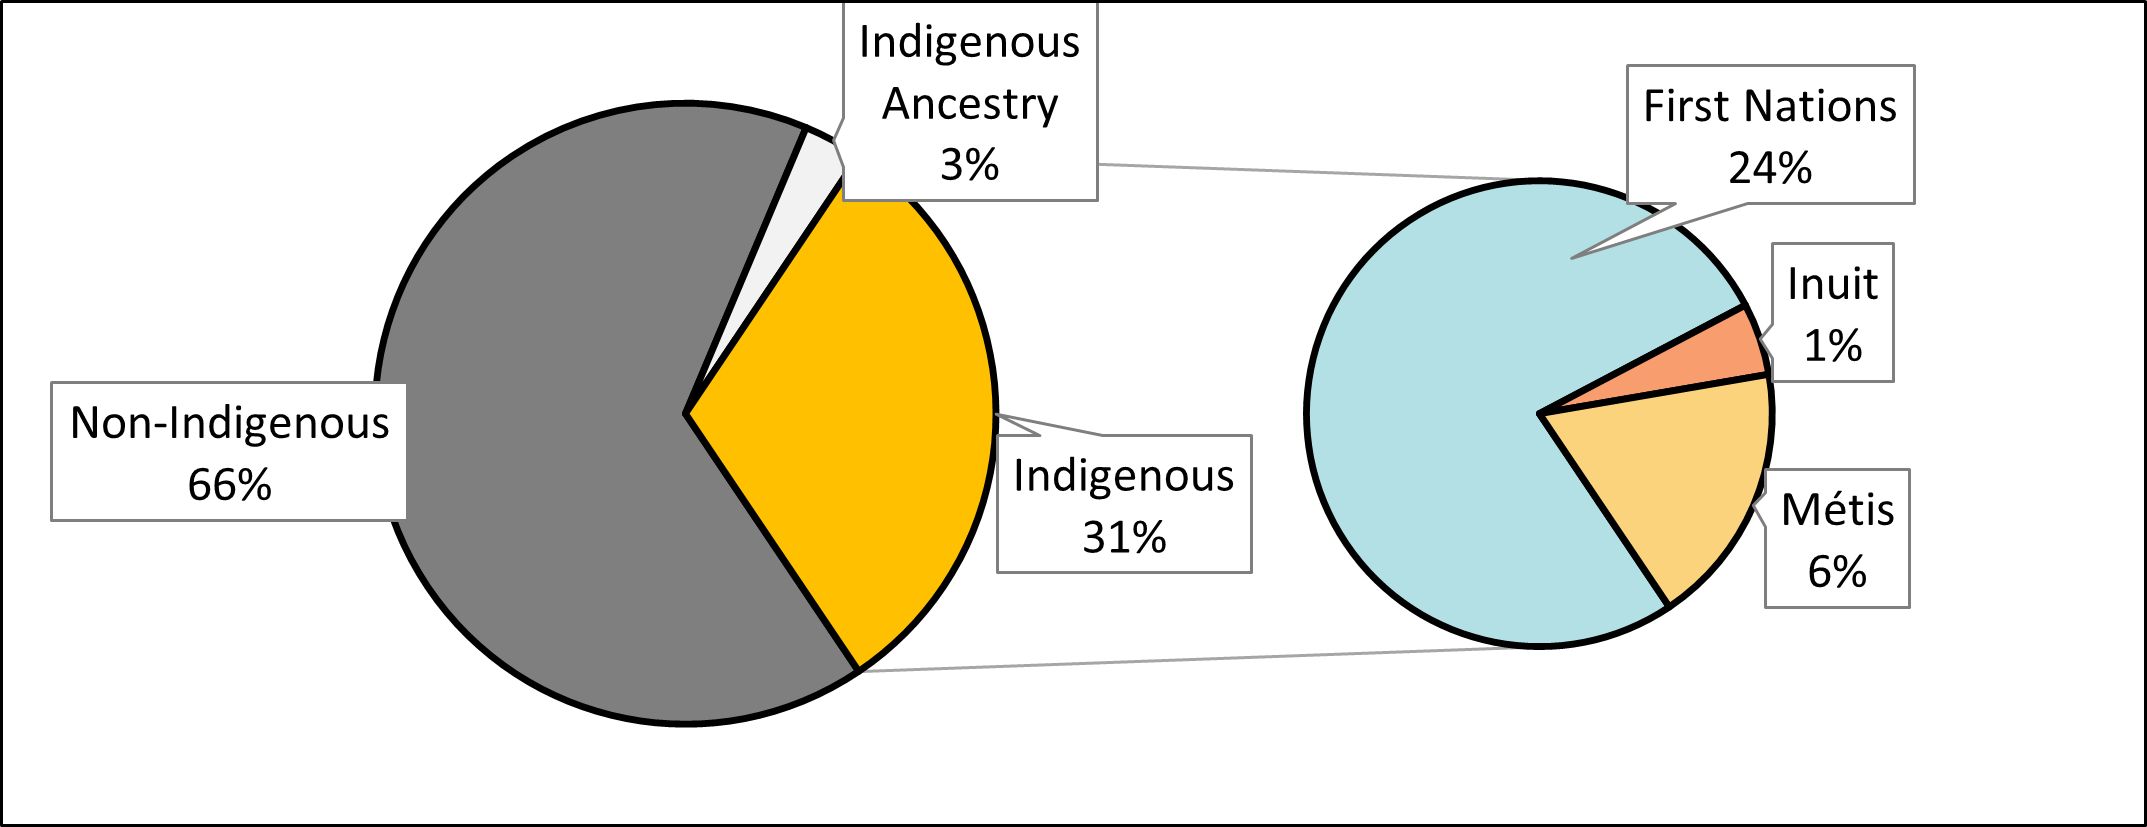
Respondents were asked if they identified as First Nations, Métis, Inuit, or if they had Indigenous ancestry. Nearly one third (31%) of respondents identified as Indigenous, including 24% who identified as First Nations, 6% as Métis and 2% InuitFootnote 10. Data from the Census also show that approximately 5% of Canadians identified as Indigenous, suggesting an overrepresentation of Indigenous Peoples experiencing homelessness.
Figure 15. Proportion of Indigenous respondents
-
Figure 15 - Text version
Figure 15. Proportion of Indigenous respondents Indigenous identity Proportion of respondents Non-Indigenous 66% First Nations 24% Inuit 2% Métis 6% Indigenous Ancestry 3%
The percentage of those who identified as Indigenous was higher among those who were staying in unsheltered locations (41%) and those who were experiencing hidden homelessness (45%) in comparison to other locations. This suggests that shelter-specific statistics are likely to underestimate the extent of Indigenous homelessness.
Indigenous respondents were more likely to identify as women (40%) compared to non-Indigenous respondents (31%).
Figure 16: Indigenous identity and gender identity

-
Figure 16 - Text version
Figure 16: Indigenous identity and gender identity Gender Non-indigenous Indigenous Man 66% 57% Woman 31% 40% Gender Diverse 2% 3%
Approximately 65% of Indigenous respondents were adults, which exceeded the percentage observed among non-Indigenous participants at 55%. Conversely, Indigenous respondents had a lower likelihood of being older adults or seniors (23%) compared to their non-Indigenous counterparts (34%).
A higher proportion of Indigenous respondents reported experiencing chronic homelessness (75%) compared to those who did not identify as Indigenous (68%). Rates were high across Indigenous populations, accounting for 75% of First Nations respondents, 73% of Métis respondents, and 80% of Inuit respondents.
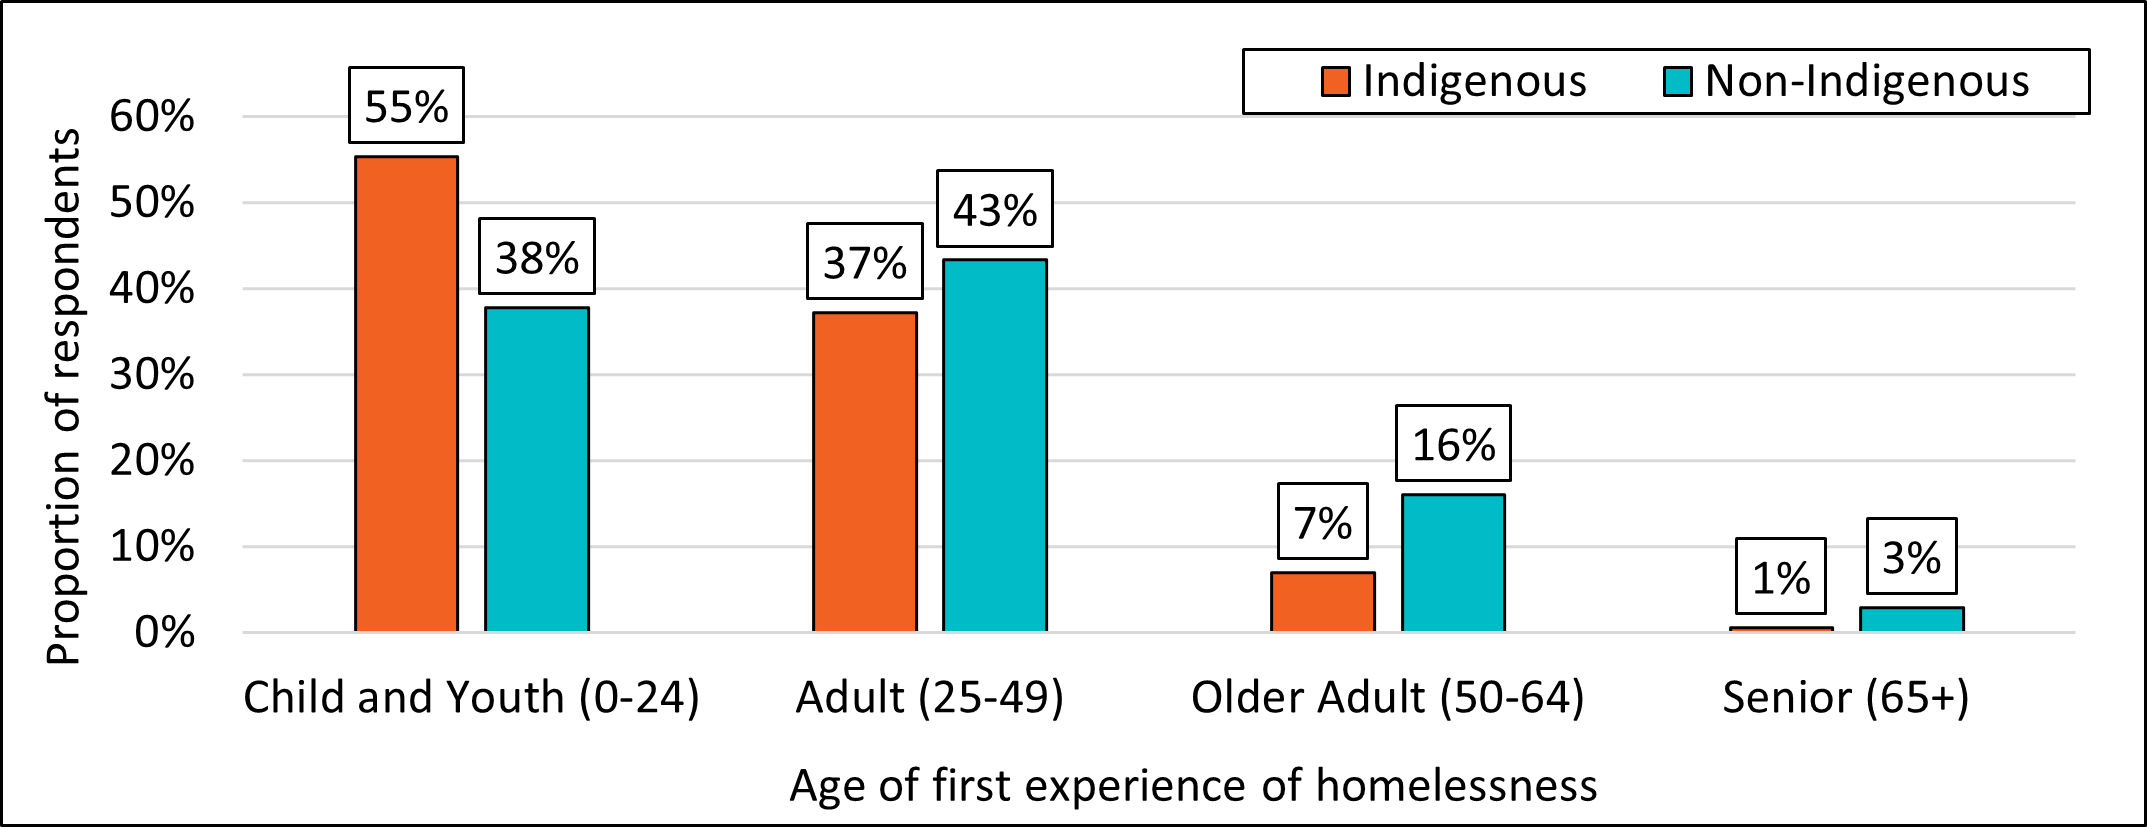
Indigenous respondents were more likely to report early experiences of homelessness. The majority (55%) of Indigenous respondents first experienced homelessness as a child or youth, while non-Indigenous respondents tended to have first experienced homelessness commonly as an adult. Indigenous respondents were also more likely to report having experience as a youth in care (51%) compared to non-Indigenous respondents (22%).
Figure 17. Age of first experience of homelessness and Indigenous identity
-
Figure 17 - Text version
Figure 17. Age of first experience of homelessness and Indigenous identity Age of first experience of homelessness Non-Indigenous Indigenous Indigenous Ancestry Child and Youth (0-24) 38% 55% 53% Adult (25-49) 43% 37% 36% Older Adult (50-64) 16% 7% 10% Senior (65+) 3% 1% 1%
Regarding reported health challenges, individuals identifying as Indigenous exhibited higher rates for all health issues compared to their counterparts. The largest difference was in substance use issues, reported by 69% of Indigenous respondents compared to 57% for non-Indigenous respondents.
Members of racialized groups
Information on racial identity was collected for the first time during the 2020-2022 Point-in-Time Counts. Survey respondents were able to self-identify one or more racial identityFootnote 11.
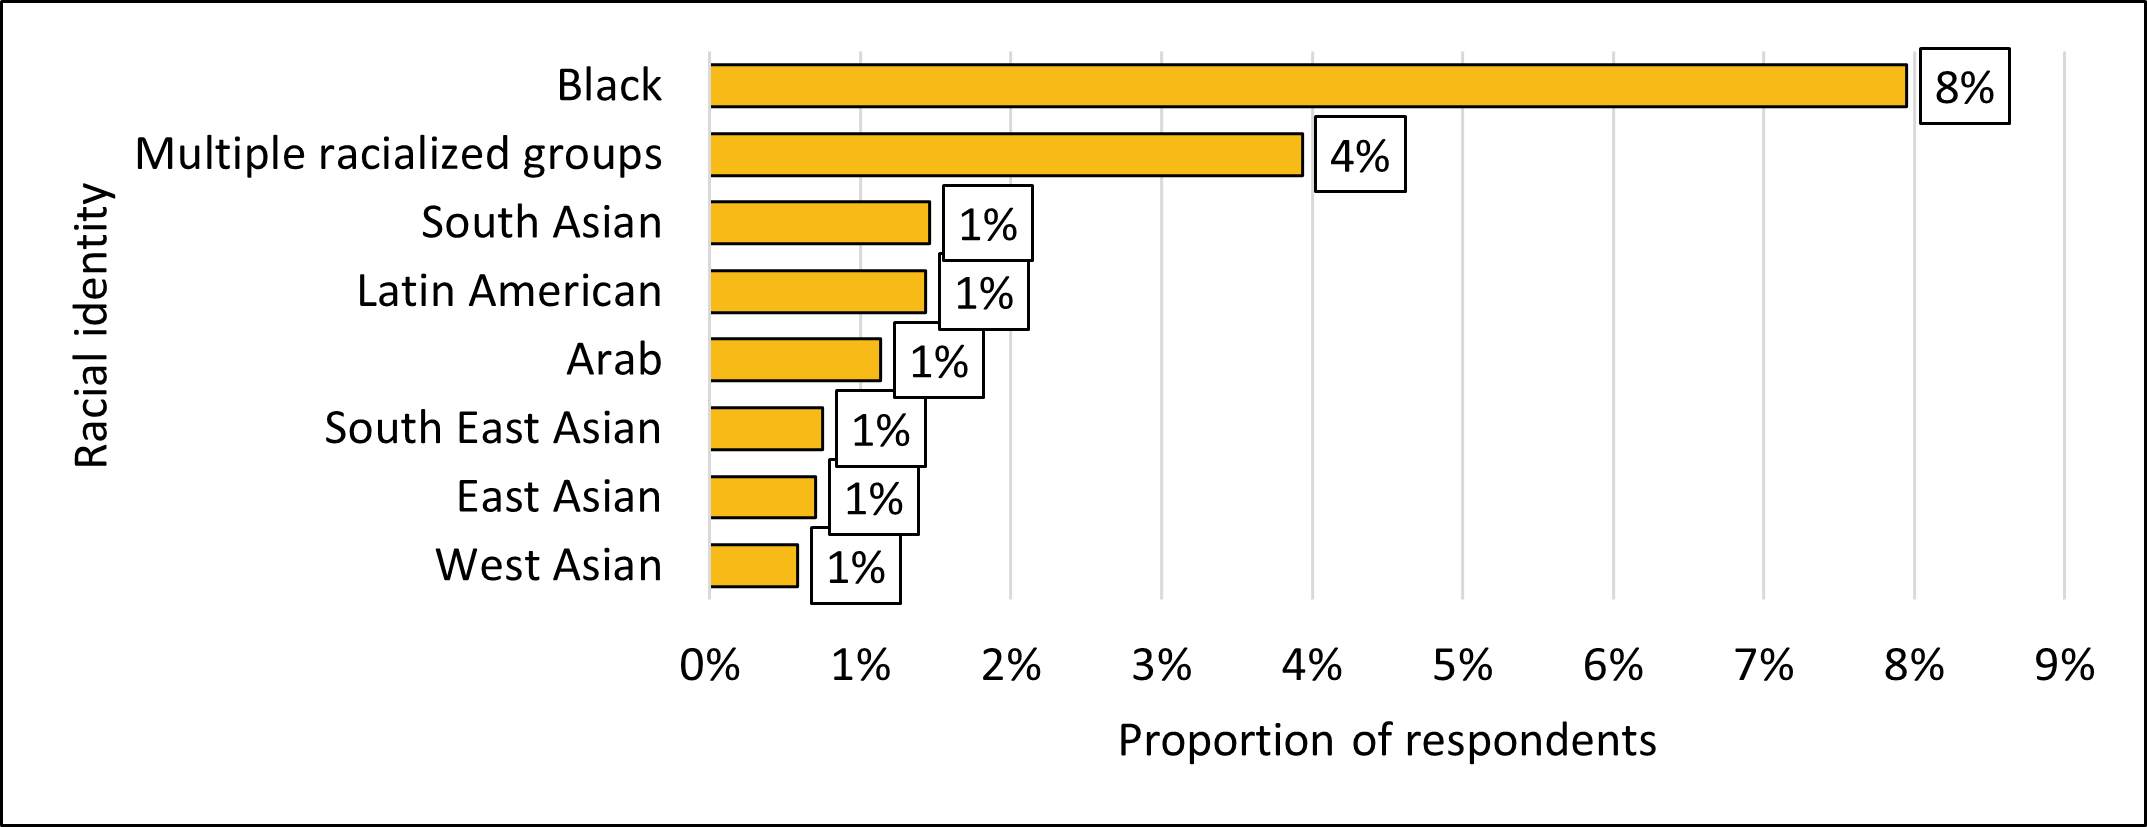
Twenty percent of respondents identified as a member of a racialized group. The most commonly reported racial identity was those who identified as Black (8%). 2021 Census data indicates a 4% of Canada's population is Black, suggesting overrepresentation among people experiencing homelessness.
Figure 18. Specified racialized group
-
Figure 18 - Text version
Figure 18. Specified racialized group Racial Identity Proportion of respondents West Asian 1% East Asian 1% South East Asian 1% Arab 1% Latin American 1% South Asian 1% Multiple racialized groups 4% Black 8%
Those belonging to a racialized group accounted for a higher proportion of respondents in the Central region (25%) than in the Eastern (3%) and the Western and Northern region (10%).
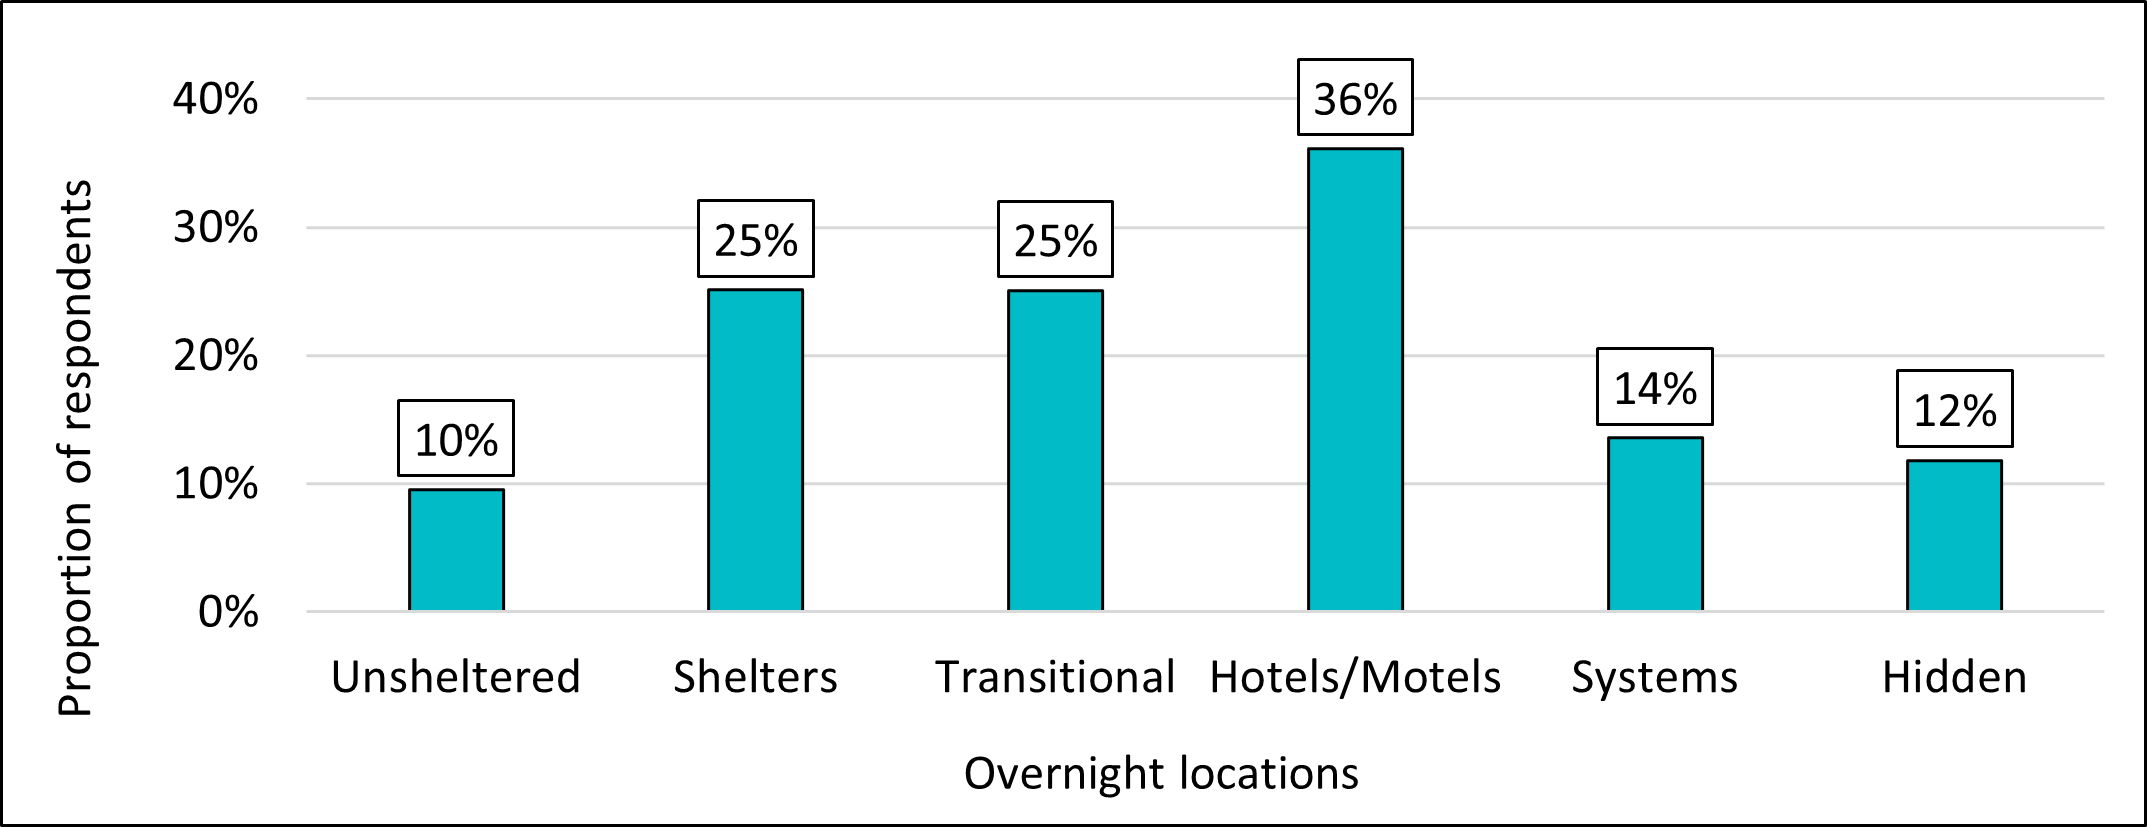
The percentage of respondents belonging to a racialized group was higher among respondents staying in hotel and motels (35%), shelters (25%) and transitional housing locations (25%) in comparison to other overnight locations.
Figure 19. Racialized groups by overnight location
-
Figure 19 - Text version
Figure 19. Racialized groups by overnight location - Unsheltered Shelters Transitional Hotels/Motels Systems Hidden Racialized group 10% 25% 25% 36% 14% 12%
Approximately, two-thirds (63%) of respondents belonging to a racialized group reported experiencing chronic homelessness, lower than the proportion reported among the non-racialized group (73%).
Respondents belonging to a racialized group were two times less likely to report substance use issues as a reason for their recent housing (10%) compared to the non-racialized group (20%). No other discernible differences between the two groups were seen for other reasons for housing loss.
Newcomer experience
Thirteen percent (13%) of respondents indicated that they had come to Canada as an immigrant (9%), refugee (2%) or refugee claimant (2%). In contrast, nearly 23% of individuals in the 2021 Census either are or have been landed immigrants or permanent residents in Canada. This suggests that newcomers to Canada likely experience lower homelessness rates than the overall population.
The prevalence of those with a newcomer experience was higher in the Central region (16%) than in the Western and Northern region (6%), and in the Eastern region (3%).
Figure 20. Newcomer experience by region

-
Figure 20 - Text version
Figure 20. Newcomer experience by region Region Immigrant Refugee Claimant Eastern 3% 0% 0% Central 11% 2% 3% Western and Northern 5% 1% 0%
The proportion of respondents who reported coming to Canada as newcomers was highest in hotels and motels (29%) followed by shelters (16%), transitional housing locations (15%), hidden homelessness (6%), unsheltered locations (5%) and in systems (3%). Over this period, Immigration, Refugees and Citizenship Canada provided funding for hotel spaces to provide temporary accommodations for refugee claimantsFootnote 12. This likely contributed to increasing the availability of hotel spaces for this population during the counts.
The majority of respondents who reported having come to Canada as a newcomer reported being in Canada for 5 or more years (71%). Of this group, most identified as having arrived as an immigrant (83%). The majority of recent newcomer respondents, those who arrived in Canada within the last 5 years, came as refugees (16%) and refugee (asylum) claimants (40%).
Figure 21. Newcomer experience by time in Canada

-
Figure 21 - Text version
Figure 21. Newcomer experience by time in Canada Newcomer status Historically Newcomer Recent Newcomer Immigrant 83% 43% Refugee 11% 16% Claimant 6% 40%
Recent newcomers were less likely to report chronic homelessness (50%) compared to those who had come to Canada five or more years ago (67%). Conversely, recent newcomers were more likely to report experiencing homelessness for the first time as youth (31%) and as adults (59%) compared to non-recent newcomers (25% and 46%, respectively).
Veterans
Respondents who identified as veterans of the Canadian Armed Forces (including the Canadian Army, Navy and Airforce) accounted for 4% of all respondents, while less than 1% identified as veterans of the Royal Canadian Mounted Police and less than 1% identified as veterans of both. In comparison, approximately 2% of the Canadian population identified as a veteran in the 2021 Census. This suggests that veterans are overrepresented among those who are experiencing homelessness. A similar proportion of respondents identified as a veteran in each overnight location. This ranged from 3% (in transitional housing and health or correctional systems) to 5% (in shelters and unsheltered areas).
Furthermore, veterans tended to be older compared to non-veterans. Veterans were more likely to report being an older adult (38%) and seniors (9%) compared to non-veterans, who accounted for 25% and 5% respectively. The majority of veteran respondents (79%) reported using a shelter in the last 12 months.
Veteran respondents primarily relied on social assistance (39%) and disability benefits (29%). Senior's benefits were mentioned by 12%, while 4% claimed Veteran Affairs Canada benefits as a source of incomeFootnote 13. The percentage seen for veteran's benefits may be undercounted, as individuals may be referring to the benefit as a disability benefit.
Veterans were more likely to report having an illness or medical condition (49%) and a physical limitation (47%) compared to non-veterans (39% and 34%, respectively).
Housing loss and the COVID-19 pandemic
Due to the COVID-19 pandemic, numerous communities and regions rescheduled the timing of the count to minimize pandemic-related risks. For the 59 communities and regions that conducted their counts in 2021 and 2022, a follow-up question to the reasons for housing loss was added, asking if recent housing loss was attributable to COVID-19.
COVID-19 was cited as the cause of their most recent housing loss by 12% of respondents. The proportion of this group across overnight locations varied between 9% in unsheltered locations and 14% in hotels and motels. This could be attributed to their utilization for additional shelter capacity and as isolation units during the pandemic.
Those who attributed their housing loss to COVID-19 were more likely to also identify a lack of income as a factor. Not having enough income for housing was identified by 43% of those who lost their housing due to COVID-19, compared to 26% of their counterparts.
Conclusion
Point-in-Time Counts help provide a better understanding of the number of people experiencing homelessness in shelters, transitional housing and in unsheltered locations. The findings from the counts can be used to inform the distribution of services within communities, in order to help those who are most vulnerable. The 2020-22 PiT Counts addressed several data gaps, by collecting information on health conditions, experiences of youth in care and racial identity.
The third Nationally Coordinated Point-in-Time Counts took place during an unprecedented time due to the COVID-19 pandemic. The pandemic affected the original timeframe for conducting the counts, and as a result, counts were carried out between March 2020 and December 2022. The pandemic also imposed an added level of complexity on communities, since additional measures were necessary to ensure the health and safety of all participants.
The findings from the 2020-2022 counts suggest that there has been an increase in the number of people who are experiencing homelessness, in particular those staying in unsheltered locations, as well as an increase in the rate of people experiencing chronic homelessness. In addition, survey results observed an overrepresentation among respondents who identify as Indigenous, as veterans, as 2SLGBTQI+, and as Black.
Annex A – 2020-2022 Point-in-Time Count Survey
C. [Surveyor: Indicate overnight location]
- DECLINE TO ANSWER [THANK & END]
- OWN APARTMENT / HOUSE [THANK & END]
- SOMEONE ELSE'S PLACE [CONTINUE TO QUESTION C1]
- MOTEL/HOTEL (SELF-FUNDED) [CONTINUE TO QUESTION C1]
- HOSPITAL [CONTINUE TO QUESTION C1]
- TREATMENT CENTRE [CONTINUE TO QUESTION C1]
- JAIL, PRISON, REMAND CENTRE [CONTINUE TO QUESTION C1]
- HOMELESS SHELTER (EMERGENCY, FAMILY OR DOMESTIC VIOLENCE SHELTER) [BEGIN SURVEY]
- HOTEL/MOTEL (FUNDED BY CITY OR HOMELESS PROGRAM) [BEGIN SURVEY]
- TRANSITIONAL SHELTER/HOUSING [BEGIN SURVEY]
- UNSHELTERED IN A PUBLIC SPACE (E.G. STREET, PARK, BUS SHELTER, FOREST OR ABANDONED BUILDING) [BEGIN SURVEY]
- ENCAMPMENT (E.G. GROUP OF TENTS, MAKESHIFT SHELTERS OR OTHER LONG-TERM OUTDOOR SETTLEMENT) [BEGIN SURVEY]
- VEHICLE (CAR, VAN, RV, TRUCK, BOAT) [BEGIN SURVEY]
- UNSURE: INDICATE PROBABLE LOCATION _____ (b. - m.) [BEGIN SURVEY]
C1. Do you have access to a permanent residence where you can safely stay as long as you want?
- YES [THANK & END]
- NO (NOT PERMANENT AND/OR NOT SAFE) [BEGIN SURVEY]
- DON'T KNOW [BEGIN SURVEY]
- DECLINE TO ANSWER [THANK & END]
Begin survey
1. Do you have family members or anyone else who is staying with you tonight? [Indicate survey number for partners. Check all that apply]
- NONE
- PARTNER - Survey #:
- OTHER (Can include other family or friends)
- DECLINE TO ANSWER
- CHILD(REN)/DEPENDENT(S)
- Indicate gender and age for each:
2. How old are you? [OR] What year were you born? [If unsure, ask for best estimate]
- AGE OR YEAR BORN:
- DON'T KNOW
- DECLINE TO ANSWER
For this survey, “homelessness” means any time when you have been without a permanent and secure place to live, including sleeping in shelters, on the streets, or living temporarily with others without having your own permanent housing (e.g., couch surfing).
3. How old were you the first time you experienced homelessness?
- AGE:
- DON'T KNOW
- DECLINE TO ANSWER
4. In total, for how much time have you experienced homelessness over the PAST YEAR (the last 12 months)? [Does not need to be exact. Best estimate.]
- LENGTH: ___ DAYS | WEEKS | MONTHS
- DON'T KNOW
- DECLINE TO ANSWER
5. Have you stayed in a homeless shelter in the past year? For example, (COMMUNITY NOTE: Include examples of emergency shelters and extreme weather shelters for interviewers to provide).
- YES
- NO
- DON'T KNOW
- DECLINE TO ANSWER
6. Did you come to Canada as an immigrant, refugee or a refugee claimant (i.e., applied for refugee status after coming to Canada)?
- YES, IMMIGRANT
- YES, REFUGEE
- YES, REFUGEE CLAIMANT
- NO
- DON'T KNOW
- DECLINE TO ANSWER
If yes, How long have you been in Canada?
- LENGTH: ___________ DAYS | WEEKS | MONTHS | YEARS OR DATE: ______/_______/______ DAY / MONTH / YEAR
- DON'T KNOW
- DECLINE TO ANSWER
7. How long have you been in (community name)?
- LENGTH ______ DAYS / WEEKS / MONTHS / YEARS
- ALWAYS BEEN HERE
- DON'T KNOW
- DECLINE TO ANSWER
Where did you live before you came here?
- CITY: ____________________ | PROVINCE/TERRITORY/COUNTRY: ________________
- DECLINE TO ANSWER
8a. Do you identify as First Nations (with or without status), Métis, or Inuit, or do you have North American Indigenous ancestry? [If yes, please specify] (COMMUNITY NOTE: The wording of this question can be adapted to what makes sense in your community, for example by listing specific First Nations)
- YES, FIRST NATIONS
- YES, INUIT
- YES, MÉTIS
- YES, INDIGENOUS ANCESTRY
- NO
- DON'T KNOW
- DECLINE TO ANSWER
8b. In addition to your response in the question above, do you identify with any of the racial identities listed below? [Show or Read list. Select all that apply]
- ARAB (e.g., Syrian, Egyptian, Yemeni)
- ASIAN-EAST (e.g., Chinese, Korean, Japanese)
- ASIAN- SOUTH-EAST (e.g., Filipino, Vietnamese, Cambodian, Malaysian, Laotian)
- ASIAN-SOUTH OR INDO-CARIBBEAN (e.g., Indian, Pakistani, Sri Lankan, Indo-Guyanese, Indo-Trinidadian)
- ASIAN-WEST (e.g., Iranian, Afghan)
- BLACK-CANADIAN/AMERICAN
- BLACK-AFRICAN (e.g., Ghanaian, Ethiopian, Nigerian)
- BLACK-AFRO-CARIBBEAN OR AFRO-LATINX (e.g., Jamaican, Haitian, Afro-Brazilian)
- LATIN AMERICAN (e.g., Brazilian, Mexican, Chilean, Cuban)
- WHITE (e.g., European, French, Ukrainian, Euro-Latinx)
- NOT LISTED (PLEASE SPECIFY): _________________
- IDENTIFY AS INDIGENOUS ONLY
- DON'T KNOW
- DECLINE TO ANSWER
9. Have you ever served in the Canadian Military or RCMP? [Military includes Canadian Navy, Army, or Air Force]
- YES, MILITARY
- YES, RCMP
- BOTH MILITARY AND RCMP
- NO
- DON'T KNOW
- DECLINE TO ANSWER
10. As a child or youth, were you ever in foster care or in a youth group home (COMMUNITY NOTE: include any other Provincial child welfare programs)? [Note: This question applies specifically to child welfare programs.]
- YES
- NO
- DON'T KNOW
- DECLINE TO ANSWER
11. Do you identify as having any of the following health challenges at this time:
ILLNESS OR MEDICAL CONDITION [e.g., diabetes, arthritis, TB, HIV]
- YES
- NO
- DON'T KNOW
- DECLINE TO ANSWER
PHYSICAL LIMITATION [e.g., challenges with mobility, physical abilities or dexterity]
- YES
- NO
- DON'T KNOW
- DECLINE TO ANSWER
LEARNING OR COGNITIVE LIMITATIONS [e.g., dyslexia, autism spectrum disorder, or as a result of ADHD or an acquired brain injury]
- YES
- NO
- DON'T KNOW
- DECLINE TO ANSWER
MENTAL HEALTH ISSUE [diagnosed/undiagnosed] [e.g., depression, Post traumatic stress disorder (PTSD), bipolar disorder]
- YES
- NO
- DON'T KNOW
- DECLINE TO ANSWER
SUBSTANCE USE ISSUE [e.g., tobacco, alcohol, opiates]
- YES
- NO
- DON'T KNOW
- DECLINE TO ANSWER
12. What gender do you identify with? [Show list.]
- MAN
- WOMAN
- TWO-SPIRIT
- TRANS WOMAN
- TRANS MAN
- NON-BINARY (GENDERQUEER)
- NOT LISTED: ________________________
- DON'T KNOW
- DECLINE TO ANSWER
13. How do you describe your sexual orientation, for example straight, gay, lesbian? [Show list.]
- STRAIGHT/HETEROSEXUAL
- GAY
- LESBIAN
- BISEXUAL
- TWO-SPIRIT
- PANSEXUAL
- ASEXUAL
- QUESTIONING
- QUEER
- NOT LISTED: ________________
- DON'T KNOW
- DECLINE TO ANSWER
14a. What happened that caused you to lose your housing most recently? [Do not read the options. Check all that apply. “Housing” does not include temporary arrangements (e.g., couch surfing) or shelter stays. Follow up for the reason if the respondent says “eviction” or that they “chose to leave”.]
A: HOUSING AND FINANCIAL ISSUES
- NOT ENOUGH INCOME FOR HOUSING (E.G. LOSS OF BENEFIT, INCOME, OR JOB)
- UNFIT/UNSAFE HOUSING CONDITION
- BUILDING SOLD OR RENNOVATED
- OWNER MOVED IN
- LANDLORD/TENANT CONFLICT
- COMPLAINT (E.G. PETS/NOISE/DAMAGE)
- LEFT THE COMMUNITY/RELOCATED
B: INTERPERSONAL AND FAMILY ISSUES
- CONFLICT WITH: SPOUSE / PARTNER
- CONFLICT WITH: PARENT / GUARDIAN
- CONFLICT WITH: OTHER (________________)
- EXPERIENCED ABUSE BY: SPOUSE / PARTNER
- EXPERIENCED ABUSE BY: PARENT / GUARDIAN
- EXPERIENCED ABUSE BY: OTHER (_____-_____)
- DEPARTURE OF FAMILY MEMBER
- EXPERIENCED DISCRIMINATION
C: HEALTH OR CORRECTIONS
- PHYSICAL HEALTH ISSUE
- MENTAL HEALTH ISSUE
- SUBSTANCE USE ISSUE
- HOSPITALIZATION OR TREATMENT PROGRAM
- INCARCERATION (JAIL OR PRISON)
- OTHER REASON: ________________
- DON'T KNOW
- DECLINE TO ANSWER
14b. Was your most recent housing loss related to the COVID-19 pandemic?
- YES
- NO
- DON'T KNOW
- DECLINE TO ANSWER
14c. How long ago did that happen (that you lost your housing most recently)? (Best estimate)
- LENGTH ______________ DAYS | WEEKS | MONTHS | YEARS
- DON'T KNOW
- DECLINE TO ANSWER
15. What are your sources of income? [Reminder that this survey is anonymous. Read list and check all that apply]
- FULL TIME EMPLOYMENT
- PART TIME EMPLOYMENT
- CASUAL EMPLOYMENT (E.G. CONTRACT WORK)
- INFORMAL INCOME SOURCES (E.G. BOTTLE RETURNS, PANHANDLING)
- MONEY FROM FAMILY/FRIENDS
- EMPLOYMENT INSURANCE
- DISABILITY BENEFIT [Name of PROV. DISABILITY BENEFIT]
- SENIORS BENEFITS (E.G. CPP/OAS/GIS)
- WELFARE/SOCIAL ASSISTANCE [Prov. Benefit]
- VETERAN/VAC BENEFITS
- CHILD AND FAMILY TAX BENEFITS
- GST/HST REFUND
- OTHER MONEY FROM A SERVICE AGENCY
- OTHER SOURCE: ____________
- NO INCOME
- DON'T KNOW
- DECLINE TO ANSWER
Annex B – Glossary
- 2SLGBTQI+
- The acronym used by the Government of Canada to refer to the Canadian community. 2S: at the front, recognizes Two-Spirit people as the first 2SLGBTQI+ communities; L: Lesbian; G: Gay; B: Bisexual; T: Transgender; Q: Queer; I: Intersex, considers sex characteristics beyond sexual orientation, gender identity and gender expression; +: is inclusive of people who identify as part of sexual and gender diverse communities, who use additional terminologies.
- Adult
- Person between the ages of 25 and 49.
- Central region
- Consists of communities in the provinces of Ontario and Québec.
- Chronic
- Refers to individuals who have experienced 6 or more months of homelessness over the last year.
- Chronic homelessness
Refers to individuals who are currently experiencing homelessness AND who meet at least 1 of the following criteria:
- they have a total of at least 6 months (180 days) of homelessness over the past year
- they have recurrent experiences of homelessness over the past 3 years, with a cumulative duration of at least 18 months (546 days)
Given the Point-in-Time Counts look at the experiences of homelessness during last 12 months, only the first component of the chronic homelessness definition is considered when analysing the data.
- Core Locations
The principal locations included in the Point-in-Time Count Enumeration and the Survey on Homelessness are:
- Unsheltered
- Sheltered
- Transitional housing
- Dependent
- A person that is considered to be a dependent of a Family Head and is a child.
- Eastern region
- Consists of communities in the provinces of New Brunswick, Nova Scotia, Prince Edwards Island and Newfoundland.
- Hidden Homelessness
- A Point-in-Time Count Enumeration is always in reference to a single night, with the Survey on Homelessness in reference to up to one month. Hidden Homelessness is a core Location for the survey. It includes people living temporarily with others or accessing temporary accommodations, without guarantee of continued residency or access to a safe and permanent residence. Because it is not possible to measure or count the extent of hidden homelessness using the PiT Count methodology, hidden homelessness is not part of the core Locations for the PiT Count Enumeration.
- Homelessness
- The living situation of an individual or family who does not have stable, permanent, appropriate housing, or the immediate prospect, means and ability of acquiring a home.
- Family
- People who report being in the company of 1 or more family members during their episode of homelessness.
- First Nations
- An individual who self-identifies as First Nations.
- Immigrant
- A landed immigrant/permanent resident is a person who has been granted the right to live in Canada permanently by immigration authorities. This is self reported at time of shelter entry.
- Indigenous Ancestry
- A person who does not identify as First Nations, Inuit or Métis, but has ancestry that may have identified as Indigenous.
- Indigenous Peoples
- A person who self-identifies as being First Nations, Métis, Inuit, status or non status person, regardless of residency or membership status.
- Inuit
- An individual who self-identifies as Inuit.
- Métis
- An individual who self-identifies as Métis.
- Non-Indigenous
- A person who self-identifies as not being First Nations, Inuit or Métis.
- Non-newcomer
- Individuals who self reported to have not immigrated into Canada.
- Older adult
- Person between the ages of 50 and 64.
- Partner
- Person who is a member of a couple.
- PiT Count Enumeration
- Number of people experiencing homelessness on a single night during a specified period.
- Refugee
- A person who is outside of their home country, or country where they normally live, and fears returning to that country because of a well-founded fear of persecution for reasons of race, religion, nationality, membership in a particular social group or political opinion.
- Refugee claimant
- A person who has applied for refugee protection status while in Canada and is waiting for a decision on a claim from the Immigration and Refugee Board of Canada.
- Respondent
- The person providing answers to the screening or survey questions in the PiT Count Enumeration or the Survey on Homelessness.
- Senior
- Person aged 65 and older.
- Sheltered Homelessness
- A Point-in-Time Count Enumeration is always in reference to a single night, with the Survey on Homelessness in reference to up to one month. Sheltered Homelessness is a core Location for both the enumeration and survey. It is based on shelter occupancies for that night. It can include emergency shelters, extreme weather shelters, Domestic Violence shelters, and where applicable, it may also include hotel or motel rooms provided to families or individuals experiencing homelessness in lieu of shelter beds.
- Single adult
- Person who is not part of a family with a partner and/or children during an episode of homelessness.
- Systems
Facilities that are regulated by either federal, provincial or municipal bodies such as:
- hospitals
- treatment centres
- prisons
- jails, and
- detention centres
- Survey on Homelessness
- A survey administered to people experiencing homelessness in the core locations of unsheltered, sheltered, transitional housing, and hidden homelessness. Questions include core Questions, as well as Local Questions added by communities to meet their own data needs.
- Transitional Housing
- A Point-in-Time Count Enumeration is always in reference to a single night, with the Survey on Homelessness in reference to up to one month. Transitional Housing is a core Location for both the enumeration and survey and includes short-term supportive housing. These programs are meant as a step to permanent housing, where clients can remain for longer terms. Transitional housing with stays guaranteed for longer than a year, where residents have security of tenure and pay a portion of the rent, should not normally be included. This category can include people in transitional bed-based facilities located in other service providers. These should be included only if the respondents would otherwise be homeless.
- Unsheltered Homelessness
A Point-in-Time Count Enumeration is always in reference to a single night, with the Survey on Homelessness in reference to up to one month. Unsheltered Homelessness is a core Location for both the enumeration and survey. It is determined using screening questions administered on the night of the PiT Count Enumeration or the following day. Some communities include observed homelessness, if they are unable to engage with someone and are following strict criteria for including them (e.g., a person is observed sleeping outside with their belongings).
The geographic area can include the entire community, known locations within a community, a sample of neighbourhoods, or a mixed approach.
Surveys are administered in places unfit for human habitation, including streets, alleys, parks, encampments and other greenspaces, transit stations, abandoned buildings, vehicles, ravines, and other outdoor locations where people experiencing homelessness are known to sleep.
- Veteran
- A former member of the Canadian Armed Forces or the Royal Canadian Mounted Police. This is self reported at time of survey entry.
- Western and Northern region
- Consists of communities in the provinces of British Columbia, Alberta, Saskatchewan and Manitoba, as well as the territory of Yukon and the Northwest Territories.
- Youth
- Person between the ages of 13 and 24 who identified to be unaccompanied by a parent or guardian during their episode of homelessness.
-
Copyright
© 2023 HIS MAJESTY THE KING IN RIGHT OF CANADA as represented by the Minister of Housing, Infrastructure and Communities.
Catalogue No. T94-54/2024E-PDF
ISBN 978-0-660-69555-6
Report a problem on this page
- Date modified:
