Homelessness Partnering Strategy Coordinated Canadian Point-in-Time Counts
On this page
Request other formats online or call 1 800 O-Canada (1-800-622-6232). If you use a teletypewriter (TTY), call 1-800-926-9105. Large print, braille, audio cassette, audio CD, e-text diskette, e-text CD and DAISY are available on demand.
Introduction
This report provides a first look at the key findings of the 2016 Coordinated Point-in-Time (PiT) Count. These findings include the basic demographics of participants surveyed, as well as their reported experiences of homelessness, their income sources and their reasons for losing their housing.
The results highlighted in this report are based on the surveys conducted across the 32 participating communities. These surveys were done in large and small urban communities, as well as in relatively rural and remote communities.
In June 2016, the Government of Canada announced that a second count would take place during March and April 2018. Information from this second count, when compared with 2016 count findings, will help communities understand changes in local homeless populations over time.
As more communities participate in future coordinated counts, findings from the Coordinated PiT Count can help to develop a truly national understanding of homelessness in Canada.
Acknowledgements
This report was prepared by Dr. Patrick Hunter, Policy Analyst for Employment and Social Development Canada, and reflects the work by the PiT Count Implementation team, the National PiT Count Working Group and all of the following 32 communities that participated in the 2016 Count:
West
British Columbia
- Victoria
- Nanaimo
- Nelson
- Kelowna
- Prince George
- Comox
Yukon
- Whitehorse
Saskatchewan
- Regina
- Prince Albert
Manitoba
- Brandon
- Thompson
Ontario
- Brantford
- Guelph and Wellington County
- Halton
- Hamilton
- Kingston
- London
- Nipissing / North Bay
- Peterborough
- Sault-Ste-Marie
- St. Catharines / Niagara / Thorold
- Thunder Bay
- Windsor
- York Region
East
New Brunswick
- Fredericton
- Moncton
- Saint John
- Bathurst
Nova Scotia
- Halifax
- Cape Breton
Prince Edward Island
- Charlottetown
- Summerside
Background
Between January 1 and April 30, 2016, the Government of Canada provided support to 32 communities across Canada that participated in a coordinated count of homeless populations in their respective areas. These communities used the Point-in-Time (PiT) Count method (described below) in order to better understand the nature and scope of local homelessness.
Some communities in Canada have been conducting their own homeless counts for more than a decade. However, they have been doing so at different times of year and using different approaches. The 2016 Coordinated PiT Count marked the first time that communities across provinces and territories in Canada have used a common approach when doing a homeless count. This approach was developed by a national working group that included experts from communities that have experience conducting counts.
What is a “Point-in-Time” count?
A Point-in-Time (PiT) count is a one-day snapshot of homelessness in shelters and on the streets within a community. A PiT count estimates how many people are experiencing homelessness in emergency shelters, in transitional housing and in unsheltered locations on the day of the count. It can also include people who are in health or corrections facilities like hospitals, detox centres, detention centres or jails; these people often have no place to go when they are released from these facilities.
The PiT count is not just a count; it includes survey questions aimed at getting information to better understand the population of people experiencing homelessness. This information can help determine what interventions are needed to help move people experiencing homelessness into a stable housing situation.
PiT counts can be repeated over subsequent years to evaluate progress in reducing homelessness, track demographic changes and monitor evolving service needs in order to better allocate resources.
Limitations of a PiT count
A PiT count cannot reach all of the people who are homeless in the community over a period of time. People often cycle in and out of homelessness, so some people will not be homeless during the count but may have been the day before, or may become homeless the day after. Moreover, it cannot reach all people regarded as “hidden” homeless—those who are temporarily staying with friends or family because they have no place of their own.
For these reasons, PiT counts should be complemented by other information gathering approaches, such as period prevalence counts, which collect administrative data over the course of a year, or the creation of a by-name list, a real-time registry of people who enter and exit homelessness within a community.
A common approach
The approach used for the 2016 Coordinated PiT Count was designed so that each community would have a common baseline with which to assess local homelessness. It included a definition of the core populations experiencing homelessness, core screening and survey questions and the basic methodology for the enumeration. It allowed the results of individual communities to be combined into a broader picture, helping to improve the understanding of homelessness across the country and the supports needed to address it.
Communities can potentially build on this core approach to better address local priorities. This can mean including other populations considered to be homeless (e.g., people within the corrections system without a permanent address). It can also mean adding survey questions that address local information needs. For example, several communities conducted a joint PiT Count and Registry Week, which creates a by-name list of people experiencing homelessness in the community and housing interventions.
Core populations: Who was surveyed?
PiT count core populations included people who were sleeping in unsheltered locations (e.g., alleys, parks and other public spaces, abandoned buildings, cars, etc.), emergency shelters, cold weather shelters, transitional facilities and shelters for women fleeing violence.
Some communities were also able to survey people who were in health or corrections facilities (e.g., hospitals, detox facilities, jails, prisons or detention centres). Many communities also chose to conduct surveys with people experiencing “hidden homelessness” (staying temporarily with someone else because they are without a place of their own). In most cases, they were encountered in outdoor locations, in service locations or at “magnet events” intended to engage this population.
Core questions: What was asked?
The core questions solicited the following information:
- whether respondents had a permanent residence
- where they were staying on the night of the count
- whether respondents were experiencing family homelessness
- what their age was
- what gender they identified with
- whether they identified as Indigenous or Aboriginal
- whether they had served in the Canadian Armed Forces or Royal Canadian Mounted Police
- whether they came to Canada as an immigrant or refugee in the past five years
- whether they moved to the community in the past year
- what length of time they spent homeless over the past year
- what number of distinct homeless episodes they had over the past year
- whether they used a shelter over the past year
- what the reasons were for their most recent housing loss
- what sources of income they had
The full list of core questions and response options used in 2016 can be found in the Guide to Point-in-Time Counts in Canada of the Homelessness Partnering Strategy.
Conducting the 2016 Coordinated Point-in-Time Count
Preparing for the count
This was the first PiT count for 28 of the 32 communities. In the months leading up to the count, implementation guidelines and tools were developed for the communities with the support of the Government of Canada’s Homelessness Partnering Strategy (HPS) Program. These included:
The Guide to Point-in-Time Counts in Canada of the Homelessness Partnering Strategy – The guide provided the core methodology for the PiT count, the common core questions, and guidelines and advice for planning a count. It was developed to support the coordinated count, but can serve as a general guide to any community wishing to conduct a PiT count.
The Point-in-Time Count Toolkit – This was developed by the Canadian Observatory on Homelessness with the support of the HPS. It provided practical tips and tools that could be downloaded and adapted for use by participating communities.
PiT Count Coordinator Training Sessions – Participating communities were provided with a training workshop for planning and conducting a count. The workshop included simulations and question and answer sessions. Workshop attendees benefitted from the experience of experts from communities that had previous experience conducting PiT counts.
The PiT Count section on the Community Workspace on Homelessness – In order to foster collaboration and knowledge sharing among communities, the HPS Program supported the development of a PiT Count section on the Workspace—an online collaborative space where practitioners and experts can share information and resources.
Launching the count
The community PiT counts took place across Canada between January 16 and April 25, 2016, with most counts occurring between the end of February and mid-April.

Text description of Figure 1: 32 Participating Communities
There were 32 participating communities in the coordinated count, including 11 in the West, 13 in Ontario, and 8 in the East. Across participating communities there were over 2,000 volunteers, 250 participating shelters and transitional facilities, and 350 community partners.
Who was included in the Coordinated Count?
For the 2016 PiT Count, homelessness was defined by where people were spending the night. The core populations included by all participating communities comprised people staying in unsheltered locations, in shelters and in transitional facilities. Communities could also opt to include people experiencing homelessness in health and corrections systems, and people experiencing “hidden” homelessness.
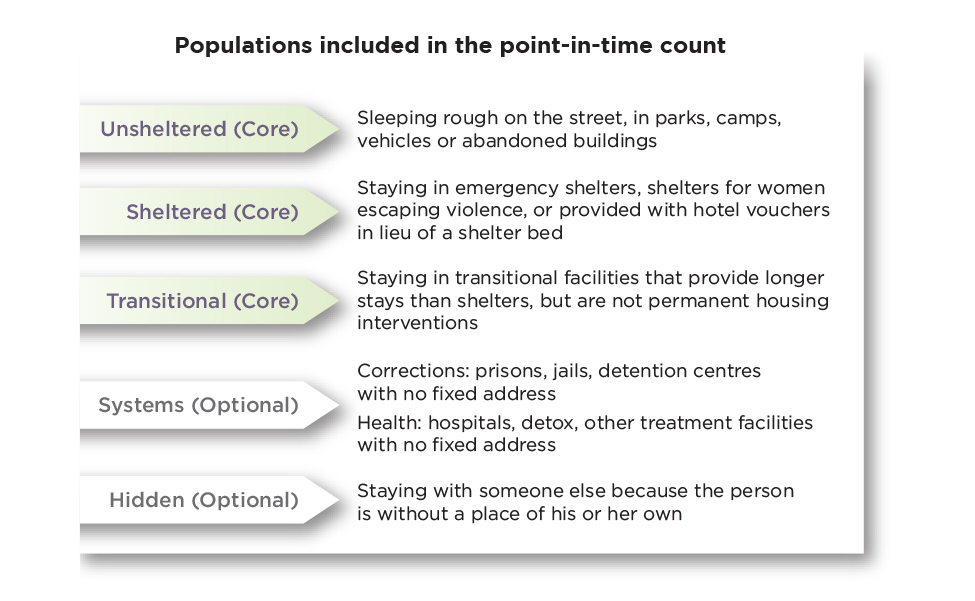
Text description of Figure 2: Populations included in the point-in-time count
| Population | Description |
|---|---|
| Unsheltered (Core population) | Sleeping rough on the street, in parks, camps, vehicles or abandoned buildings |
| Sheltered (Core population) | Staying in emergency shelters, shelters for women escaping violence, or provided with hotel vouchers in lieu of a shelter bed |
| Transitional (Core population) | Staying in transitional facilities that provide longer stays than shelters, but are not permanent housing interventions |
| Systems (Optional population) | Corrections: prisons, jails, detention centres with no fixed address Health: hospitals, detox, other treatment facilities with no fixed address |
| Hidden (Optional population) | Staying with someone else because the person is without a place of his or her own |
How many people were identified as experiencing homelessness during the PiT Count?
Across the 32 participating communities, a total of 5,954 people were identified as experiencing homelessness in the core populations (i.e. in emergency shelters, in transitional facilities and on the streets). Between communities, counts varied from 12 to 1,201 people. In total, 1,417 people (24%) were enumerated in unsheltered locations, 2,832 people (47%) were enumerated in shelters and 1,705 people (29%) were enumerated in transitional facilities.
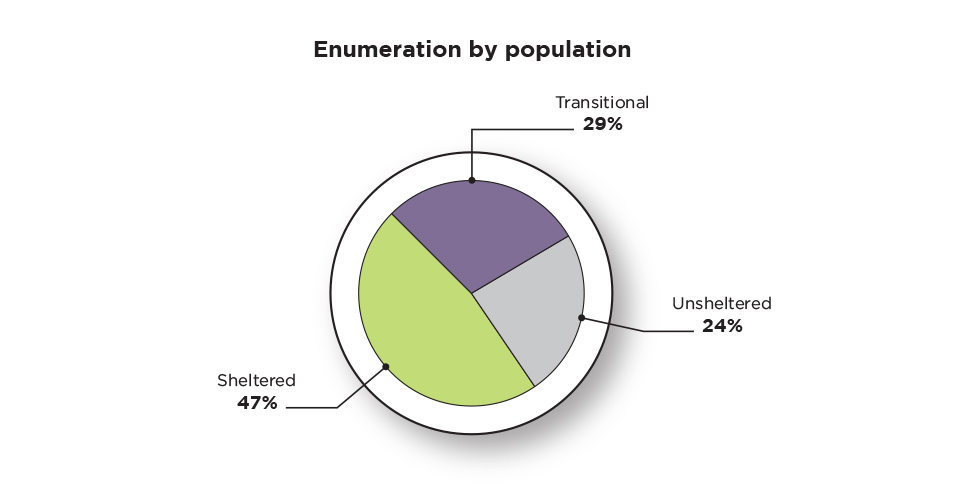
Text description of Figure 3: Enumeration by population
| Population | Percentage |
|---|---|
| Unsheltered | 24% |
| Sheltered | 47% |
| Transitional | 29% |
An additional 245 people were enumerated who were experiencing homelessness and did not know where they would spend the night. Many communities also included other populations in their count. In 17 communities, 478 people enumerated had no fixed address and were sleeping in health and corrections facilities.
How many people participated in the survey?
Across the 32 communities, 4,579 people who were experiencing homelessness were surveyed. This number includes 3,543 people in the core populations. It also includes 1,036 people who did not know where they were going to stay that night, people who were surveyed in health and correctional systems, and people who were experiencing hidden homelessness.
Hidden homelessness
Not everyone who is homeless is staying in a shelter or on the street. Many are living in precarious situations with friends or relatives on a temporary basis. Because they tend not to interact with the homelessness serving systems, this is referred to as “hidden” homelessness.
Because those experiencing hidden homelessness stay in homes, it is not possible for a PiT count to determine how many people are experiencing hidden homelessness during the count. A certain number may be encountered and surveyed on the night of the count, but this likely only represents a fraction of the total hidden homeless population. In communities that included hidden homelessness in their PiT count, it accounted for between 1.1% and 49.8% of the surveyed population, with higher numbers in communities that conducted a “magnet event” to reach out to people experiencing homelessness. In some cases, magnet events were as simple as a community meal. In others, they included a range of services, from haircuts and clothing banks to résumé workshops.
A PiT count can help to shed some light on who is experiencing hidden homelessness and what services are needed to help them.
The experience of homelessness
Chronic and episodic homelessness
The survey used for the 2016 PiT Count aimed to identify the number of people experiencing chronic or episodic homelessness. Respondents were asked to estimate how much time they were homeless over the course of the past year and how many different times they experienced homelessness. For the purposes of the count, chronic homelessness was defined as an experience of six or more months of homelessness, and episodic homelessness was defined as three or more distinct episodes adding up to less than six months. Temporary homelessness was defined as less than six months and fewer than three episodes of homelessness over the past year.
According to these definitions, 56.7% of respondents were experiencing chronic homelessness and 9.0% were experiencing episodic homelessness. The remaining respondents had either recently become homeless or had experienced one or two shorter episodes of homelessness. Chronic homelessness varied by community, ranging from 25.0% to 91.7%, with higher levels in western and northern communities compared to communities in Ontario and the East.
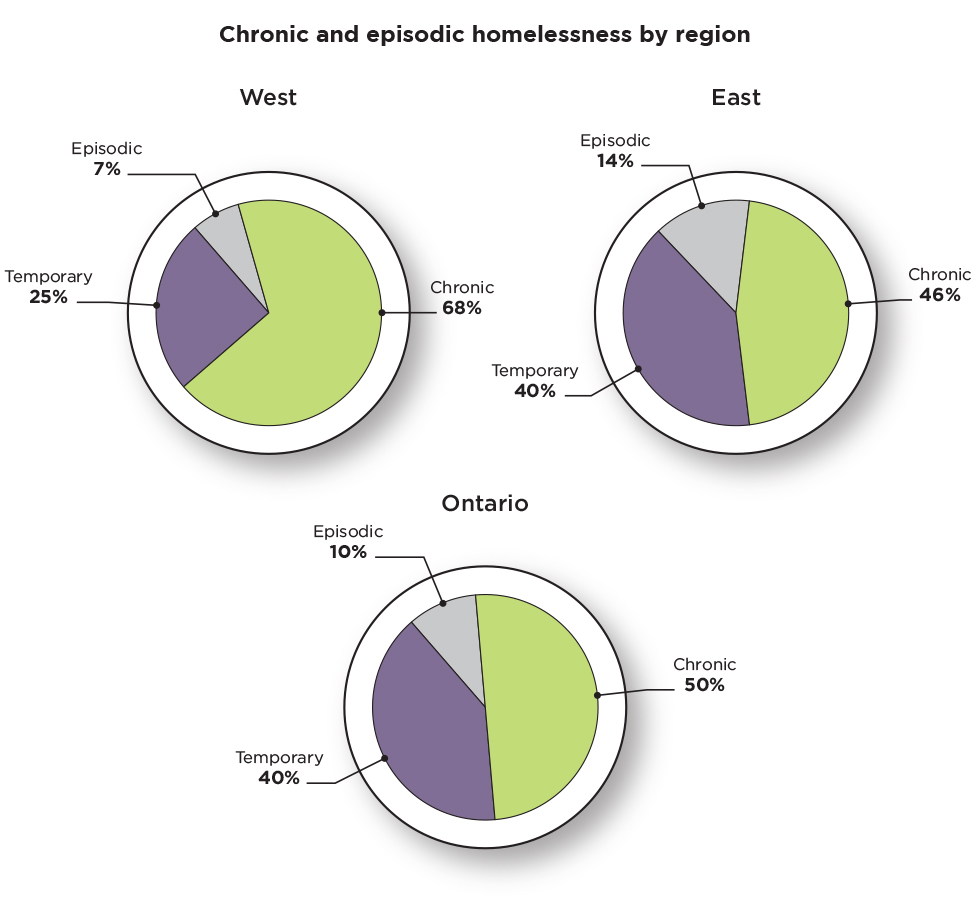
Text description of Figure 4: Chronic and episodic homelessness by region
| Homelessness | West | Ontario | East |
|---|---|---|---|
| Chronic | 68% | 50% | 46% |
| Episodic | 7% | 10% | 14% |
| Temporary | 25% | 40% | 40% |
People not using the shelter system
A PiT count can also indicate what proportion of the homeless population does not use the shelter system. More than one quarter of respondents indicated that they had not used a shelter in the past year. Many were either in unsheltered locations, in transitional housing, in health or corrections systems or were experiencing hidden homelessness on the night of the count.
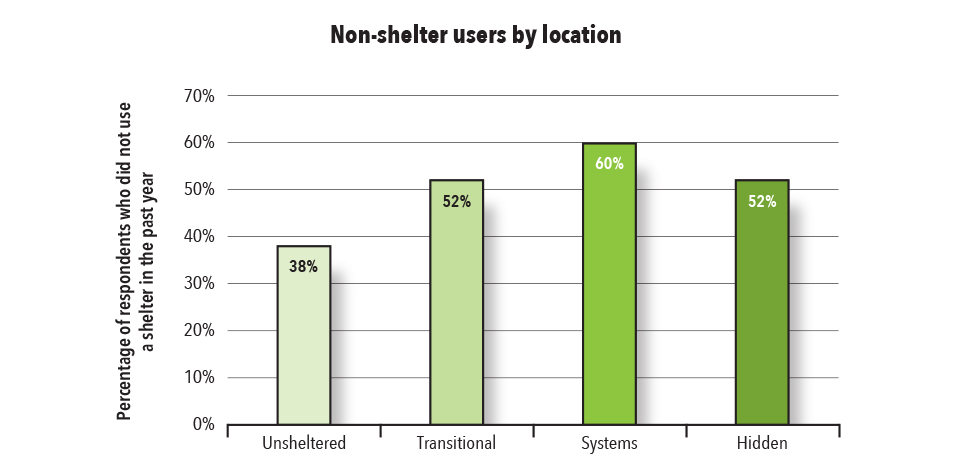
Text description of Figure 5: Non-shelter users by location
Percentage of respondents who did not use a shelter in the past year
| Population | Percentage |
|---|---|
| Unsheltered | 38% |
| Transitional | 52% |
| Systems | 60% |
| Hidden | 52% |
Respondents who had experienced longer periods of homelessness were more likely to have used a shelter. It is particularly important to know the number of people experiencing long periods of homelessness who are staying on the street or who are experiencing hidden homelessness. These individuals may or may not interact with homelessness support systems and they tend to be harder to reach. Among respondents who had been homeless for six or more months, 36% of those staying in unsheltered locations and 47% of those who were experiencing hidden homelessness had not used a shelter.

Text description of Figure 6: Non-shelter users by duration of homelessness for unsheltered and hidden populations
Percentage of respondents who did not use a shelter in the past year
| Population | Duration of homelessness over the past year | ||
|---|---|---|---|
| 0 to 2 months | 3 to 5 months | 6 or more months | |
| Hidden | 68% | 43% | 47% |
| Unsheltered | 46% | 35% | 36% |
New to community (within the past year)
Approximately 30% of survey respondents had arrived in the community within the past year. Those who had arrived recently tended to be younger and were less likely to be experiencing chronic homelessness. There were no differences between the groups in terms of gender, Aboriginal identity or veteran status.
Gender and age
In the 2016 PiT Count survey, respondents were asked what gender they identified with. More than 60% of the survey respondents were male, with women accounting for nearly 40%. Less than 1% of respondents provided another gender identityFootnote 1. Consistent with findings published in the Highlights of the National Shelter Study 2005–2014, most respondents were adults (aged 24-49), with fewer older adults (50-64) and unaccompanied youths (aged 14-24). Very few were seniors (aged 65+). Respondents also reported dependent children (aged 0-16) as well as older dependants (aged 17+).

Text description of Figure 7: PiT Count enumeration by age and gender
| Age in years | Male | Female |
|---|---|---|
| 0-4 | 147 | 130 |
| 5-9 | 118 | 137 |
| 10-14 | 70 | 122 |
| 15-19 | 202 | 114 |
| 20-24 | 274 | 106 |
| 25-29 | 293 | 102 |
| 30-34 | 363 | 94 |
| 35-39 | 326 | 90 |
| 40-44 | 290 | 84 |
| 45-49 | 88 | 74 |
| 50-54 | 70 | 80 |
| 55-59 | 68 | 76 |
| 60-64 | 81 | 99 |
| 65-70 | 117 | 127 |
| 70+ | 149 | 175 |
Males and females were equally represented among children and youths, but males were more prevalent among homeless adults, older adults and younger seniors, with the differences disappearing for individuals aged in their early 70s. This was largely due to a downward trend in female homelessness over adulthood. By contrast, male homelessness was steady until the 50s, where it began to show a sharp decline.
Males made up the majority of respondents in most survey locations, including unsheltered locations (73.7%) and emergency shelters (65.5%), whereas females represented more than half (53.4%) of respondents in transitional housing. This may be due in part to the availability of shelter vs. transitional housing units for men and women.
Age and reasons for housing loss
Respondents were asked what happened that led to their most recent housing loss. The five most commonly cited responses by each age group are listed in the table below.

Text description of Figure 8: Five most common reasons for housing loss by age group
| Rank | Youth (14-24) | Adult (25-49) | Older adult (50-64) | Senior (65 +) |
|---|---|---|---|---|
| 1 | Conflict with a parent or guardian (34%) | Addictions or substance use (24%) | Eviction: unable to pay rent (20%) | Eviction: unable to pay rent (24%) |
| 2 | Addictions or substance use (18%) | Eviction: unable to pay rent (16%) | Eviction: non-financial reasons (20%) | Illness or medical condition (15%) |
| 3 | Eviction: non-financial reasons (12%) | Eviction: non-financial reasons (14%) | Addictions or substance use (17%) | Eviction: non-financial reasons (14%) |
| 4 | Unsafe housing (12%) | Abuse by a partner or spouse (13%) | Job loss (16%) | Job loss (11%) |
| 5 | Eviction: unable to pay rent (11%) | Conflict with a partner or spouse (13%) | Unsafe housing (14%) | Addictions or substance use (10%) |
Some differences across age groups are noticeable:
- Addictions and substance use was cited across age groups, although it was less commonly indicated by seniors
- Financial factors become more prevalent with age, including an inability to pay rent and job loss. This may come from older adults that lose their employment and have difficulty finding a new job
- Eviction for non-financial reasons is prevalent across age groups
- Interpersonal factors were noted by youth and adults in the form of abuse, conflict or both
Populations
Youth homelessness
A sharp increase in homelessness was seen between the ages of 16 and 20 for both genders. Male and female youth were represented across survey locations, although men were somewhat more prevalent in shelters and health and corrections systems.
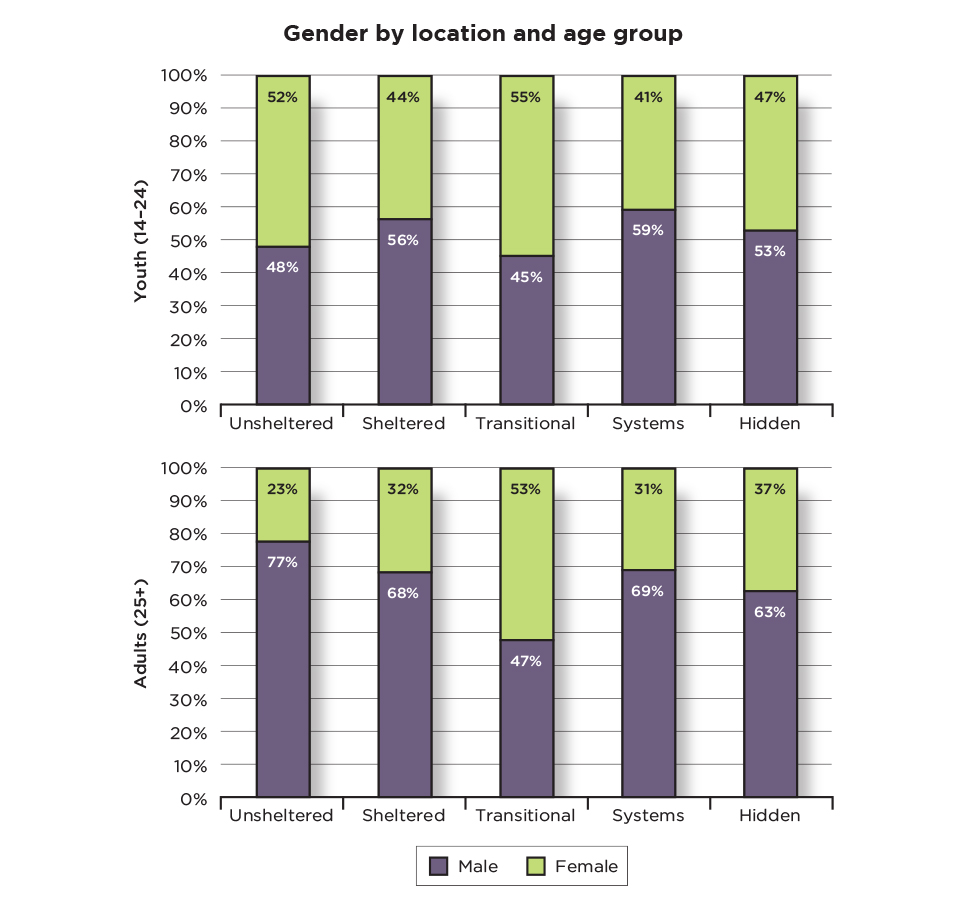
Text description of Figure 9: Gender by location and age group
| Youth (14-24) | Adults (25 or older) | |||
|---|---|---|---|---|
| Population | Male | Female | Male | Female |
| Unsheltered | 48% | 52% | 77% | 23% |
| Sheltered | 56% | 44% | 68% | 32% |
| Transitional | 45% | 55% | 47% | 53% |
| Systems | 59% | 41% | 69% | 31% |
| Hidden | 53% | 47% | 63% | 37% |
Among adults, women still made up half of those in transitional facilities but were the minority in most other survey locations. This is particularly evident in unsheltered locations, where the proportion of women falls from 52% among youth to 23% among adults.
Among youth, more than a third (34%) said that conflict with parents or guardians contributed to their most recent housing loss. Abuse by a parent or guardian was mentioned by 7% of survey respondents.
Family homelessness
In order to estimate the extent of family homelessness, respondents were asked whether they were staying with anyone else. In total, 14% of respondents indicated that they had one or more family members with them. Of these respondents, approximately 86% were single parents (mostly female), 6% were couples with dependants, and 9% were couples without dependants.
Couples tended to have more dependants, with an average of 2.2 dependants per couple compared to 1.9 for single parents. Dependants were mostly children under the age of 17 (91.5%), but included a number of dependent youths and adults as well (8.5%).
Compared to respondents without dependants, few families with dependants were unsheltered. The majority of these families were surveyed in shelters or transitional housing (81%).
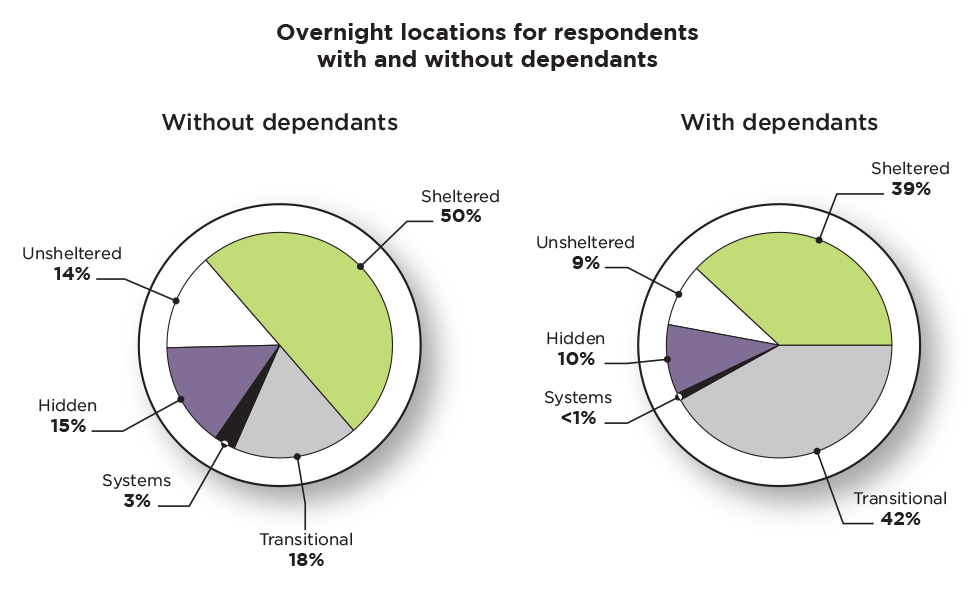
Text description of Figure 10: Overnight locations for respondents with and without dependants
| Population | Without dependants | With dependants |
|---|---|---|
| Unsheltered | 14% | 9% |
| Sheltered | 50% | 39% |
| Transitional | 18% | 42% |
| Systems | 3% | <1% |
| Hidden | 15% | 10% |
Indigenous identity and homelessness
Nearly two in five respondents identified as Aboriginal or Indigenous (37%). This proportion varied by community from 7% to 97%. By comparison, only 4% of people in the general Canadian population identify as Aboriginal. This means that people who identify as Aboriginal are nine times more likely to experience homelessness than those who do not.
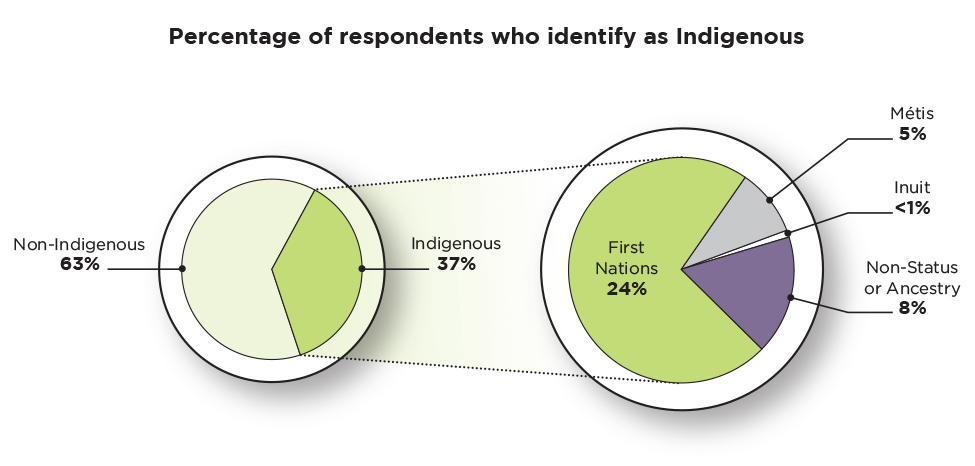
Text description of Figure 11: Percentage of respondents who identify as indigenous
| Population | Percentage |
|---|---|
| Non-indigenous | 63% |
| Total indigenous | 37% |
| First Nations | 24% |
| Métis | 5% |
| Inuit | Less than 1% |
| Non-status or ancestry | 8% |
Demographically, Indigenous respondents were younger and were more likely to be female than non-Indigenous respondents. Indigenous respondents were also less likely to be in shelters or transitional facilities, and more likely to report hidden homelessness, particularly among those who identified as First Nations.
Indigenous respondents were more likely to report longer durations of homelessness (six or more months) and more distinct episodes of homelessness (three or more) over the past year. This was particularly true of respondents who identified as First Nations and Inuit.

Text description of Figure 12: Duration and number of episodes of homelessness by indigenous identity
| Number of months | Number of episodes | |||||
|---|---|---|---|---|---|---|
| Population | Zero to two | Three to five | Six or more | One | Two | Three or more |
| Indigenous | 21% | 17% | 62% | 47% | 14% | 39% |
| Non-indigenous | 30% | 19% | 52% | 58% | 17% | 25% |
Military and RCMP Veterans
Nearly 5% of respondents indicated that they had served in the Canadian Armed Forces, while less than 1% indicated that they had served in the Royal Canadian Mounted Police (RCMP). By contrast, the proportion of veterans in the Canadian adult population is approximately 2.4%. This result suggests that veterans are approximately twice as likely to experience homelessness as non-veterans. The proportion of respondents that identified as a veteran varied by community and ranged from 0% to 13%.
Veterans were more likely to be male and older than non-veterans, more likely to use a shelter in the past 12 months, and more likely to report experiencing chronic homelessness across age categories.

Text description of Figure 13: Age by veteran status
| Age | Veterans | Non-veterans |
|---|---|---|
| Youth (14-24) | 4% | 19% |
| Adults (25-49) | 46% | 55% |
| Older Adults (50-64) | 41% | 23% |
| Seniors (65 and older) | 9% | 3% |
Male veterans were more likely than male non-veterans to be in unsheltered locations and in emergency shelters, and less likely to be in transitional facilities or be experiencing hidden homelessness. Few female veterans were identified. They were more likely than female non-veterans to be in shelters and less likely to be in transitional facilities.
Newcomers (recent immigrants and refugees)
Four percent of respondents indicated they were a refugee or immigrant who came to Canada within the past five years (2011–2016). This ranged from 0% to 16% among the participating communities. The proportion is similar to that of newcomers in the general population.
Newcomers were more than twice as likely as non-newcomers to be in transitional facilities (45% vs. 19%). No broad demographic differences were seen between groups, although newcomers were more likely to report being homeless with a dependant (40% vs. 13%).
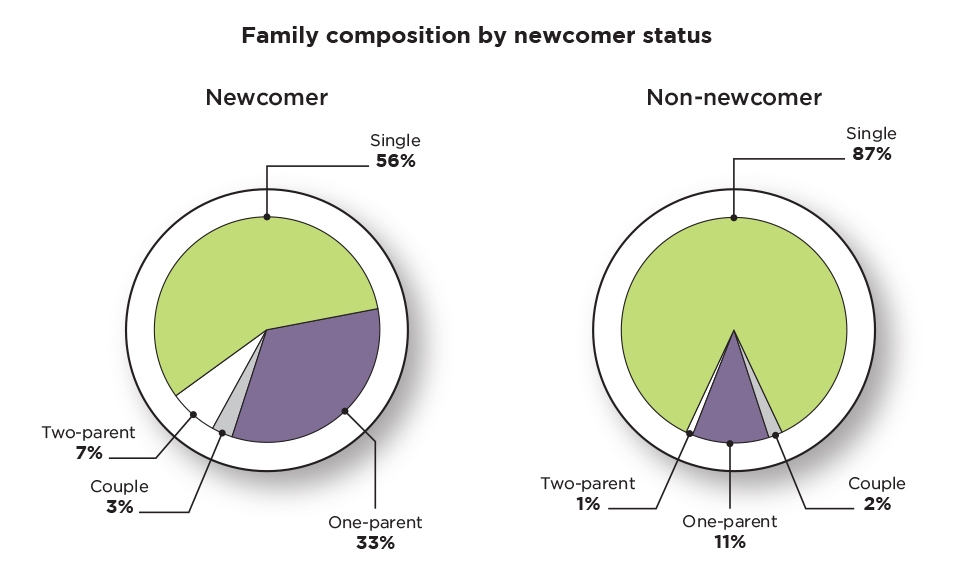
Text description of Figure 14: Family composition by newcomer status
| Age | Newcomer | Non-newcomer |
|---|---|---|
| Single | 56% | 87% |
| Couple | 3% | 2% |
| One-Parent Family | 33% | 11% |
| Two-Parent Family | 7% | 1% |
When asked about factors that contributed to their most recent housing loss, nearly one in three newcomers (31%) cited factors directly tied to their reason for migration (e.g., “war” or “forced to leave country”). Female newcomers were twice as likely as non-newcomer females to cite domestic abuse as a contributing factor (40% vs. 22%).
Conclusions
The findings from these community PiT counts build on what is known about homelessness in Canada. While data is available on shelter users in Canada, PiT counts can be used to engage those who do not access services for those experiencing homelessness, including shelters. It is notable that while half of those enumerated in this study were in a shelter, half of those who were experiencing hidden homelessness and a third of those in unsheltered locations indicated that they had not used a shelter in the past year.
Populations
Over half of respondents indicated they were homeless for six or more months in the past year. The Highlights of the National Shelter Study 2005–2014 showed that the majority of those who become homeless have only a brief experience of homelessness. Relatively few people experience homelessness across years. And yet, people experiencing chronic homelessness appear to make up the majority of those who are homeless on a given day.
In recent years, many communities have adopted a Housing First approach to support people experiencing chronic homelessness. Generally speaking, under this approach, individuals with high needs are moved as rapidly as possible from the street or shelters directly into permanent housing with supports that are tailored to their needs. As this approach is adopted by more Canadian communities, more people may be receiving the help they need to become stably housed.
The findings also point to populations that are in particular need of support. Indigenous people are over-represented in the homeless population across the country. The high incidence of chronic homelessness among this population suggests a need for a Housing First approach that is culturally sensitive, as was piloted in Winnipeg as part of the At Home/Chez Soi project. Similarly, the higher incidence of chronic homelessness among veterans and family homelessness among newcomers indicates a need for targeted supports.
Other findings in this report highlight a need for targeted supports or further investigation:
- Nearly one quarter of all women cited domestic abuse as a factor leading to their most recent housing loss. The number was higher for newcomer women. Domestic violence shelters play an important role in addressing the needs of this population
- Older adults and seniors were more likely to cite financial factors for their most recent housing loss, including an inability to pay rent and the loss of employment. Financial interventions may be effective at preventing housing loss by people in these age groups
- Eviction for non-financial reasons is common across age groups. Without further information, it is not clear what these reasons are
The next coordinated count: 2018
The findings of the 2016 Count provide a snapshot of homelessness in winter-spring 2016. The true value of PiT counts comes with the repetition of these counts over time. The next count will provide a point of comparison against this first count to identify changes in distinct populations. In particular, it may be possible to see changes in chronic and episodic homelessness in communities with a strong housing first approach.
With more communities likely to be participating in 2018, it will be possible to see a broader national picture of homelessness in Canada. Certain populations, such as newcomers, are likely to be more represented in certain communities. With data from these communities, it may be possible to better understand what leads to homelessness and what supports can be effective in reducing it.
Report a problem on this page
- Date modified:
