Everyone Counts 2018: Highlights - Report
On this page
Alternate formats
Request other formats online or call 1 800 O-Canada (1-800-622-6232). If you use a teletypewriter (TTY), call 1-800-926-9105. Large print, braille, audio cassette, audio CD, e-text diskette, e-text CD and DAISY are available on demand.
Between March 1 and April 30, 2018, 61 communities participated in Everyone Counts, the second nationally coordinated Point-in-Time (PiT) count of homelessness in Canadian Communities. The first count took place in 2016 with 32 participating communities. Everyone Counts 2020 will be the third nationally-coordinated PiT count and is planned for March and April 2020.
The findings highlighted in this report are the result of the enumeration and surveys conducted in the 61 communities in 2018. The results represent a picture of homelessness from a range of communities across Canada, including data from communities in every province and territory, covering major urban centres, suburban communities of various sizes, and more rural and remote communities.
Further results from Everyone Counts 2018 will follow in future reporting, including reasons people cite for their housing loss, sources of income, and deeper analyses on specific populations. If you have questions about this report, contact the Reaching Home research team: hpsr@hrsdc-rhdcc.gc.ca.
Benefits of the count
Point-in-Time counts provide a unique community-wide view of homelessness that reaches beyond those who are accessing other homelessness services. The survey provides data that can point to services, policies, or programs that can help to prevent and reduce homelessness. This is information that is not captured through administrative data systems.
The counts are particularly helpful to account for people who do not access shelters. Some populations, including Indigenous Peoples, youth and women, are less likely to access shelters and will therefore be underrepresented in administrative data. The PiT Counts offer a means to address this.
Acknowledgements
This report was prepared by Dr. Patrick Hunter, Senior Policy Analyst, Employment and Social Development Canada, and reflects the work by the PiT Count Implementation team at Employment and Social Development Canada, the National PiT Count Working Group and all of the 61 communities that participated in Everyone Counts. Each count was led by a local team, relying on dedicated people working with homelessness serving organizations, municipal staff, emergency services and volunteers who took the time to have conversations with people experiencing homelessness to listen to their stories and understand their needs.
Participating designated communities
- Barrie (Simcoe)
- Bathurst
- Belleville
- Brandon
- Brantford
- Calgary
- Charlottetown
- Drummondville
- Dufferin
- Durham (Oshawa)
- Edmonton
- Fredericton
- Gatineau / Outaouais
- Grande Prairie
- Guelph
- Halifax
- Halton Region
- Hamilton
- Iqaluit
- Kamloops
- Kelowna
- Kingston
- Lethbridge
- London
- Medicine Hat
- Metro Vancouver (Conducted in 2017)
- Moncton
- Montréal
- Nanaimo
- Nelson
- Nipissing / North Bay
- Ottawa
- Peel Region
- Peterborough
- Prince Albert
- Prince George
- Québec
- Red Deer
- Regina
- Saguenay/Lac St-Jean
- Saint John
- Saskatoon
- Sault Ste Marie
- Sherbrooke
- St. Catharines / Niagara / Thorold
- St. John's
- Sudbury
- Summerside
- Sydney / Cape Breton
- Thompson
- Thunder Bay
- Toronto
- Trois-Rivières
- Victoria (Capital Regional District)
- Waterloo Region
- Whitehorse
- Windsor
- Winnipeg
- Wood Buffalo
- Yellowknife
- York
1. Methodology
PiT Counts provide a one-day snapshot of homelessness in a community, including people experiencing homelessness in shelters, unsheltered locations, and transitional housing. They can also include people experiencing homelessness who are in health or correctional facilities or who are staying with others because they have no access to a permanent residence.
PiT Counts result in an enumeration of homelessness in core locations such as unsheltered locations, shelters and transitional housing. They also include a survey of people experiencing homelessness across the community.
The methodology for Everyone Counts was developed in conjunction with a National PiT Count Working Group, and it includes core methodological standards followed by the 61 communities, including a common set of screening and survey questions. Communities could build on this core methodology to address local information needs. More information on the methodology can be found in the Guide to Point-in-Time Counts in Canada.
Enumeration and survey
PiT counts result in an enumeration and survey findings. The enumeration is calculated by a combination of administrative data on occupancy of shelter providers and transitional housing and people who reported or were observed sleeping on the street on a single night. The survey is also done with people experiencing homelessness who are spending the night in shelter, transitional housing, staying with others, in health and corrections institutions, and other places. The results are analyzed to better understand their experience of homelessness.
2. Enumeration
On a given night 25,216 people across 61 communities were experiencing absolute homelessness in shelters or unsheltered locations. An additional 6,789 people were in a transitional program. Note, however, that there was some variation across communities as to what constituted a transitional program.
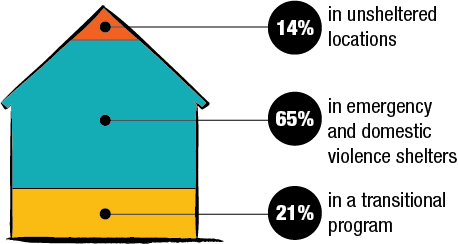
Text description of figure 1
| Locations | Percentage |
|---|---|
| Unsheltered locations | 14% |
| Emergency shelters and domestic violence shelters | 65% |
| Transitional programs | 21% |
Over the communities that also conducted a count in 2016, there was a 14% increase in the enumeration. In part, this may be due to improvements in the methodology. The first time a community conducts a count there are many lessons learned related to where to look for people experiencing homelessness, how many volunteers are needed, and how to engage people experiencing homelessness. This can result in a more effective PiT Count that reaches, and enumerates, more people.
3. Survey results
Across the 61 communities, 19,536Footnote 1 people were surveyed experiencing homelessness in unsheltered locations, shelters, transitional housing, staying with others, hotels or motels, health or corrections systems, and in unknown locations. The results of each analysis includes all of those who provided a response to each question. The survey questions can be found in the Guide to Point-in-Time Counts in Canada.
3.1 Chronic and episodic homelessness
Survey respondents were asked how long and how many different times they experienced homelessness over the past year. Six or more months of homelessness was considered chronic homelessness, 3 or more episodes lasting less than six months of homelessness was considered episodic homelessness.
People experiencing chronic homelessness accounted for 60% of all respondents whereas episodic homelessness accounted for 8% of all respondents. The proportion identified as chronic was typically higher in communities in the West and North (Manitoba, Saskatchewan, Alberta, British Columbia, and the territories) and lower in the East (New Brunswick, Nova Scotia, Prince Edward Island, and Newfoundland).
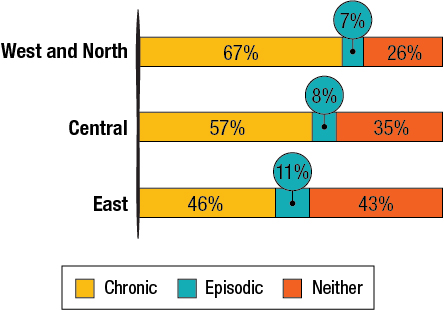
Text description of figure 2
| West and North | Central | East | |
|---|---|---|---|
| Chronic | 67% | 57% | 46% |
| Episodic | 7% | 8% | 11% |
| Neither | 26% | 35% | 43% |
3.2 Age, gender identity and sexual identity
The majority (62%) of survey respondents identified as male, 36% identified as female and 2% identified as trans male, trans female, transgender, non-binary, androgynous, gender fluid, two-spirit, genderqueer or gender non-conforming, or provided another response not listed on the surveyFootnote 2.
Dependent children and unaccompanied youth each comprised 13% of those identified. Adults were the largest group, accounting for nearly half (49%) of those identified. Over 1 in 5 (22%) were older adults and 3% were seniors.
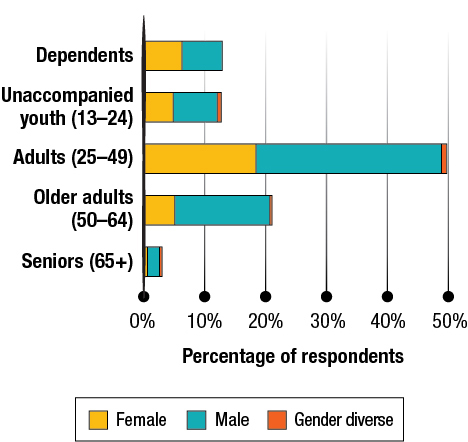
Text description of figure 3
| Dependents | Unaccompanied youth (13 to 24) | Adults (25 to 49) | Older adults (50 to 64) | Seniors (65 and older) | |
|---|---|---|---|---|---|
| Female | 6.5% | 5.2% | 18.6% | 5.3% | 0.8% |
| Male | 6.7% | 7.1% | 30.4% | 15.6% | 2.1% |
| Gender diverse | 0.0% | 0.6% | 1.0% | 0.3% | 0.0% |
Males and females were equally represented among dependents, but increasingly diverged with age, with males accounting for 56% of youth, 61% of adults, and over 70% of older adults and seniors. Gender diverse responses were most common among youth, accounting for 4% of youth responses.
Respondents were asked about their overnight location on the PiT Count night. Those who identified as male represented the majority in most overnight locations with the exception of hotels and motels. This is likely because many communities provide hotel or motel rooms as a response to family homelessness when other facilities are not available, and most families are female-led.
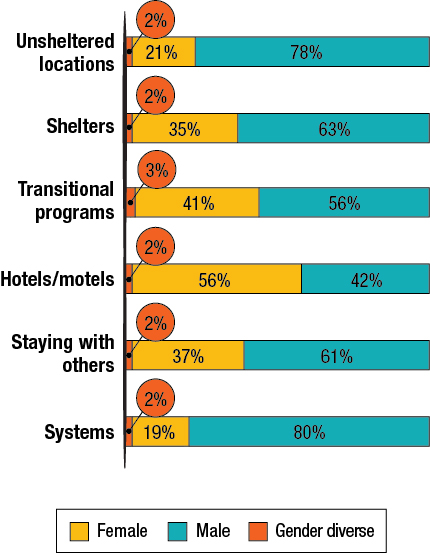
Text description of figure 4
| Unsheltered locations | Shelters | Transitional programs | Hotels / Motels | Staying with others | Systems | |
|---|---|---|---|---|---|---|
| Gender diverse | 1.5% | 2.1% | 2.8% | 1.9% | 2.2% | 2.0% |
| Female | 21.0% | 35.1% | 41.2% | 55.9% | 36.8% | 18.5% |
| Male | 77.5% | 62.8% | 55.9% | 42.2% | 61.0% | 79.6% |
When respondents were asked about their sexual identity, or orientation, over 20% of youth identified as bisexual, gay, lesbian, asexual, pansexual, two-spirit, queer, questioning, or provided another response not listed on the survey. When considered together with gender diverse responses, 21% of youth identified as LGBTQ2.
LGBTQ2 responses were less frequent with age, accounting for 11% of responses from adults, 6% of responses from older adults, and 5% of responses from seniors.
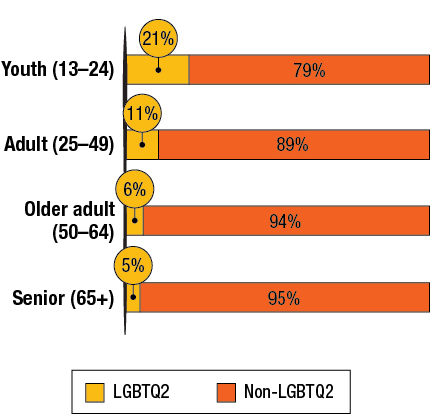
Text description of figure 5
| Youth (13 to 24) | Adults (25 to 49) | Older adults (50 to 64) | Seniors (65 or older) | |
|---|---|---|---|---|
| LGBTQ2 | 21% | 11% | 6% | 5% |
| Non-LGBTQ2 | 79% | 89% | 94% | 95% |
3.3 Experience of homelessness
One quarter of respondents (25%) had not used a shelter in the past year. Shelter use was less common among people staying with others (53%), but also among those who were in unsheltered locations (41%), transitional housing (47%) and health and corrections systems (41%).
Respondents were asked about the age at which they first experienced homelessness. Approximately 30% of responses were as a child or teen (under 18). A further 20% were youth. First experiences of homelessness under the age 25 were reported by 49% of adults, 26% of older adults, and 17% of seniors.
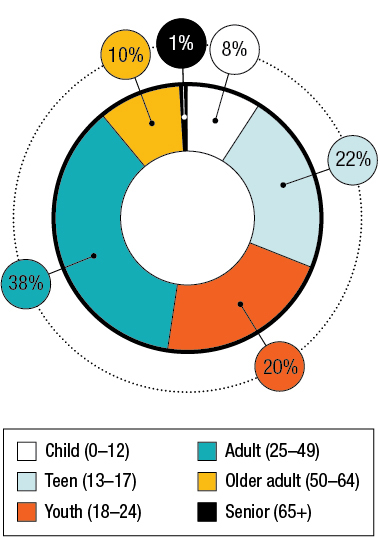
Text description of figure 6
| Child (0 to 12) | 8% |
|---|---|
| Teen (13 to 17) | 22% |
| Youth (18 to 24) | 20% |
| Adult (25 to 49) | 38% |
| Older Adult (50 to 64) | 10% |
| Senior (65 and older) | 1% |
Respondents were asked when they came to the community and where they were previously. Most respondents (59%) have either always been in the community or came more than 5 years ago. Nearly one quarter (24%) came within the past year.
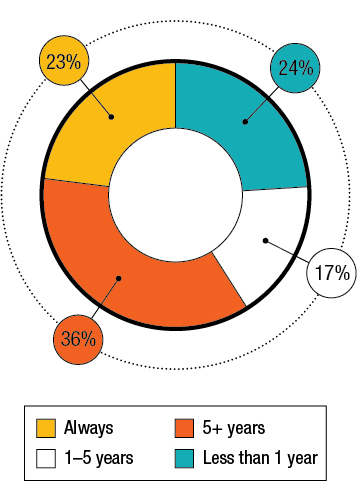
Text description of figure 7
| Less than 1 year | 24% |
|---|---|
| 1 to 5 years | 17% |
| More than 5 years | 37% |
| Always | 23% |
Of those who did report coming to the community, most came from elsewhere within the same province (63%) and over one quarter came from elsewhere in Canada (27%). Fewer came internationally (11%).
3.4 Indigenous identity
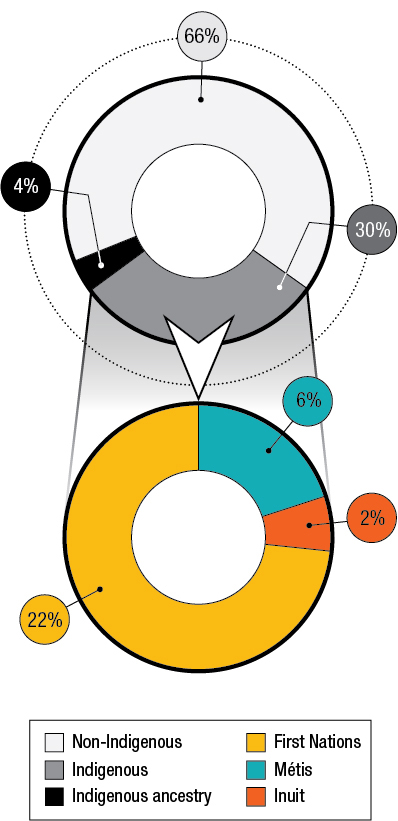
Nearly one third (30%) of respondents identified as Indigenous, with the majority identifying as First Nations. In contrast, approximately 5% of the Canadian population identifies as Indigenous in the 2016 census, suggesting an overrepresentation of Indigenous Peoples experiencing homelessness.
This percentage was higher among those who were staying in unsheltered locations (37%) and among those who were staying with others (43%). This suggests that shelter-specific statistics are likely to underestimate the extent of Indigenous homelessness.
Text description of figure 8
| Female | Male | Gender diverse | |
|---|---|---|---|
| Indigenous | 38.5% | 58.6% | 2.9% |
| Non-Indigenous | 32.1% | 66.2% | 1.7% |
Respondents who identified as Indigenous were slightly more likely to identify as female or as a gender diverse. Those who identified as Indigenous accounted for 38% of respondents who also identified as gender diverse. This is in part due to the number of respondents who identified as two-spirit.
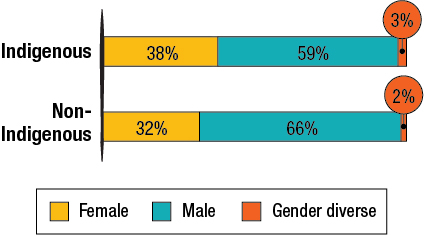
Text description of figure 9
| Non-Indigenous | 66.2% |
|---|---|
| Indigenous Ancestry | 4.3% |
| First Nations | 21.6% |
| Métis | 6.3% |
| Inuit | 1.7% |
3.5 Newcomers to Canada
14% of respondents indicated that they came to Canada as an immigrant, refugee or refugee claimant. These included 8% who indicated that they came as an immigrant, 3% as a refugee and 4% as a refugee claimant. The majority (56%) have been in Canada for 5 or more years, however a significant minority (26%) came within 6 months prior to the count.
In contrast, over 20% of the population in the 2016 census reported that they were, or have been, a permanent resident in CanadaFootnote 3. Although this figure does not include current refugees or refugee claimants, it suggests that newcomers to Canada experience lower rates of homelessness than the general population.
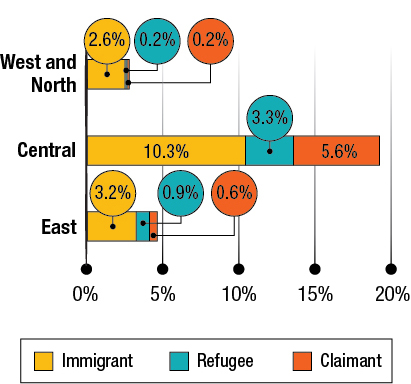
Text description of Figure 10
| West and North | Central | East | |
|---|---|---|---|
| Claimant | 0.2% | 5.6% | 0.6% |
| Refugee | 0.2% | 3.3% | 0.9% |
| Immigrant | 2.6% | 10.3% | 3.2% |
3.6 Veterans
Respondents who identified as veterans of the Canadian Armed Forces accounted for 4.4% of all respondents, and 0.3% identified as veterans of the Royal Canadian Mounted Police. Veterans tended to be older (median age = 48) than non-veterans (median age = 39) and less likely to be female.
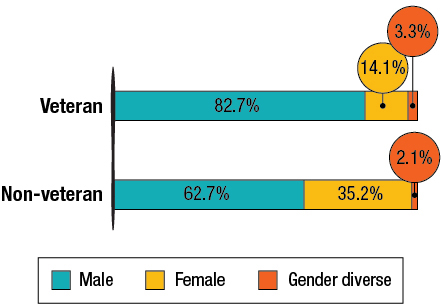
Text description of Figure 11
| Non-Veteran | Veteran | |
|---|---|---|
| Male | 62.7% | 82.7% |
| Female | 35.2% | 14.1% |
| Gender diverse | 2.1% | 3.3% |
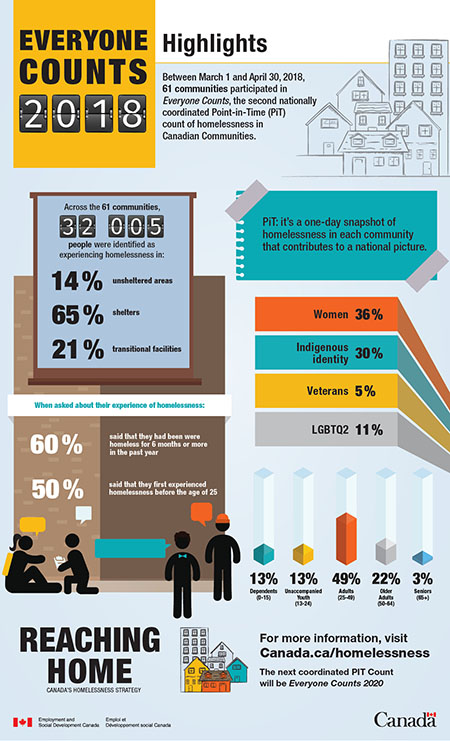
Text description
Between March 1 and April 30, 2018, 61 communities participated in Everyone Counts, the second nationally coordinated Point-in-Time (PiT) count of homelessness in Canadian Communities.
Across the 61 communities on the night of the count, 32,005 people were identified as experiencing homelessness in:
- Unsheltered areas: 14%
- Shelters: 65%
- Transitional facilities: 21%
When asked about their experience of homelessness:
- 60% said that they had been homeless for 6 months or more in the past year
- 50% said that they first experienced homelessness before the age of 25
PiT: it’s a one-day snapshot of homelessness in each community that contributes to a national picture.
- Women 36%
- indigenous identity 30%
- lgbtq2 11%
- veterans 5%
- Dependents: 13%
- Unaccompanied Youth (13 to 24): 13%
- Adults (25 to 49): 49%
- Older Adults (50 to 64): 22%
- Seniors (65+): 3%
The next coordinated PIT Count will be Everyone Counts 2020
Report a problem on this page
- Date modified:
