
Homelessness Data Snapshot: Homelessness and immigration in Canada from 2020 - 2023
-
Copyright
Aussi disponible en français sous le titre : Instantané de données sur l'itinérance : l'itinérance et l'immigration au Canada de 2020 à 2023
Information contained in this publication or product may be reproduced, in part or in whole, and by any means, for personal or public non-commercial purposes without charge or further permission, unless otherwise specified. Commercial reproduction and distribution are prohibited except with written permission from Housing, Infrastructure and Communities Canada.
For more information, contact:
Housing, Infrastructure and Communities Canada
180 Kent Street, Suite 1100
Ottawa, Ontario K1P 0B6
info@infc.gc.ca© His Majesty the King in Right of Canada, as represented by the Minister of Housing, Infrastructure and Communities, 2025.
Cat. No. T94-60/6-2025E-PDF
ISBN 978-0-660-76406-1
On this page
- Introduction
- Analysis of shelter use by status in Canada
- Demographics emergency shelter users by status in Canada
- Distribution of emergency shelter users by shelter type and status in Canada
- Length of stay by status in Canada and family status
- Distribution of non-citizens in emergency shelters by population size and region
- Rates of shelter use by status in Canada
- Point-in-Time surveys: Analysis of homelessness among those who arrived as newcomers to Canada
- First experience of homelessness and years in Canada
- Key Findings
- Appendix A: Glossary of Terms
Introduction
This report updates information found in the Homelessness data snapshot: Homelessness experienced by Newcomers to Canada, which covered the period from 2017 to 2019. This analysis outlines trends in emergency shelter use by immigrants, resettled refugees, asylum seekers, and temporary visa holders in Canada experiencing homelessness between 2020 and 2023. The study also investigates the differences between the above groups and Canadian citizens regarding experiences of homelessness by observing national patterns of sheltered and unsheltered homelessness and demographic information.
Background
In 2023, the vast majority (97.6%) of Canada's population growth came from international migration (both permanent and temporary immigration).Footnote 1
In 2023, Canada admitted 471,817 permanent residents (a 38.3% increase over 2019).Footnote 2 An estimated 820,766 non-permanent residents were added to Canada's population in 2023. In 2022, Canada saw a net increase of 437,612 immigrants and 551,544 non-permanent residents.Footnote 3 These represent the highest levels on record, reflecting higher immigration targets and faster processing of immigration applications. In both 2022 and 2023, temporary immigration drove population growth. The majority of these non-permanent residents were those with work and study permits.Footnote 4
In 2023, refugee claims received from 143,360 asylum seekers were processed by Immigration, Refugees, and Citizenship Canada (IRCC) and the Canadian Border Services Agency (CBSA) (a 124% increase over 2019).Footnote 5 In 2022, refugee claims received from 91,640 asylum seekers were processed by IRCC and the CBSA.Footnote 6
Refer to Appendix A for a Glossary of Terms.
Non-citizens accounted for approximately 9% of the Canadian population in 2021.Footnote 7 This study breaks down shelter users into the following categories (1) Canadian citizen, (2) Immigrant/Permanent resident, (3) Resettled refugee, (4) Asylum seeker, and (5) Temporary visa holder.Footnote 8
Data
This report contains data from the following two sources:
- Administrative data from emergency shelters using the Homeless Individuals and Families Information System (HIFIS), and similar systems, from 2017 to 2023: The dataset includes approximately 200-250 emergency shelters per year, which accounts for about half of all emergency shelters over the study period and approximately 70% of the country's total emergency shelter beds. It contains information about shelter users, including demographic information and their immigration status. The study methodology takes into account people who use more than one shelter. Domestic violence shelters, immigrant- and refugee-specific shelters, temporary shelters, and transitional housing are not included in this section of the analysis due to a lack of data coverage. A summary of shelter use trends up to 2023 can be found in the National Shelter Study 2023 Update.
- Point-in-Time (PiT) Counts coordinated by the Homelessness Policy Directorate in 2020 to 2022: This dataset contains key information on the size of the homeless population in participating communities as well as survey data providing information about demographic characteristics and experience of homelessness. The survey includes a question on the respondent's citizenship status at the time of their arrival to Canada. A summary of findings from the 2020-22 counts are summarized in Everyone Counts 2020-2022 – Results from the Third Nationally Coordinated Point-in-Time Counts of Homelessness in Canada.
Analysis of shelter use by status in Canada
Non-citizens constituted an estimated 8.9% of the emergency shelter user population in 2023, meaning that they are proportionally represented. Notably, asylum seekers are overrepresented, constituting 0.8% of the Canadian population in 2023, versus 2.6% of the shelter-using population in the same year. Footnote 9
Shelter use among non-citizens is likely disproportionately underestimated, due to a number of factors:
- Access Without Fear policies in sanctuary cities result in undeclared or missing citizenship data for a number of large shelters in urban areas, in order to protect the personal information of non-citizens. This allows individuals to access services without fear of being deported, or detained. Toronto, Hamilton, London, and Montréal are designated as sanctuary cities in Canada.Footnote 10 Vancouver, Ajax, and Edmonton have also implemented local sanctuary policies.Footnote 11
- Immigrant- and refugee-specific service providers are excluded from the national shelter analysis, as these services are not included in the data system for the homeless-serving sector, resulting in a lack of information regarding the overall landscape of refugee and asylum-specific shelters.
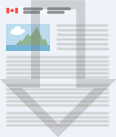
Figure 1: Status in Canada among emergency shelter users, from 2017 to 2023
Note: Canadian citizens not included in graph
-
Figure 1 - Text version
Figure 1: Status in Canada among emergency shelter users, from 2017 to 2023 Status in Canada 2017 2018 2019 2020 2021 2022 2023 Immigrant
4,593
4,077
4,457
2,472
2,386
2,954
3,586
Resettled Refugee
999
1,152
1,177
450
430
840
3,001
Asylum Seeker
2,962
3,973
3,726
846
320
1,142
3,072
Temporary Visa Holder
467
521
717
287
213
460
915
Proportion of shelter users that are non-citizens
7.0%
7.9%
8.5%
4.6%
3.6%
5.1%
8.9%
In 2020 and 2021, there was a drop in the number of non-citizens accessing the shelter system compared to previous years. The decline in non-citizens in 2020 was likely partially due to measures that were put in place to control the pandemic, including a drop in irregular border crossings during the height of the COVID-19 pandemic, resulting in a reduction in the inflow of asylum seekers. Access to pandemic supports may also have contributed to the reduction in resettled refugees, asylum seekers and permanent residents accessing shelter services throughout 2020 and 2021. As border measures and eviction moratoria were phased out from 2021 to 2023, there was a gradual recovery in the proportion and number of non-citizens in the shelter system. While this is true of all groups, the largest increase was seen among resettled refugees and asylum seekers over this period.
The data in 2023 is similar to pre-pandemic trends in shelter use among non-citizens as reported previously. In 2019, the proportion of non-citizens among the shelter-using population was 8.5% and in 2023 it was 8.9%. Despite rapid increases in asylum seekers between 2020 (846) and 2023 (3,072), the number did not reach pre-pandemic levels (which peaked in 2018 at 3,973). However, the number of resettled refugees in the shelter system in 2023 (3,001) surpassed pre-pandemic levels (which had previously peaked in 2019 at 1,177). The number of visa holders in the shelter system was also higher in 2023 (915) than the previous peak measured in 2019 (717).
Demographics emergency shelter users by status in Canada
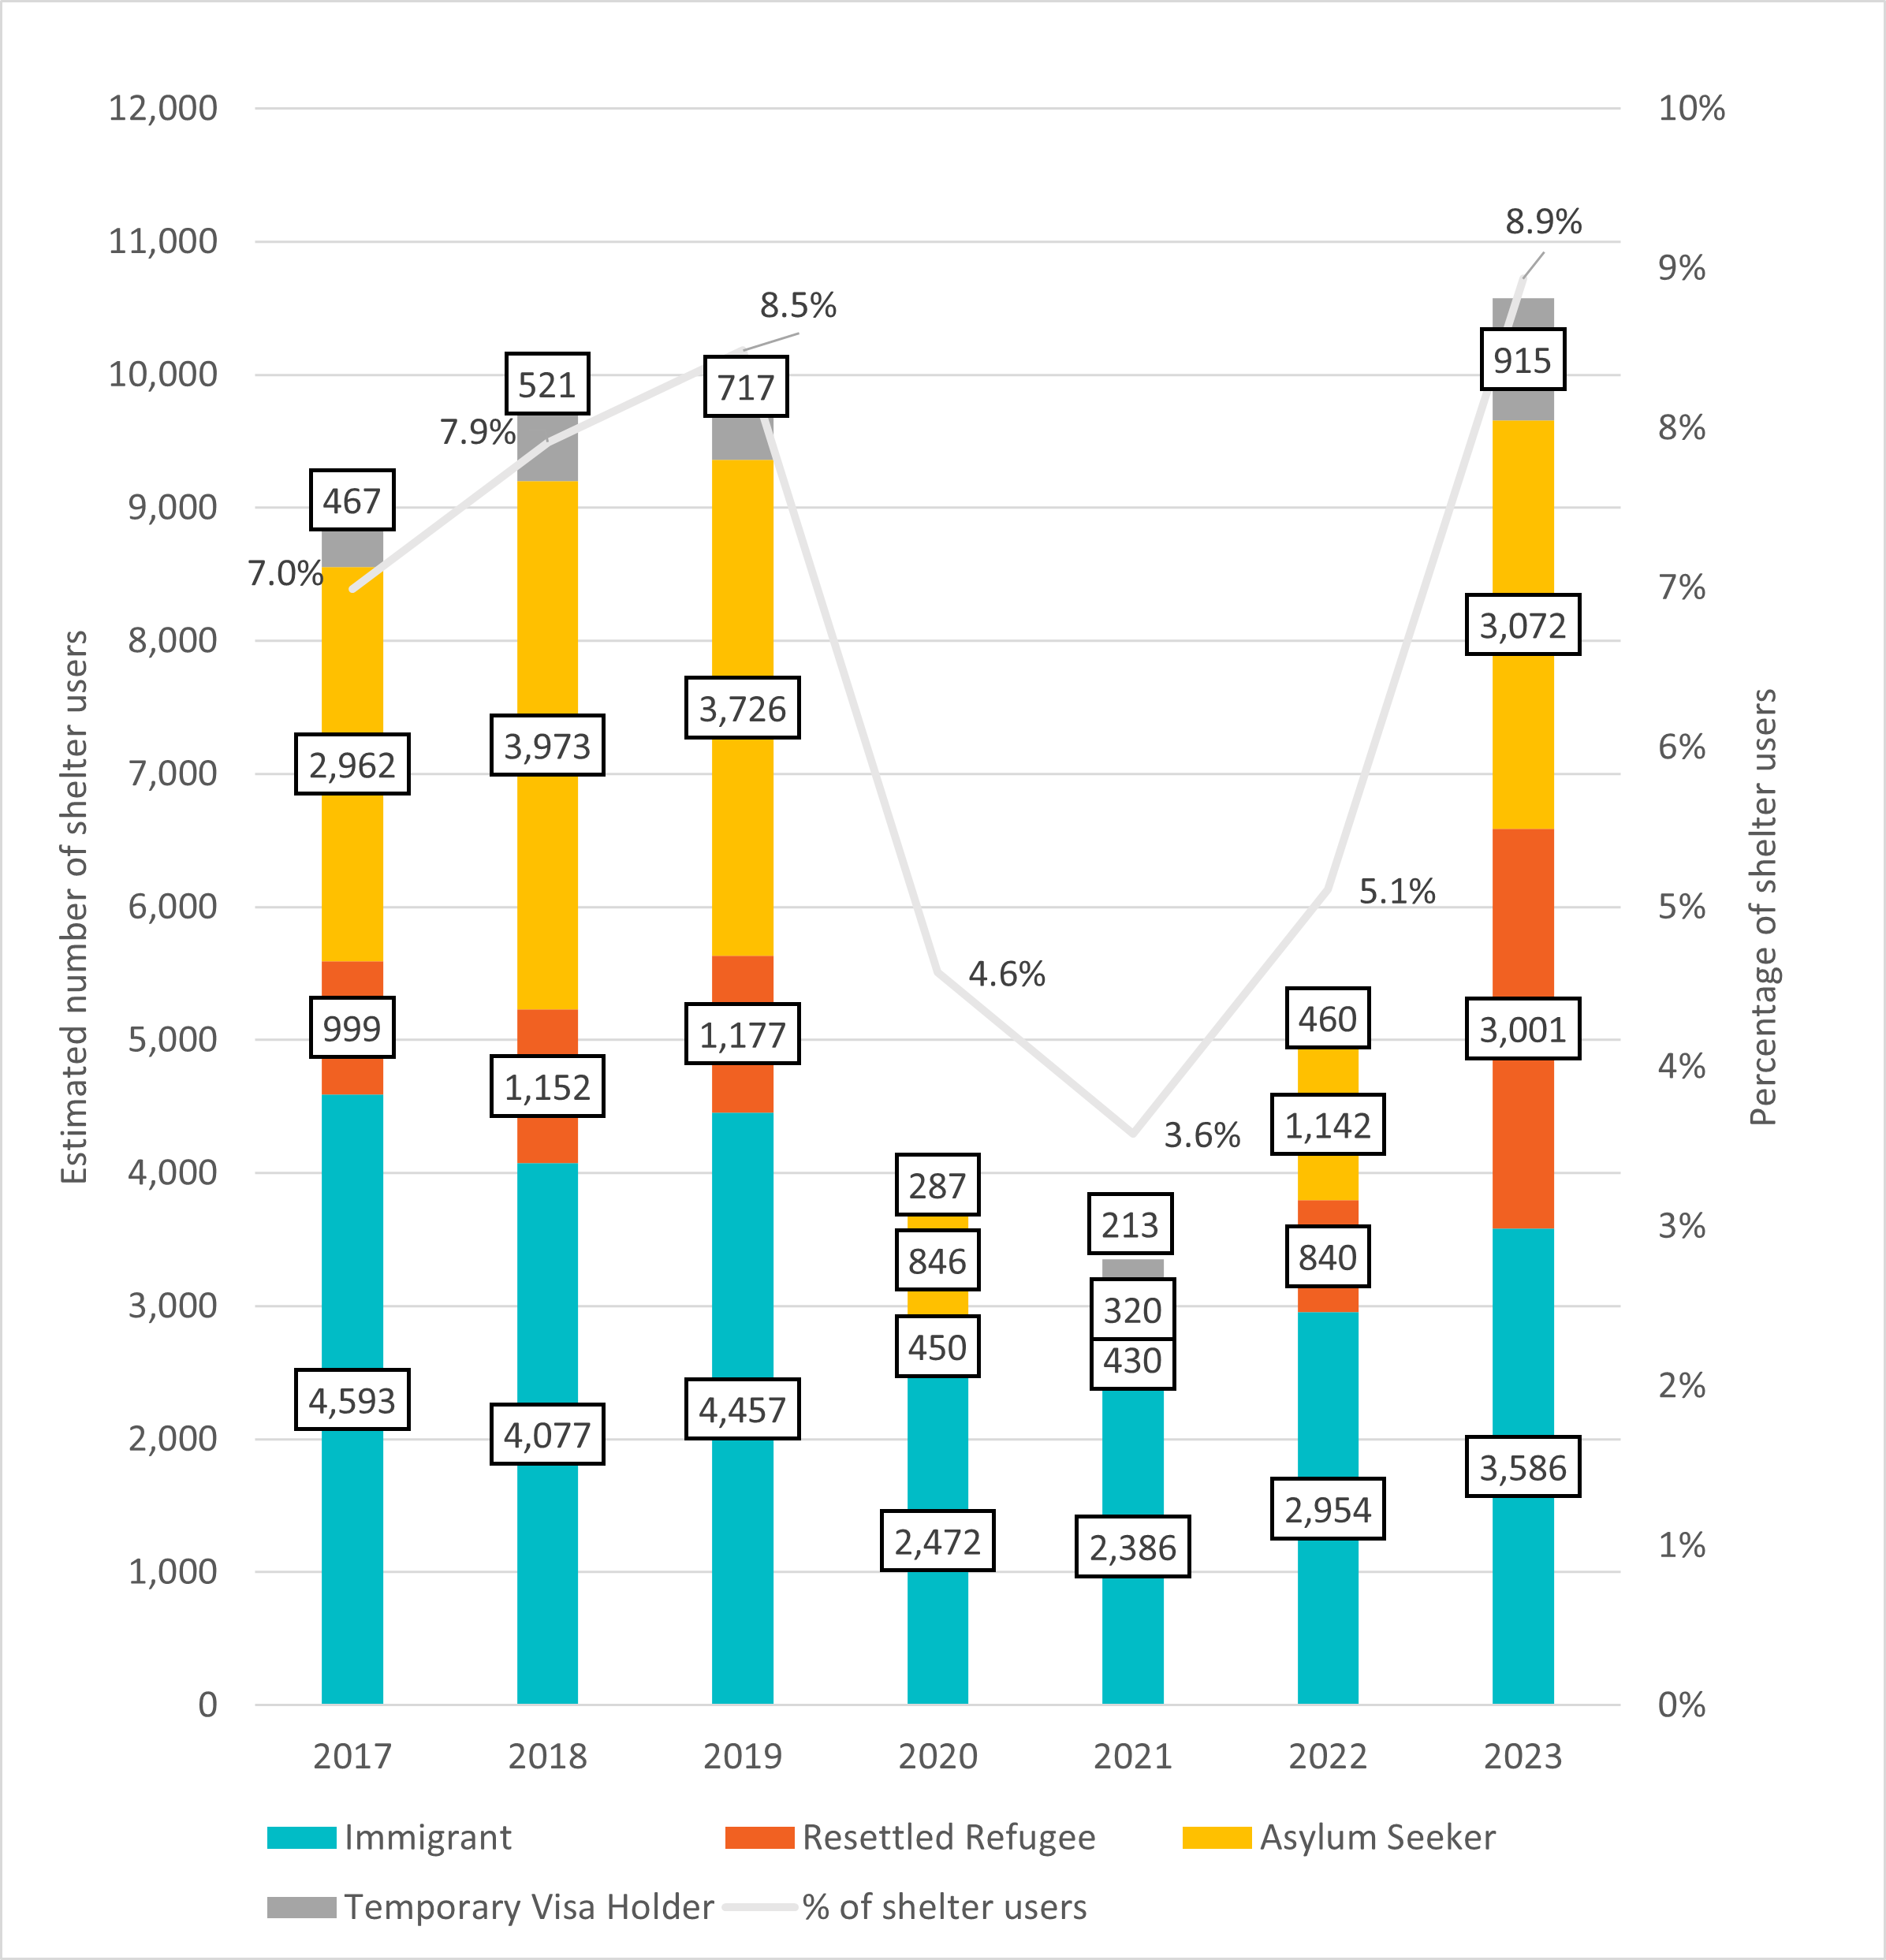
Non-citizen shelter users tend to differ from Canadian Citizens in terms of age profile (Figure 2). Between 2020 and 2023, there was a significantly higher proportion of children among immigrants, resettled refugees and asylum seekers compared to Canadian citizens. There was also a significantly higher proportion of youth among immigrants, resettled refugees and asylum seekers, and visa holders compared to Canadian citizens, with youth being most overrepresented among visa holders.
Conversely, there was a significantly lower proportion of adults aged 25-49 among immigrants and visa holders compared to Canadian citizens between 2020 and 2023. No statistical difference was detected between the other groups. There was also a significantly higher proportion of adults aged 50 to 64 and 65+ among Canadian Citizens compared to all other groups.
Figure 2: Age group of emergency shelter users by status in Canada, 2020 to 2023 (aggregate)
-
Figure 2 - Text version
Figure 2: Age group of emergency shelter users by status in Canada, 2020 to 2023 (aggregate) Status in Canada 0 - 16 Accompanied Footnote 12 13 - 24 Unaccompanied Footnote 13 25 - 49 50 - 64 65+ Canadian Citizen
3.2%
11.5%
61.4%
20.1%
3.8%
Immigrant
8.1%
16.5%
55.2%
17.4%
2.8%
Resettled Refugee
10.1%
16.3%
65.0%
7.7%
0.9%
Asylum Seeker
17.0%
17.8%
58.2%
6.4%
0.7%
Temporary Visa Holder
4.8%
30.7%
56.3%
7.3%
0.9%
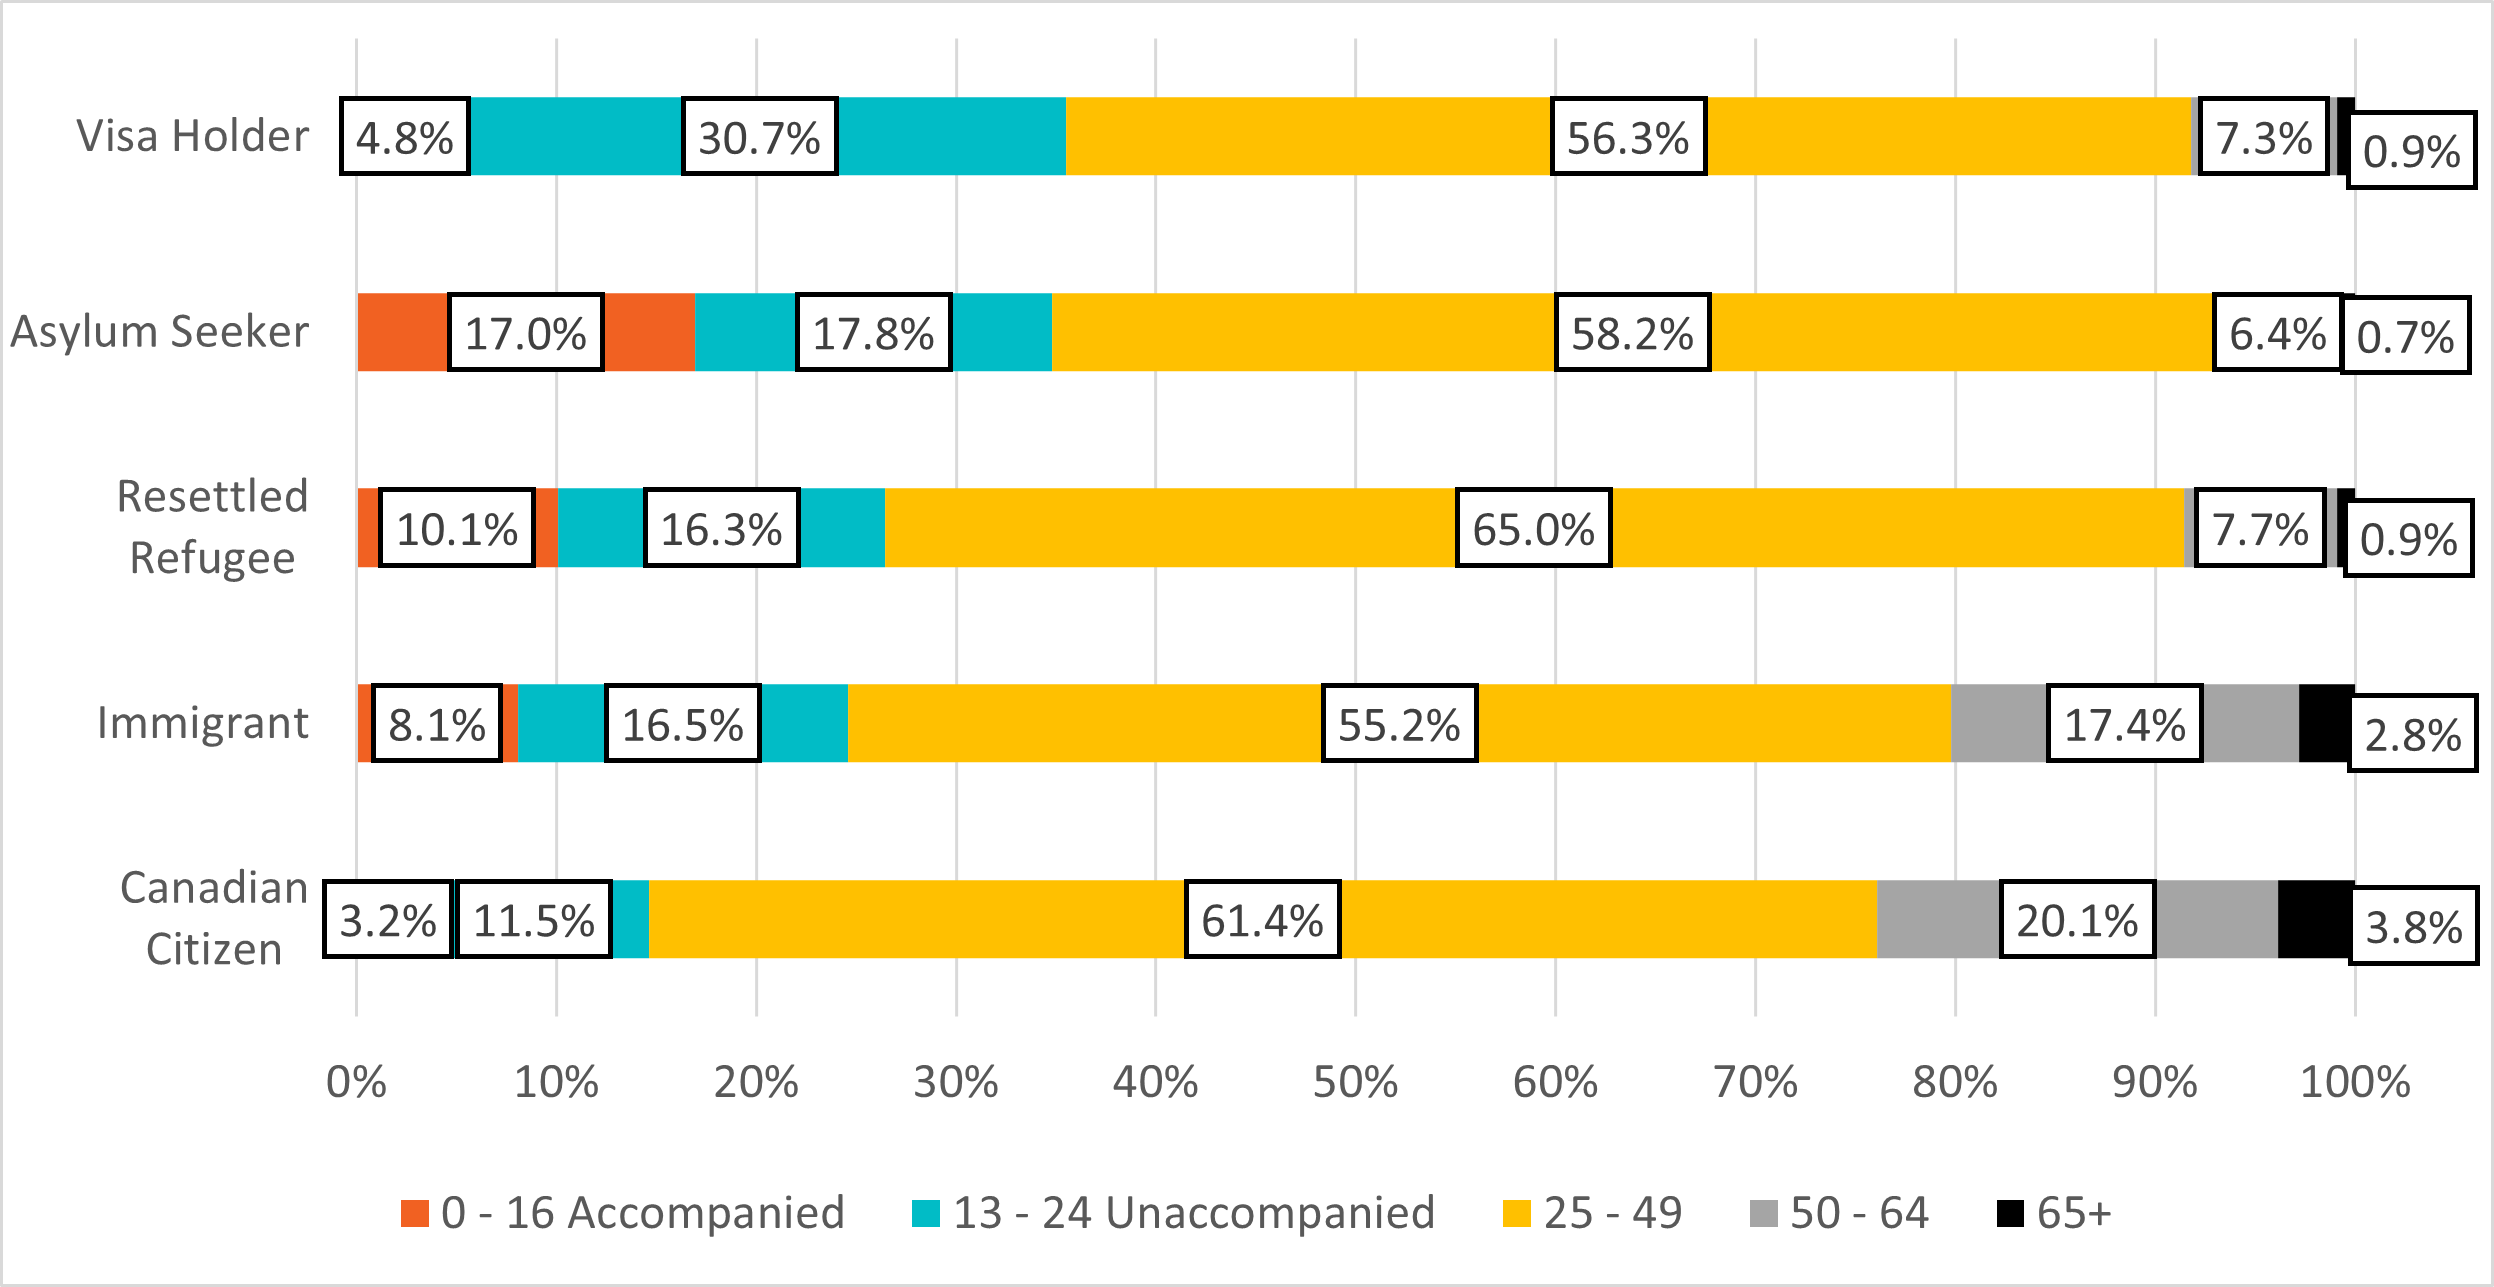
Between 2020 and 2023, there was a slightly higher proportion of women among resettled refugees and asylum seekers compared to Canadian citizens (Figure 3). There was no significant difference in gender profile between any other non-citizen groups and Canadian citizens.
Figure 3: Gender of emergency shelter users by status in Canada, 2020 to 2023 (aggregate)
-
Figure 3 - Text version
Figure 3: Gender of emergency shelter users by status in Canada, 2020 to 2023 (aggregate) Status in Canada Male Female Gender Diverse Canadian Citizen
70.1%
29.0%
0.9%
Immigrant
68.9%
30.6%
0.5%
Resettled Refugee
64.5%
34.5%
0.9%
Asylum Seeker
64.5%
35.1%
0.4%
Temporary Visa Holder
71.3%
27.9%
0.8%
Distribution of emergency shelter users by shelter type and status in Canada
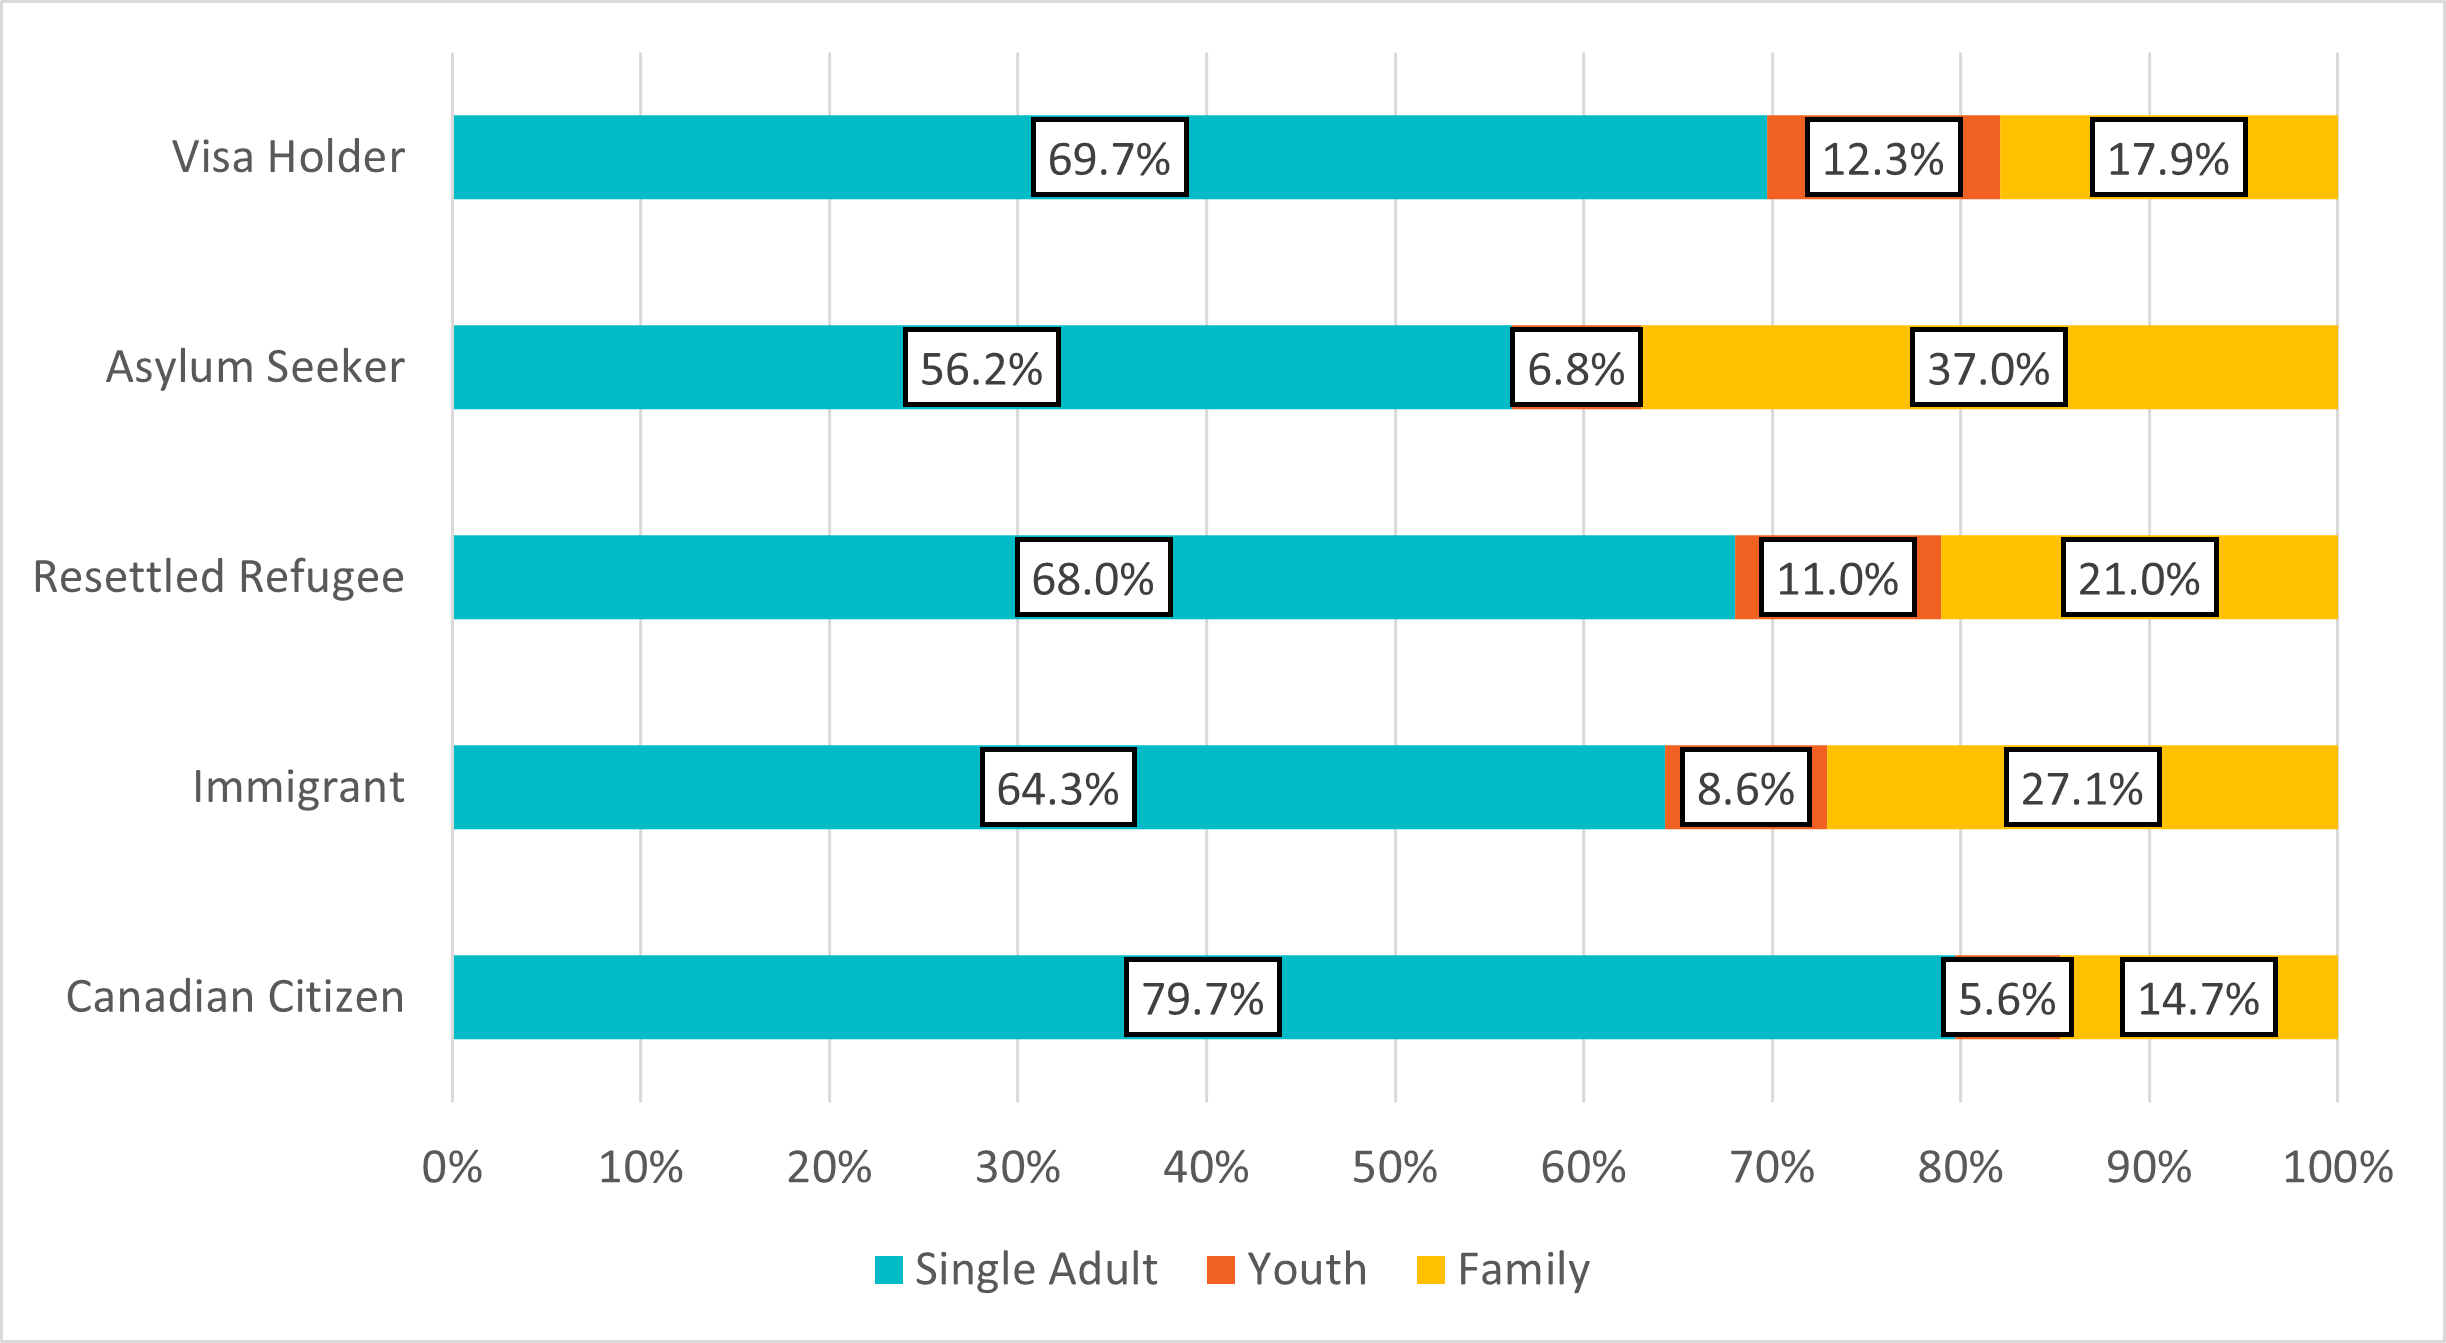
For all shelter types (single adults, youth, and family), the majority of shelter users were Canadian citizens. However, the distribution of citizenship status between shelter types differed significantly (Figure 4).
For example, a significantly higher proportion of shelter users who were immigrants (27.1%), resettled refugees (21.0%) and asylum seekers (37.0%) used family shelters between 2020 and 2023 compared to Canadian citizens (14.7%). This indicates that certain groups of non-citizens were more likely than Canadian citizens to access shelters as part of a family, which also explains the younger age profile among non-citizens.
A significantly higher proportion of temporary visa holders (12.3%) accessed youth shelters compared to Canadian citizens (5.6%). This is unsurprising considering that those coming to the country under student visas and temporary foreign workers are included among this group. Resettled refugees (11.0%) were also more likely to access youth shelters compared to Canadian citizens. There was no statistically significant difference in youth shelter access among any other groups.
Regardless of citizenship status, the majority of shelter users tended to access single adult shelters between 2020 and 2023. A statistically higher proportion of Canadian citizens (79.7%) accessed single adult shelters compared to non-citizen groups.
Figure 4: Distribution of shelter users by status in Canada and shelter type, 2020 to 2023 (aggregate)
-
Figure 4 - Text version
Figure 4: Distribution of shelter users by status in Canada and shelter type, 2020 to 2023 (aggregate) Shelter Type Status in Canada Single Adult Youth Family Canadian Citizen
79.7%
5.6%
14.7%
Immigrant
64.3%
8.6%
27.1%
Resettled Refugee
68.0%
11.0%
21.0%
Asylum Seeker
56.2%
6.8%
37.0%
Temporary Visa Holder
69.7%
12.3%
17.9%
Length of stay by status in Canada and family status
There was no statistical difference in length of stay among Canadian citizens staying in individual shelters versus family shelters. However, immigrants, resettled refugees, asylum seekers, and visa holders who accessed family shelters stayed significantly longer than their single counterparts. This may be due to factors including family size, housing discrimination and available supports.
Immigrant families stayed significantly more days in shelters compared to Canadians families. There was no significant difference in stay length between Canadians accessing family shelters and any other non-citizen group. Single refugees and asylum claimants stayed significantly fewer days in shelters on average compared to Canadians. There were no significant differences between any other groups.
| Status in Canada | Individual | Family |
|---|---|---|
| # of nights | ||
Canadian Citizen |
51 |
56 |
Immigrant |
50 |
69 |
Resettled Refugee |
44 |
55 |
Asylum Seeker |
43 |
64 |
Visa Holder |
45 |
70 |
Distribution of non-citizens in emergency shelters by population size and region
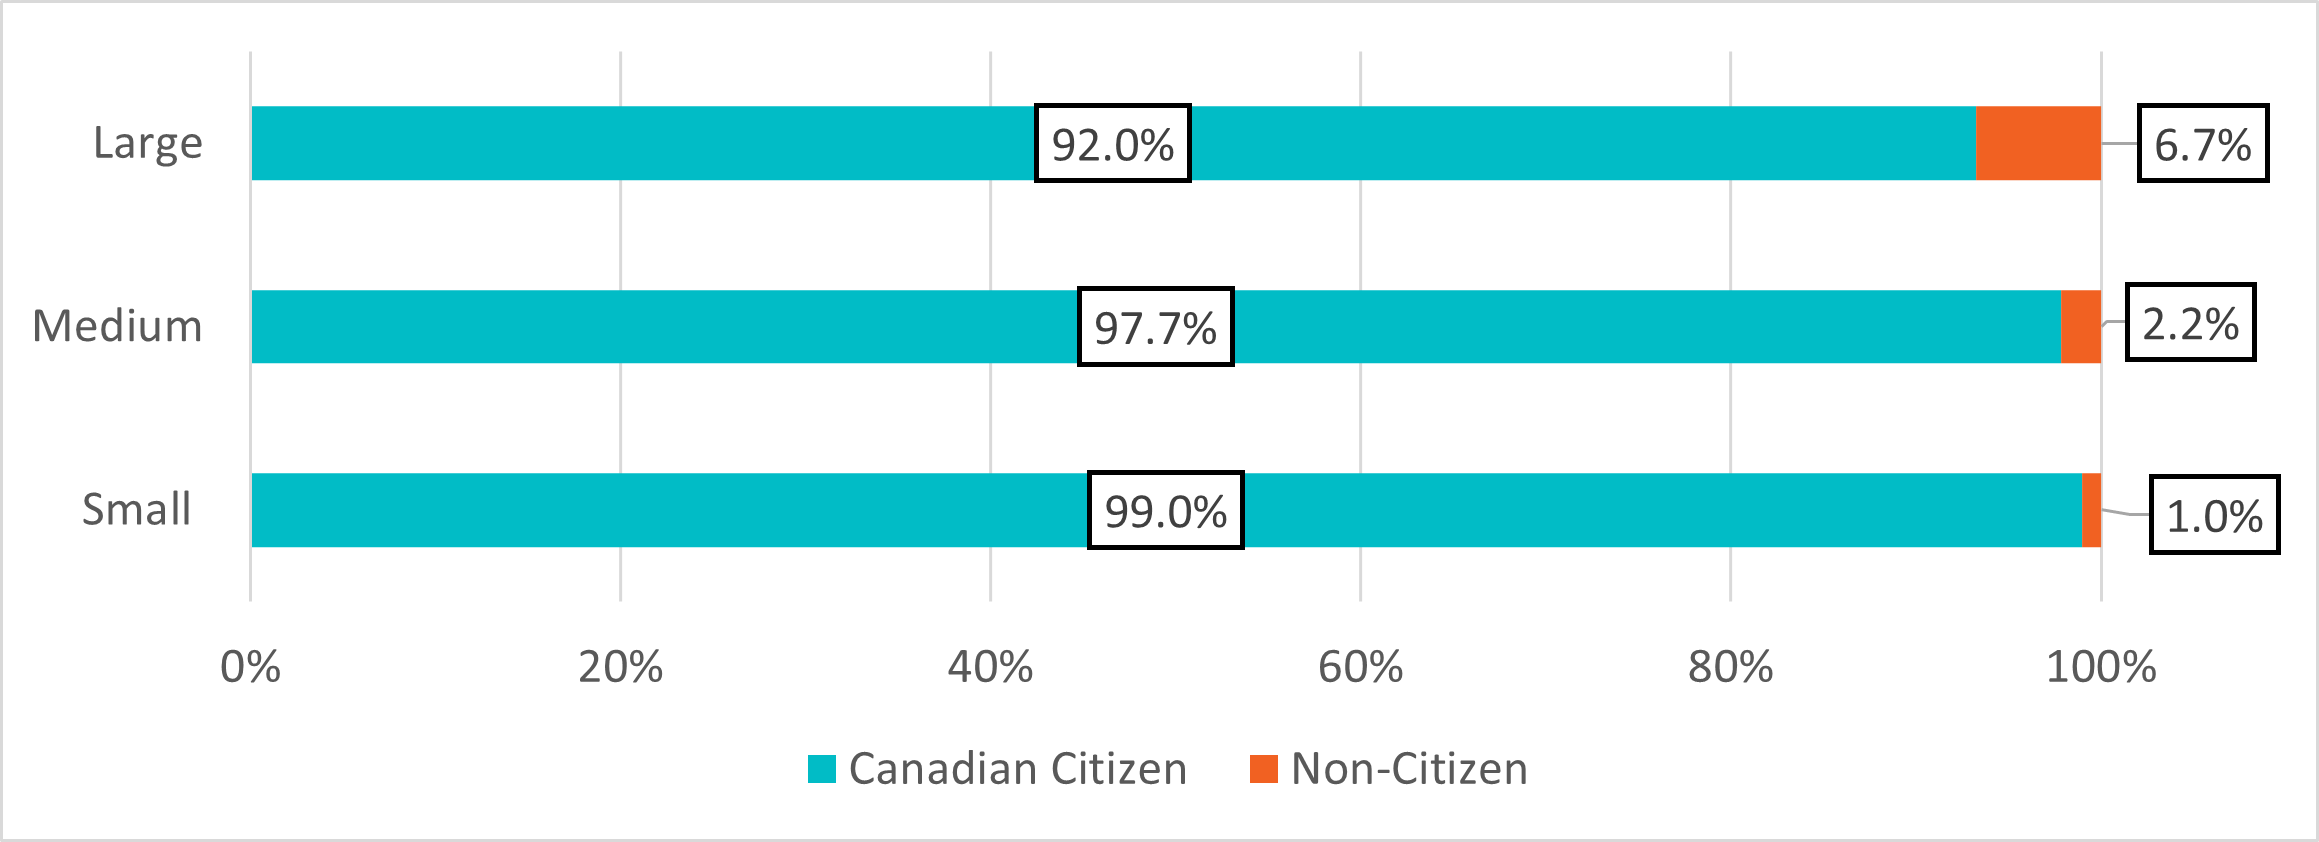
According to Statistics Canada's definition, population centres are classified into three groups, depending on the size of their population:
- small (population 1,000 to 29,999),
- medium (population 30,000 to 99,999); and
- large (population 100,000 or greater).
There are significantly more non-citizens in large population centres (6.7%) compared to medium (2.2%) and small population centres (1.0%, Figure 5). This is true of all groups with the lowest proportion found in small population centres and the largest proportion found in large population centres. This may be the result of available services, accessibility (language, travel), social networks, and work opportunities.
Figure 5: Proportion of emergency shelter users by population size and status in Canada, 2020 to 2023 (aggregate)
-
Figure 5 - Text version
Figure 5: Proportion of emergency shelter users by population size and status in Canada, 2020 to 2023 (aggregate) Status in Canada Small Medium Large Canadian Citizen
99.0%
97.7% 92.0%
Non-Citizen
1.0%
2.2% 6.7%
Rates of shelter use by status in Canada
| Year | Estimated number of asylum seekers and visa holders | Estimated number of non-permanent residents in Q1 Footnote 14 | Rate of shelter use per 10,000 | Estimated number of citizens and permanent residents | Estimated number of citizens and permanent residents in Q1 Footnote 15 | Rate of shelter use per 10,000 |
|---|---|---|---|---|---|---|
2021 |
533 |
1,356,622 |
3.9 |
83,069 |
37,209,410 |
22.3 |
2022 |
1,603 |
1,856,883 |
8.6 |
93,035 |
37,671,103 |
24.7 |
2023 |
3,986 |
2,661,784 |
15.0 |
109,918 |
38,122,572 |
28.8 |
Statistics Canada has released quarterly estimates of non-permanent residents by type from 2021 to present3. The non-permanent resident types are mutually exclusive and are derived in the following order of classification: asylum seekers, protected person and related groupsFootnote 16, then permit holders and their family members. Visitors are excluded from the non-permanent resident population. This information can be used to calculate the rate of shelter use among this population controlling for overall population growth between 2021 and 2023 (Table 2).
Not only did the number of non-permanent residents grow overall, but the rate of shelter use grew almost fourfold between 2021 (3.9 per 10,000) and 2023 (15.0 per 10,000). There may be several contributing factors for this:
Visibility of non-citizens in the dataset
- As temporary COVID-19 shelters closed, resettled refugee and asylum seekers became more visible in the permanent emergency shelter system.
- Overflow from saturated communities that do not provide status data (e.g. Toronto) into neighbouring communities that do as the population of non-permanent residents continues to grow beyond the capacity of regions to respond.
Application processing issues
- The lifting of COVID-19 pandemic-related border restrictions and the high level of people seeking Canada's protection led to a renewed surge in refugee claims in Canada, resulting in critical delays in the early stages of refugee claim processing.Footnote 17These delays may have resulted in people exhausting their resources before a decision could be reached.
Affordability and availability of housing
- Increased cost of livingFootnote 18 makes it particularly difficult for non-citizens to afford adequate housing.
- An increase in non-permanent residents without an equal increase in affordable housing.
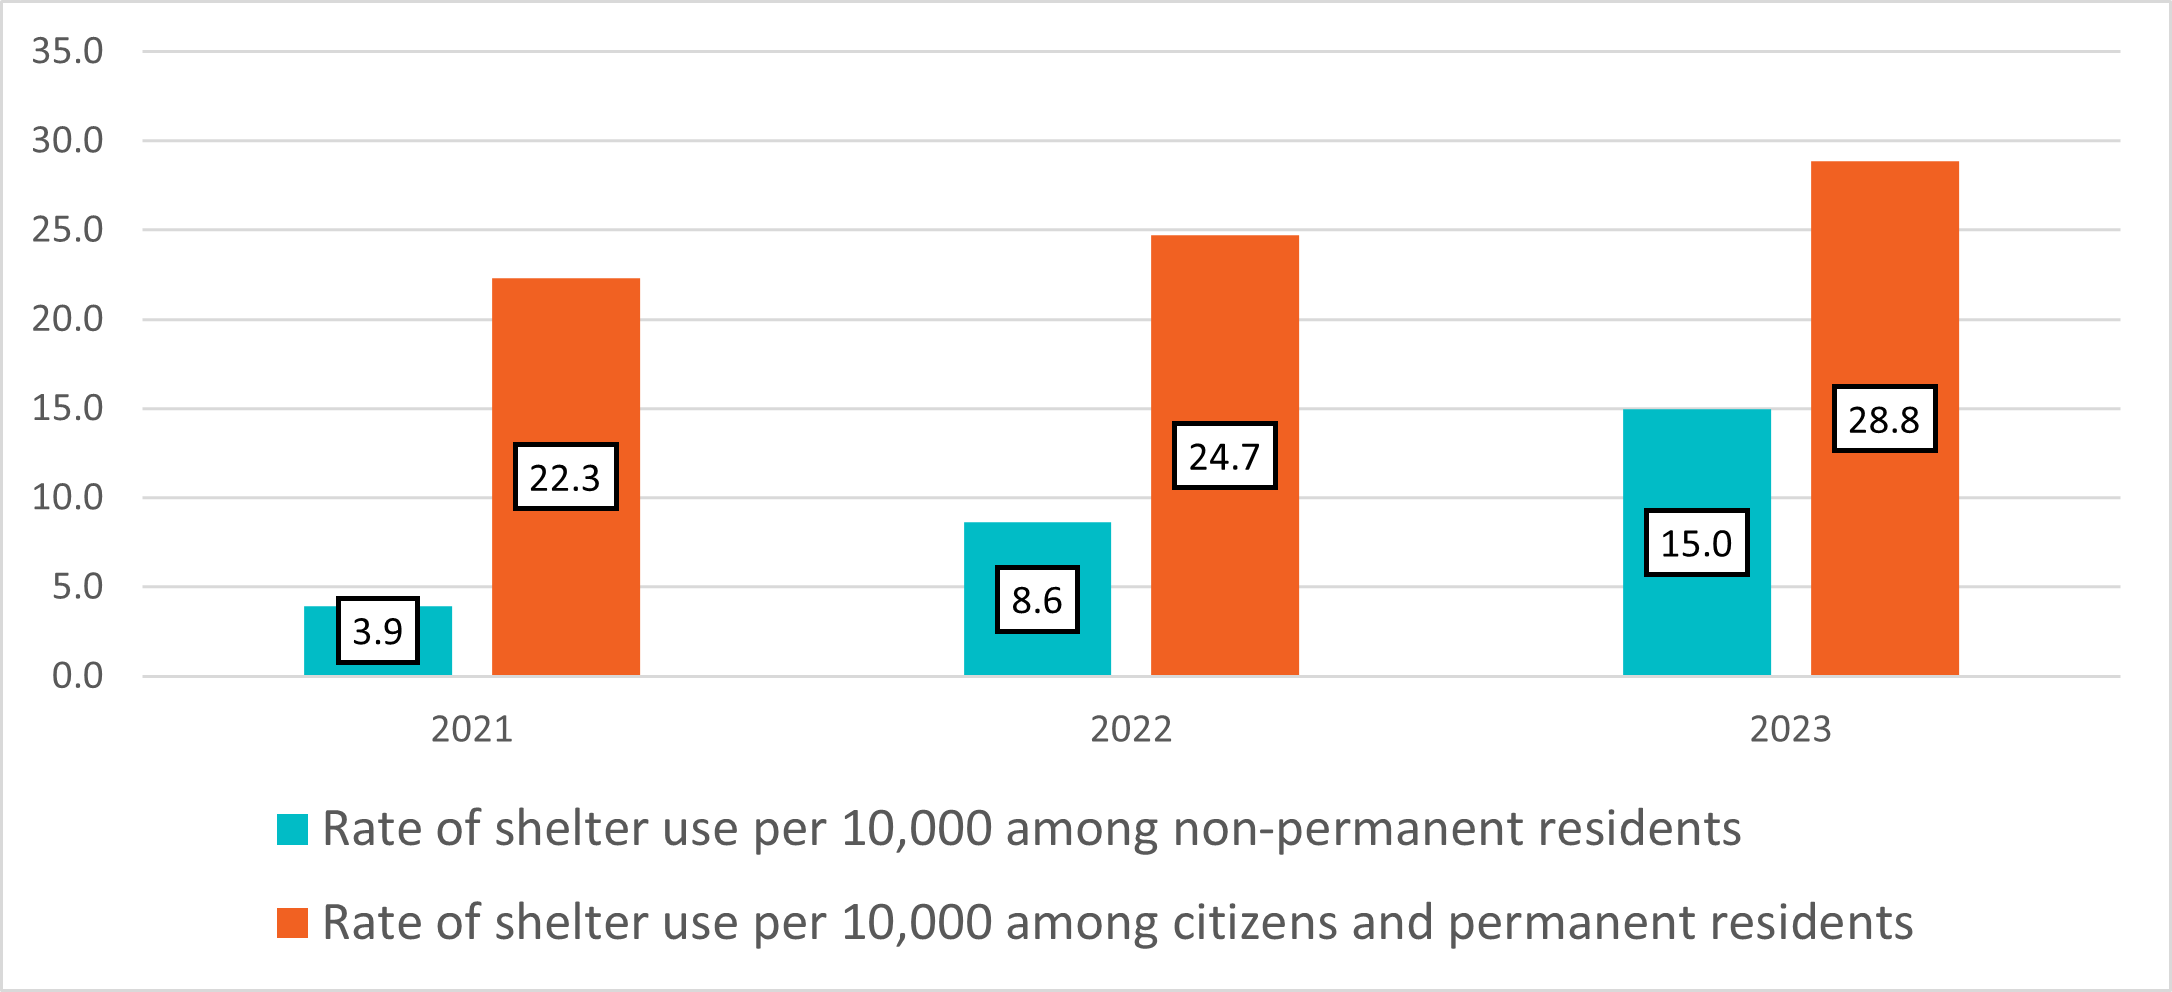
In 2021, the rate of shelter use among asylum seekers, and visa holders was significantly lower than the rate among permanent residents. However, by 2023 that gap shrunk considerably (Figure 6).
Unfortunately, the impact of the COVID-19 pandemic on rates of shelter use among non-permanent residents cannot be fully explored due to a lack of data on the overall numbers of non-permanent residents in Canada pre-2021.
Figure 6: Rate of shelter use among non-permanent residents compared to permanent residents, 2021 to 2023
-
Figure 6 - Text version
Figure 6: Rate of shelter use among non-permanent residents compared to permanent residents, 2021 to 2023 Year Rate of shelter use per 10,000 among non-permanent residents Rate of shelter use per 10,000 among citizens and permanent residents 2021
3.9
22.3
2022
8.6
24.7
2023
15.0
28.8
Point-in-Time surveys: Analysis of homelessness among those who arrived as newcomers to Canada
Whereas the shelter data analysis provides a longitudinal analysis of people accessing the shelter system, the Point-in-Time count surveys provide a one-night snapshot of people experiencing homelessness inside and outside of the shelter system. Another key difference is that while shelter data indicates the current citizenship status of shelter users, the PiT count survey asks people about their status on arrival in Canada.Footnote 19 As a result, this section describes longer-term outcomes for people who arrived as newcomers to Canada, but whose status may have since changed (e.g. people who arrived as asylum claimants may now be permanent residents or citizens).
These data come from the nationally-coordinated Point-in-Time count surveys conducted from March 2020 to December 2022.
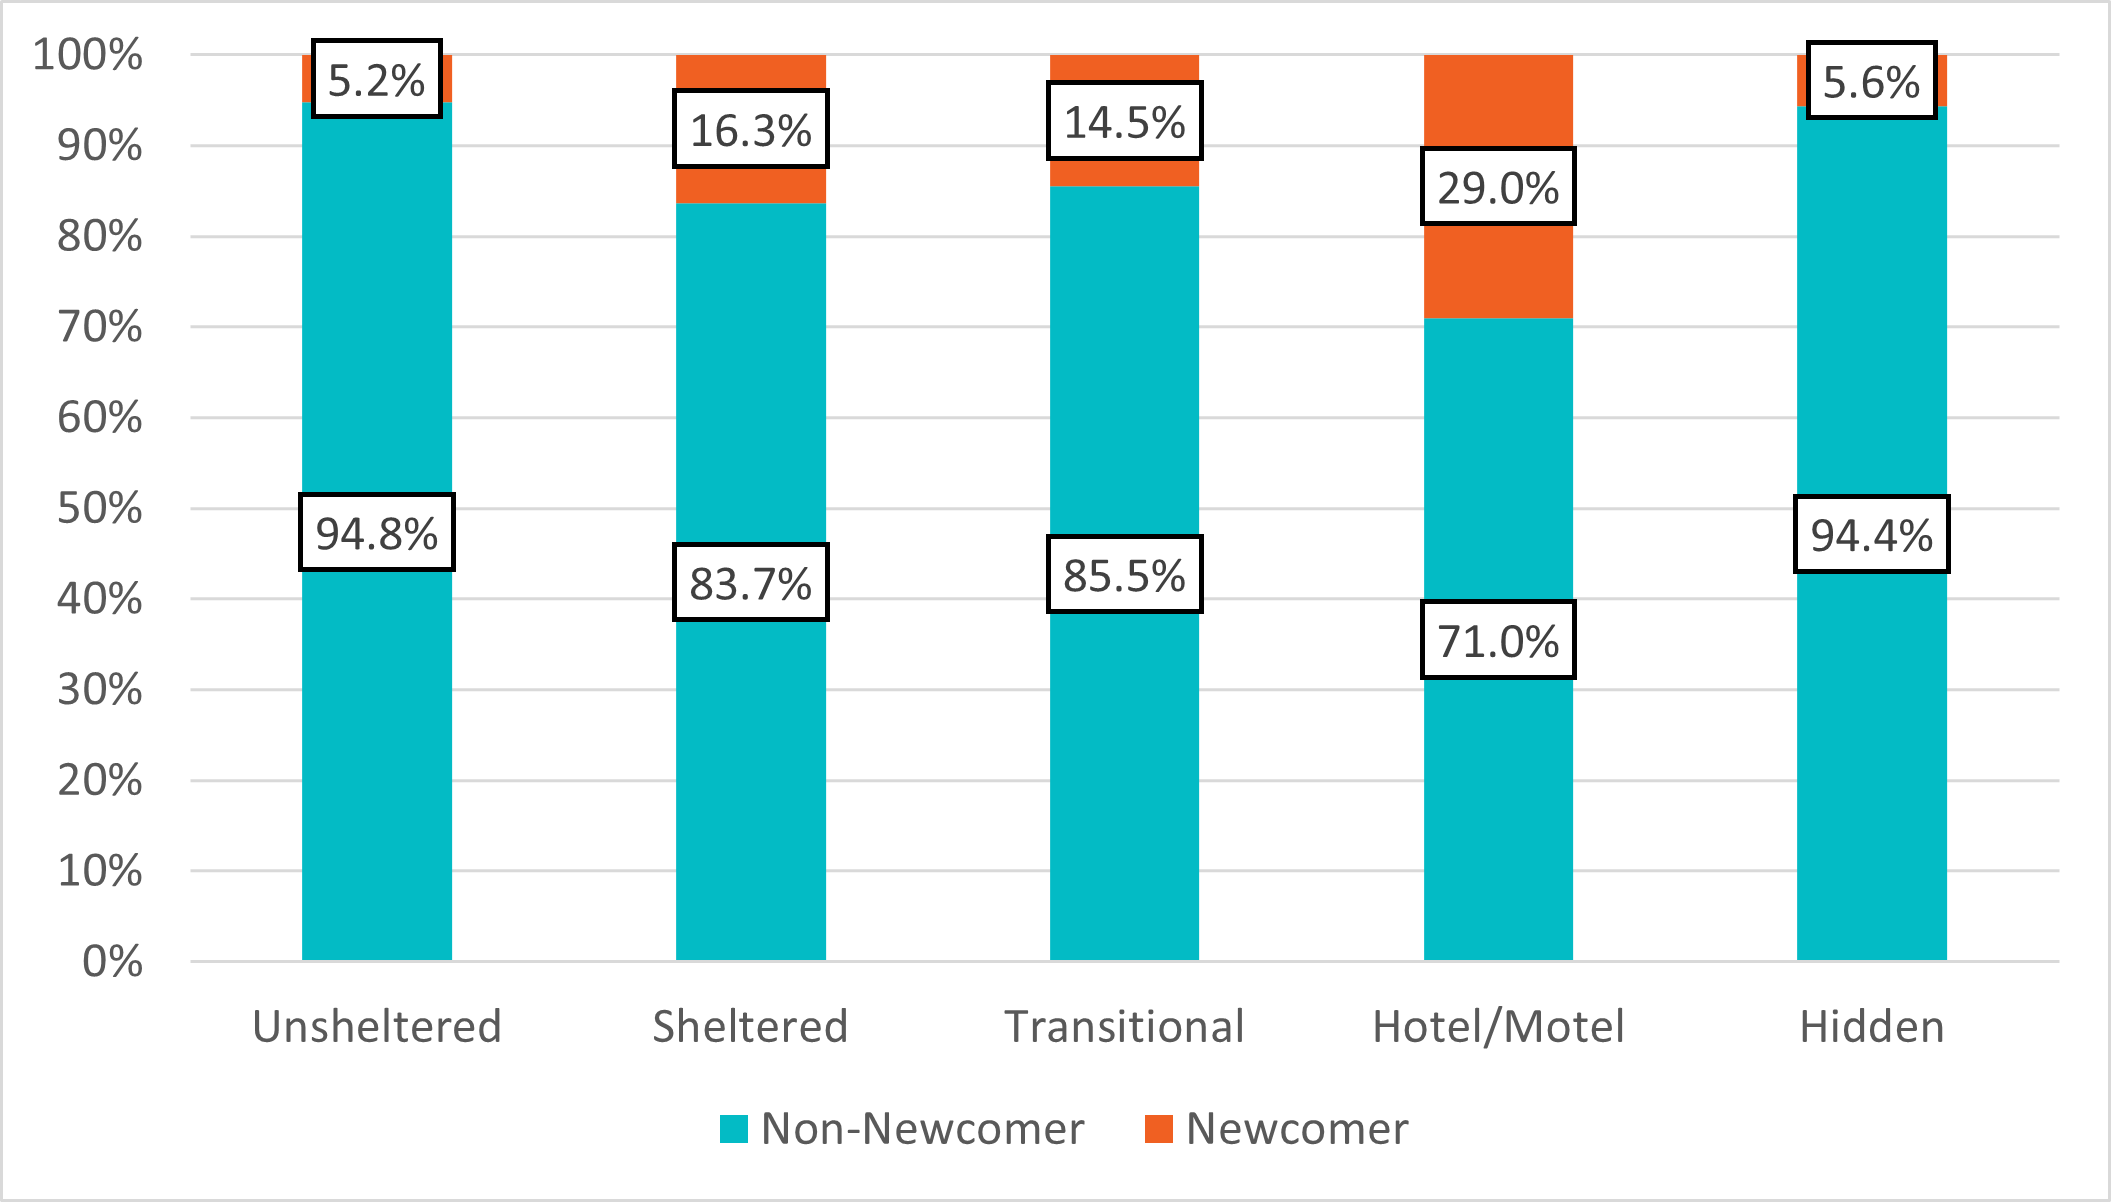
Overnight location
Although people who arrived as newcomers made up a minority of all respondents to the PiT count survey, their representation varied across locations. They were most highly represented in "Motel/Hotel" locations. These were locations where people were typically provided with a hotel or motel room in place of a space at a traditional homelessness shelter.
Figure 7: Overnight location by newcomer history
-
Figure 7 - Text version
Figure 7: Overnight location by newcomer history Newcomer history Unsheltered Sheltered Transitional Hotel/Motel Hidden Non-Newcomer
94.8%
83.7% 85.5% 71.0% 94.4%
Newcomer
5.2%
16.3% 14.5% 29.0% 5.6%
Demographics of people experiencing homelessness who had a newcomer history
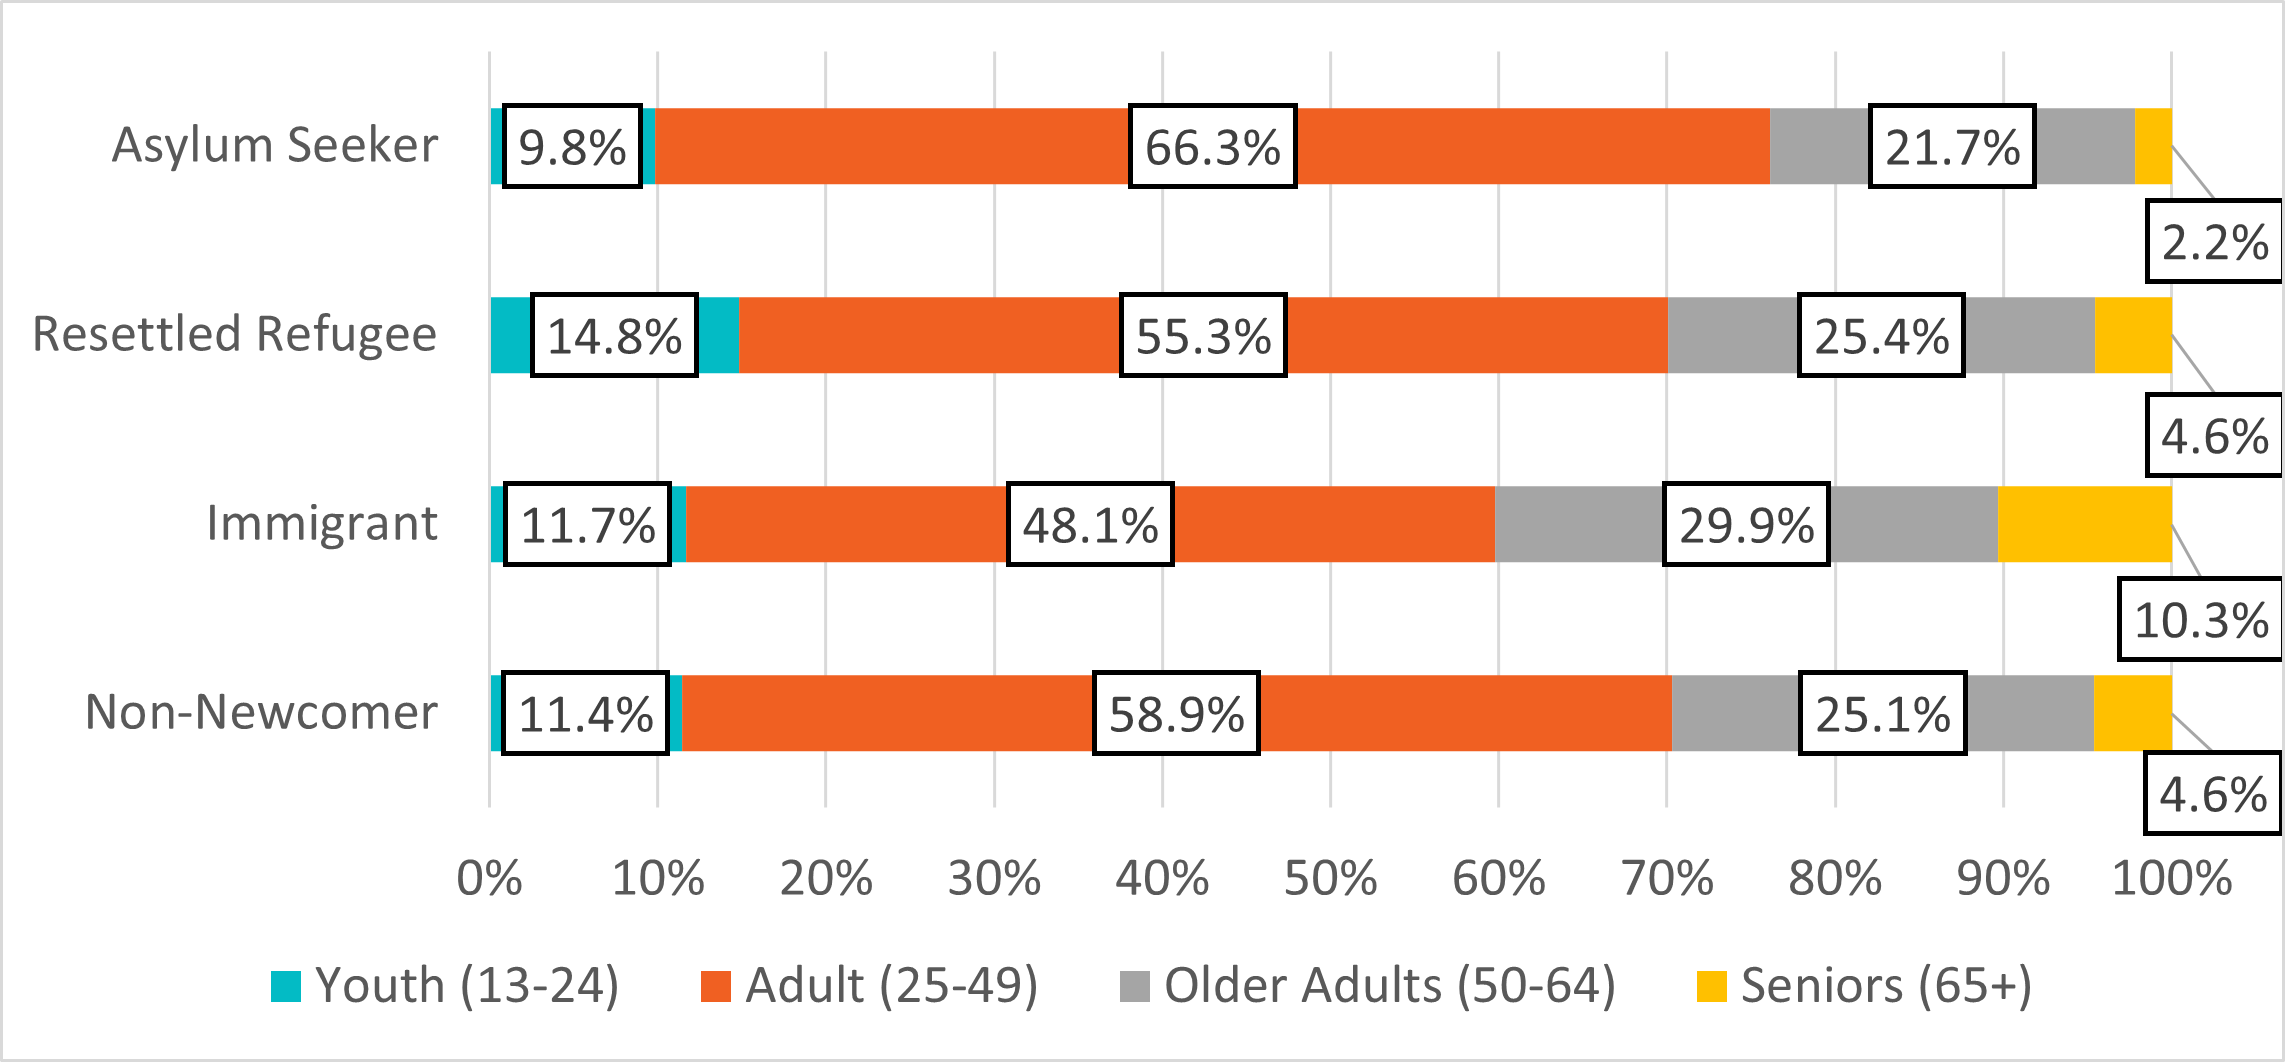
Adults (aged 25-49) make up the majority of respondents regardless of newcomer experience, although the representation of adults was particularly evident among those who arrived as resettled refugees and asylum seekers.
Figure 8: Age distribution by newcomer history
-
Figure 8 - Text version
Figure 8: Age distribution by newcomer history Newcomer history Youth (13-24) Adult (25-49) Older Adults (50-64) Seniors (65+) Non-Newcomer
11.4%
58.9%
25.1%
4.6%
Immigrant
11.7%
48.1%
29.9%
10.3%
Resettled Refugee
14.8%
55.3%
25.4%
4.6%
Asylum Seeker
9.8%
66.3%
21.7%
2.2%
Although men typically represent 60 to 65% of PiT count survey respondents, newcomer experience categories had a greater representation of women. Notably, people who arrived as asylum seekers had the highest proportion of female respondents (47.2%), more than any other newcomer category. Gender-diverse respondents accounted for 3% of all respondents and rates were lower among those who came to Canada as refugees and immigrants.
| Newcomer history | Male | Female | Gender Diverse |
|---|---|---|---|
Non-Newcomer |
64.0% |
33.1% |
2.8% |
Immigrant |
64.2% |
34.1% |
1.7% |
Resettled Refugee |
62.2% |
35.0% |
2.8% |
Asylum Seeker |
51.7% |
47.2% |
1.1% |
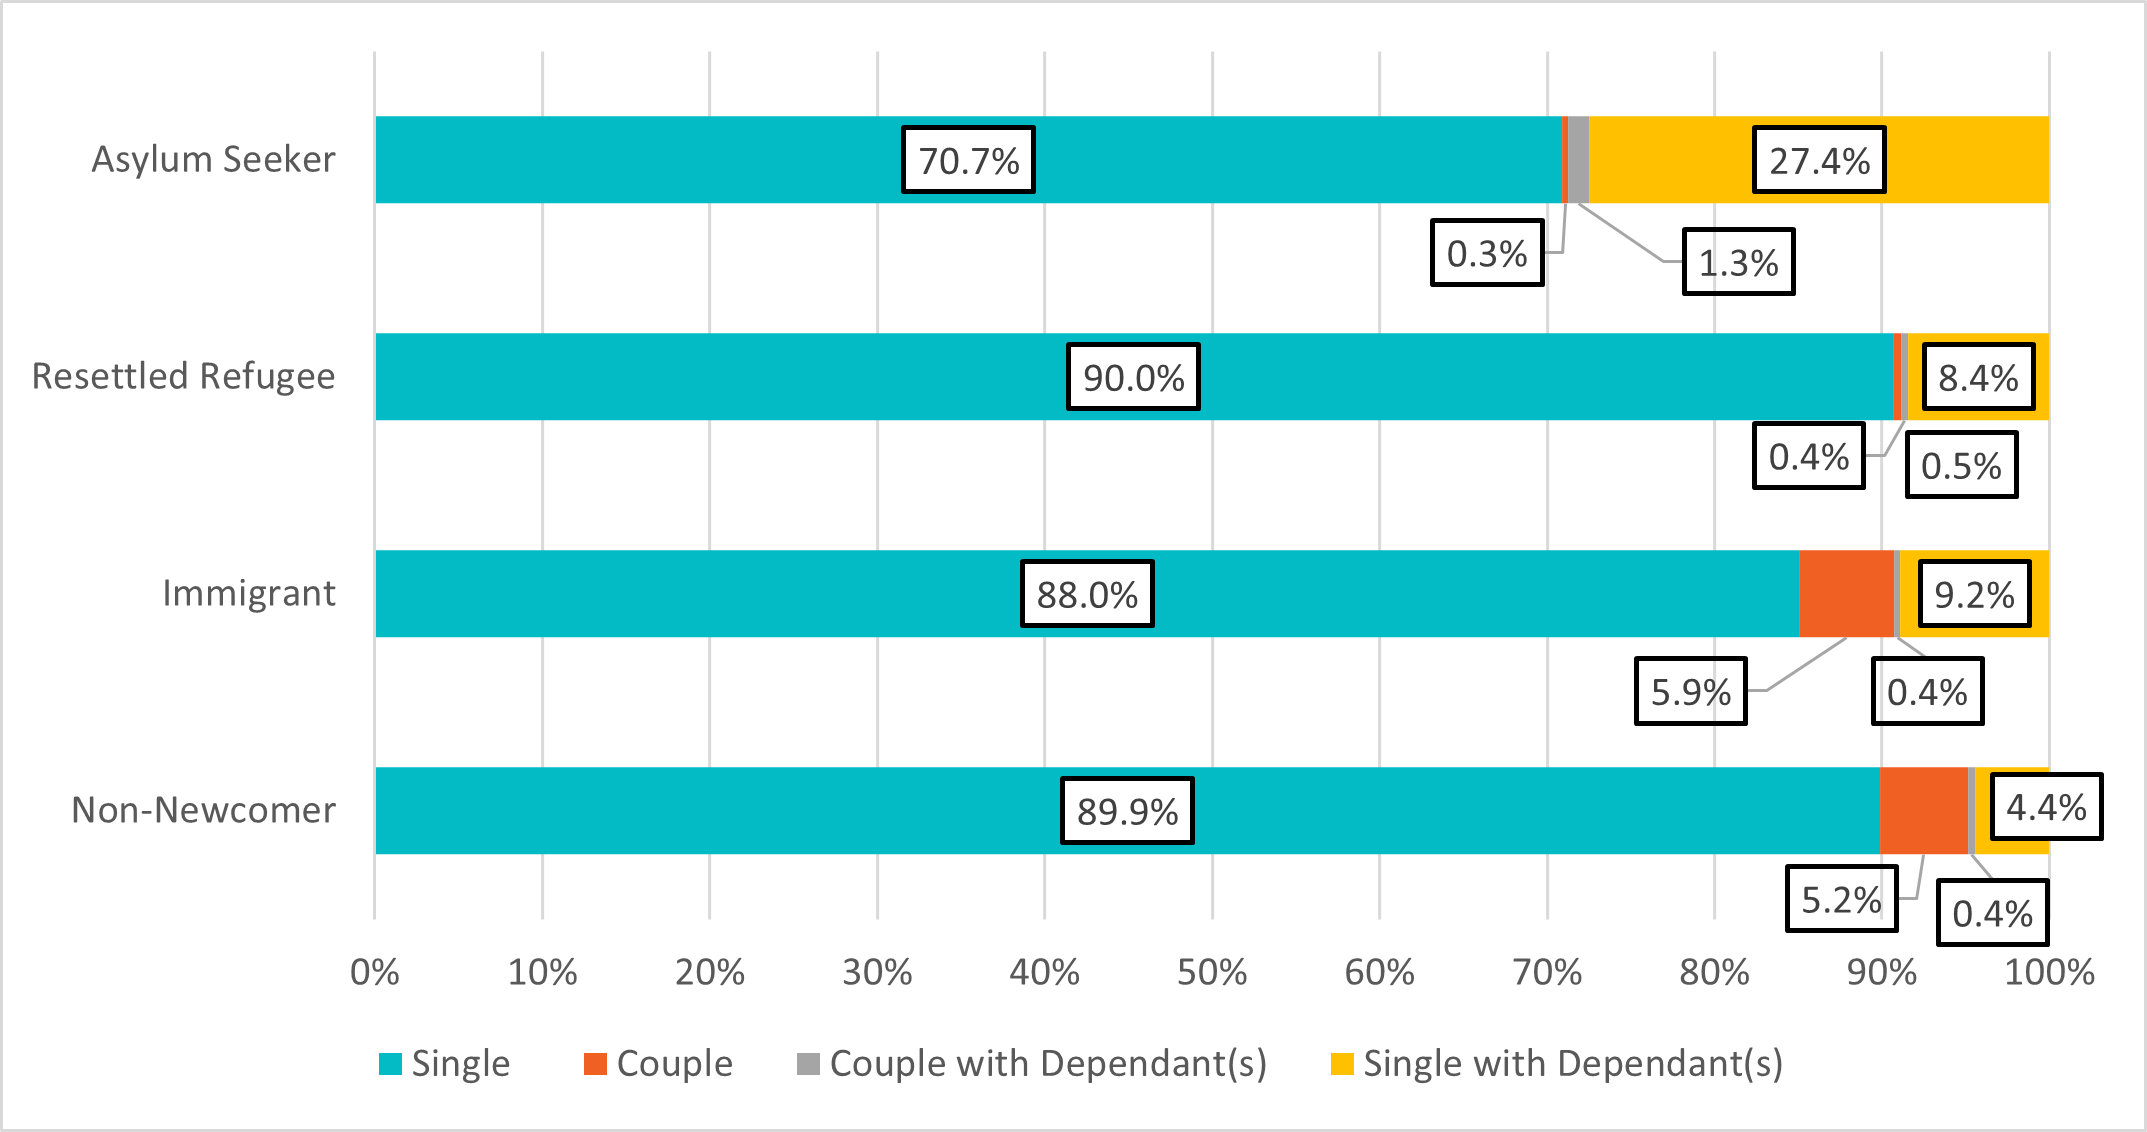
Single individuals made up the majority of the respondents, corresponding to 89% of all surveyed. However, a notable proportion of people who arrived as asylum claimants were part of single-with-dependant(s) households, representing 27.4%, which is significantly higher than in other groups. In comparison, 9.2% of those who arrived as immigrants and 8.4% of those who arrived as refugees were part of single-with-dependant(s) households. Additionally, a small proportion of those who came as asylum claimants (1.3%) were part of couple-with-dependant(s) households, compared to 0.4% across the other newcomer groups.
Figure 9: Household type by newcomer history
-
Figure 9 - Text version
Figure 9: Household type by newcomer history Newcomer history Single Couple Couple with dependant(s) Single with dependant(s) Non-Newcomer
89.9%
5.2%
0.4%
4.4%
Immigrant
88.0%
5.9%
0.4%
9.2%
Resettled Refugee
90.0%
0.5%
0.4%
8.4%
Asylum Seeker
70.7%
0.3%
1.3%
27.4%
Income sources
A total of 21,489 individuals provided their source of income. Participants were asked to select all types of income that apply. The following table displays the proportion of participants within each newcomer history category that indicated that they receive a certain income.
Welfare/Social Assistance was the most commonly accessed source of income across all groups.
| Type of Income | Non-Newcomer | Immigrant | Resettled Refugee | Asylum Seeker |
|---|---|---|---|---|
Full-Time Employment |
4.1% |
8.3% |
4.9% |
7.6% |
Informal Sources |
8.9% |
3.7% |
2.8% |
0.7% |
Employment Insurance |
3.6% |
4.5% |
3.7% |
3.8% |
Welfare/Social Assistance |
45.9% |
38.5% |
47.8% |
59.9% |
Disability |
26.3% |
21.8% |
21.6% |
10.5% |
Child/Family Benefits |
2.9% |
4.3% |
7.1% |
6.0% |
Money from Family/Friends |
5.2% |
4.4% |
1.5% |
2.4% |
GST Refund |
6.3% |
4.8% |
4.9% |
6.2% |
Sample Size |
18,886 |
1,860 |
324 |
419 |
Reasons for housing loss
Survey respondents were asked what led to their most recent housing loss and a total of 21,418 individuals provided a response. People were able to select multiple reasons for housing loss. Among respondents who had come to Canada as a newcomer, "Not Enough Income" was the reason most commonly cited for housing loss (ranging from 32% to 34%), followed by “Conflict” with spouse or partner (9% to 14%), or with a landlord (8 % to 13%).
"Addiction or Substance Use" was the most often selected single reason for housing loss among non-newcomers (19%), but it was less commonly cited among those with a newcomer experience (4% to 10%).
Some differences were seen across newcomer categories. For example, factors related to experiences of interpersonal conflict or abuse were typically more common among people who had arrived in Canada as immigrants (8.0%) than those who came as resettled refugees (5%) or asylum seekers (7%).
| Reason for Housing Loss | Non-Newcomer | Immigrant | Resettled Refugee | Asylum Seeker |
|---|---|---|---|---|
Physical Health |
4.8% |
5.8% |
6.8% |
2.9% |
Mental Health |
10.4% |
7.6% |
8.8% |
4.8% |
Addiction or Substance Use |
19.4% |
10.3% |
7.6% |
3.6% |
Not Enough Income |
27.6% |
34.0% |
31.8% |
32.8% |
Experience Abuse: Spouse / Partner |
5.5% |
8.0% |
4.7% |
7.0% |
Experienced Abuse: Parent / Guardian |
1.9% |
2.3% |
2.6% |
2.0% |
Conflict: Spouse / Partner |
14.2% |
13.9% |
8.8% |
9.3% |
Conflict: Parent / Guardian |
7.5% |
7.8% |
7.4% |
3.6% |
Conflict: Landlord |
14.4% |
12.7% |
10.9% |
8.1% |
Hospitalization or Treatment Centre |
3.7% |
3.0% |
2.4% |
1.1% |
Incarcerated (Jail or Prison) |
6.5% |
3.3% |
5.0% |
1.4% |
Sample Size |
18,704 |
1,932 |
340 |
442 |
First experience of homelessness and years in Canada
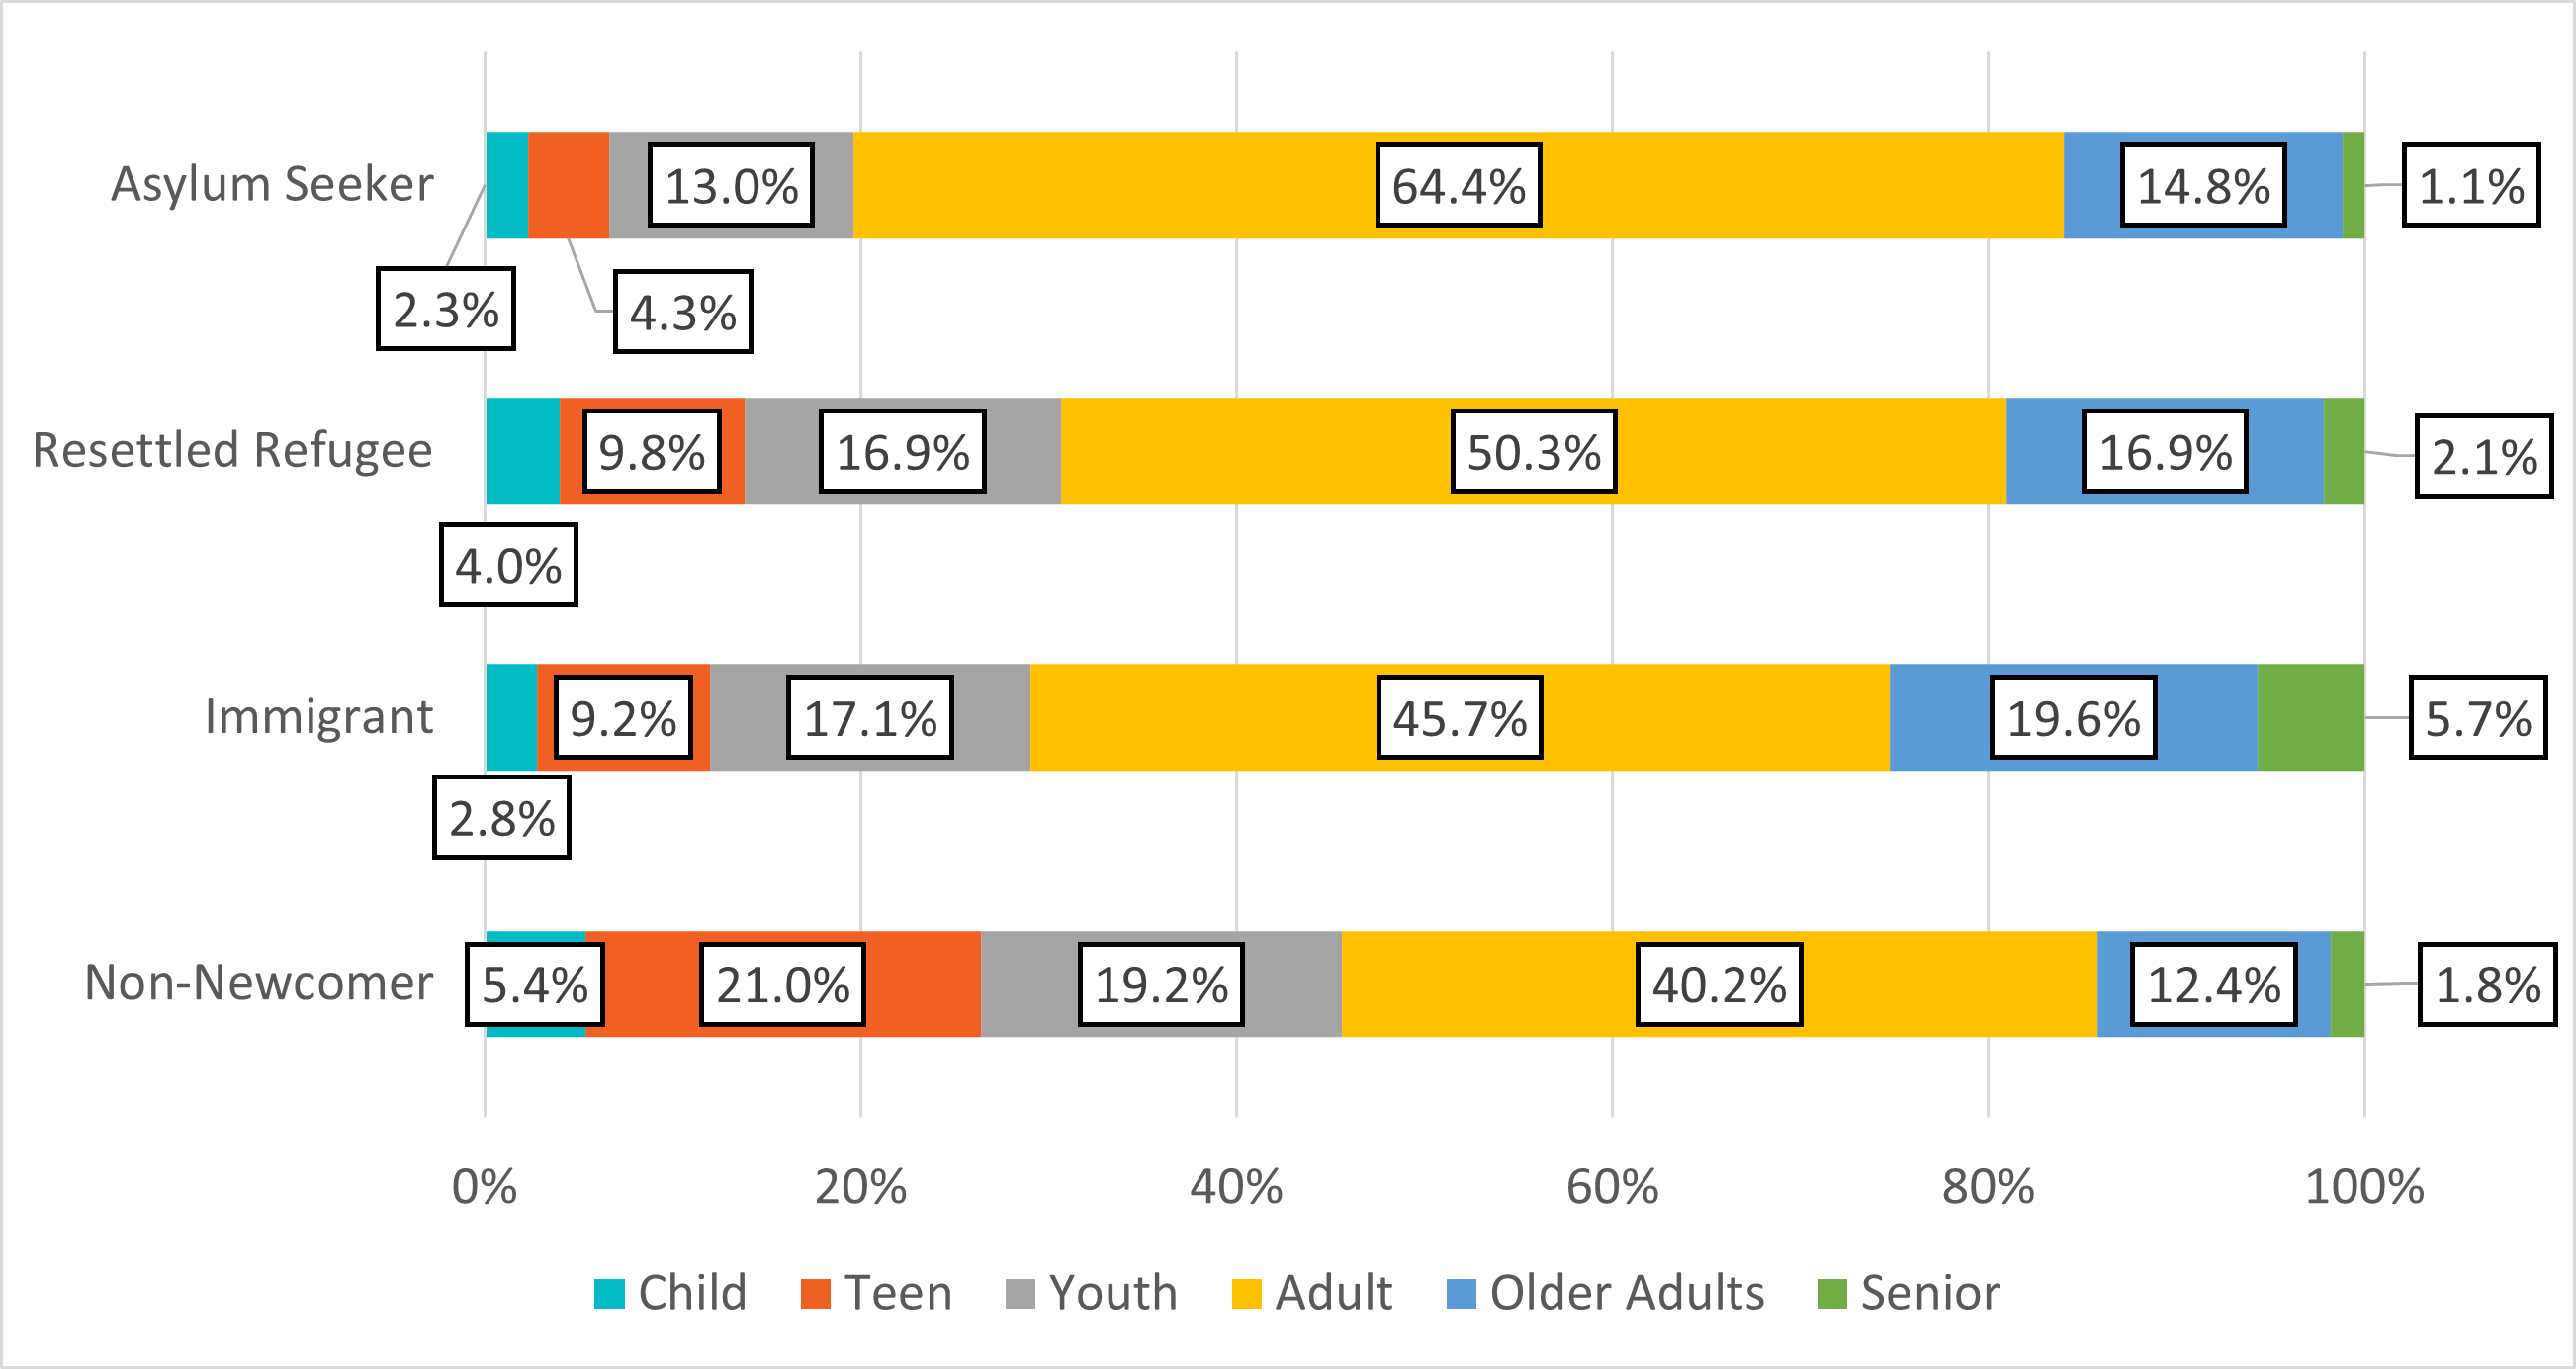
Respondents were asked at what age they first experienced homelessness. While profiles were largely similar between groups, those with a newcomer experience were less likely to report a first experience homelessness at a young age compared to non-newcomers. The majority of newcomers first experienced homelessness over the age of 25, ranging from 70% for those who came as resettled refugees to 80% for those who came as asylum seekers. The immigrant category had the highest proportion of individuals experiencing homelessness for the first time as seniors (5.7%).
An important consideration here is that the survey does not collect responses from accompanied children (i.e., dependents). This means that there may be a portion of the current homeless population that are children, and thus experienced homelessness for the first time as children, that are not included in this analysis. This group may include children in households with and without a newcomer experience given the greater proportion of accompanied children and youth among newcomers. Furthermore, some dependent children may not continue to experience homelessness, and may never be surveyed through a PiT Count.
Figure 10: Age of first experience of homelessness by newcomer history
-
Figure 10 - Text version
Figure 10: Age of first experience of homelessness by newcomer history Newcomer history Child Teen Youth Adults Older Adults Seniors Non-Newcomer
5.4%
21.0%
19.2%
40.2%
12.4%
1.8%
Immigrant
2.8%
9.2%
17.1%
45.7%
19.6%
5.7%
Resettled Refugee
4.0%
9.8%
16.9%
50.3%
16.9%
2.1%
Asylum Seeker
2.3%
4.3%
13.0%
64.4%
14.8%
1.1%
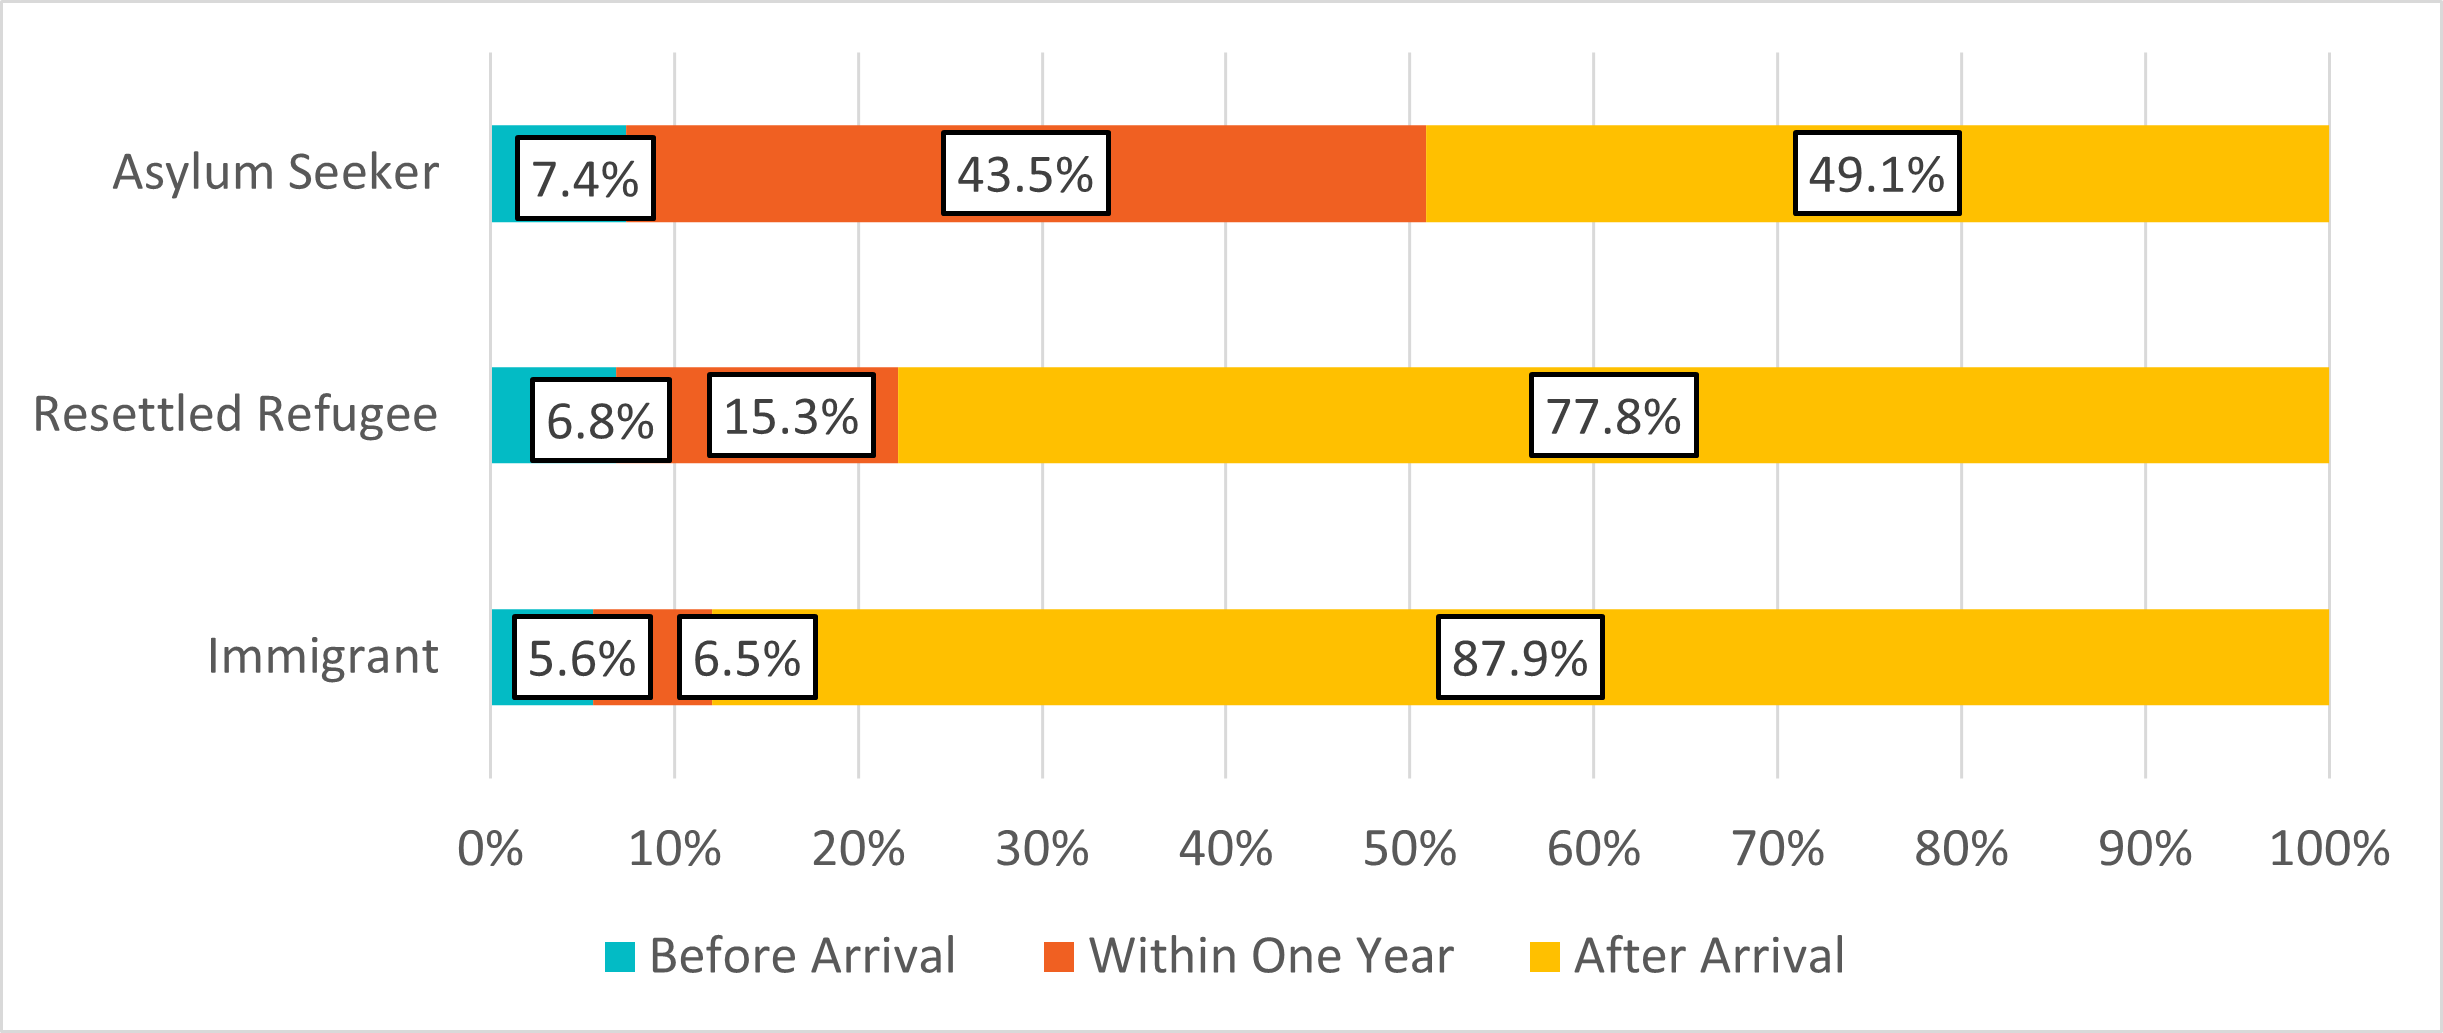
Most respondents reported having their first experience of homelessness after their arrival to Canada, particularly people who came to Canada as immigrants. Those who arrived as asylum seekers were most likely to report that their first experience of homelessness was around the time of their arrival. A previous report indicated a higher proportion of asylum seekers experiencing homelessness within one year of their arrival in Canada. It is possible that changes in the supports available for newcomers, or factors related to the post-pandemic period may have affected risk of homelessness for this group.
Figure 11: Timing of newcomers' first experience of homelessness relative to their arrival in Canada
-
Figure 11 - Text version
Figure 11: Timing of newcomers' first experience of homelessness relative to their arrival in Canada Newcomer history Before Arrival Within One Year After Arrival Immigrant
5.6%
6.5%
87.9%
Resettled Refugee
6.8%
15.3%
77.8%
Asylum Seeker
7.4%
43.5%
49.1%
Key findings
Annual shelter data results: Homelessness and status in Canada
- Non-citizens constituted an estimated 8.9% of the emergency shelter user population in 2023, compared to approximately 9% of the Canadian population, indicating that non-citizens were proportionally represented among shelter users.
- There was a temporary drop in the number of non-citizens shelter users during the peak pandemic years 2020 and 2021. The phase out of border controls, eviction moratoria and other pandemic policies resulted in a subsequent recovery in non-citizen shelter users by 2023.
- While the total number of non-citizens was consistent with pre-pandemic trends, the citizenship profile shifted in 2023 with an increase among resettled refugees and asylum seekers and visa holders and a decrease in immigrants.
- Non-citizen shelter users tend to differ from Canadian Citizens in terms of age profile. Between 2020 and 2023, there was a higher proportion of children among immigrants (8.1%), asylum seekers (17.0%) and resettled refugees (8.7%) compared to Canadian citizens (3.2%). There was also a higher proportion of youth among immigrants (16.5%), asylum seekers (17.8%) and resettled refugees (16.3%), and visa holders (30.7%) compared to Canadian citizens (11.5%).
- This different age profile is partially explained by family status. Immigrants, resettled refugees and asylum claimants were more likely to access family shelters compared to Canadian citizens. Non-citizens who accessed family shelters stayed between 11 and 25 days longer than their single counterparts on average. However, single resettled refugee, asylum seekers and visa holders stayed between 6 and 8 fewer days on average compared to single Canadian citizens.
- Homelessness among non-citizens was unevenly distributed across Canada between 2020 and 2023. Large population centres had a higher proportion of non-citizens (6.7%) compared to medium (2.2%) and small (1.0%) population centres.
- The rate of shelter use among non-permanent residents (asylum seekers and visa holders) increased fourfold between 2021 (3.9 per 10,000 population) and 2023 (15.0 per 10,000 population).
Point-in-Time Count results: History of experience as a newcomer
- Although newcomers represented approximately 13% of The Point-in-Time (PiT) count survey respondents, a higher proportion were experiencing homelessness in temporary accommodations such as programs that provide shelter in motels or hotels. Among those staying in these locations, 29% indicated they came to Canada as immigrants, resettled refugees, or asylum seekers during the PiT counts.
- PiT count surveys revealed that asylum seekers had a significantly higher proportion of women compared to other groups, with 47.2% of asylum seekers being female.
- Based on the PiT count surveys, most respondents who came as immigrants, resettled refugees, or asylum seekers experienced homelessness for the first time after arriving in Canada. Specifically, 87.9% of immigrants and 77.8% of refugees reported their first experience of homelessness occurring after their arrival. Those who came as asylum seekers were most likely to experience homelessness for the first time within a year of their arrival (43.5%), compared to those who came as resettled refugees (15.4%) and immigrants (6.5%).
Appendix A: Glossary of Terms Footnote 20 Footnote 21
- Permanent resident
- a person who has been granted permanent resident status in Canada. The person may have come to Canada as an immigrant or as Protected Person, including resettled refugees. Permanent residents who become Canadian citizens are no longer permanent residents.
- Immigrant
- a person who has voluntarily settled permanently in another country.
- Resettled refugee
- a refugee who has been selected as a person who is eligible for refugee protection by Canada while still outside Canada and arrive in Canada with a Permanent Resident Visa. Refugees resettled to Canada are determined to be refugees by the Canadian government (whereas asylum seekers receive a determination in Canada).
- Protected person
- according to Canada's Immigration and Refugee Protection Act, a person who has been determined by Canada to be either
- a Convention Refugee; A person who is unable to return to their country because of a well-founded fear of persecution for reasons of race, religion, nationality, membership in a particular social group or political opinion. or;
- a person in need of protection; A person who, if returned to their country would face danger of torture, risk to their life or risk of cruel and unusual treatment or punishment.
- Non-permanent resident
- a person who has been granted temporary resident status in Canada or has not yet been granted permanent resident status, that is persons who have temporary resident status as a foreign student or worker.
- Asylum seeker
- a person who is seeking asylum while in Canada. An asylum seeker is a person who has left their country and is seeking protection from persecution and serious human rights violations, but who hasn't yet been legally recognized as a refugee by Canada and is waiting to receive a decision on their claim.
- Visa holder
- a person who has obtained a permit to reside temporarily in Canada for the purposes of work, study, or visiting.
Report a problem on this page
- Date modified: