Homelessness Data Snapshot: The National Shelter Study 2023 Update
On this page
- Introduction
- Data
- Shelter use in 2023
- Demographics
- Chronic homelessness among shelter users
- For more information
Introduction
The National Shelter Study is an ongoing analysis of trends in homeless shelter use in Canada. The present report provides an update on trends in 2023.
Data
This analysis covers the period from 2005 to 2023 and uses data collected from:
- the Homeless Individuals and Families Information System (HIFIS), and
- provincial and municipal partners that have data sharing agreements with the Government of Canada.
Approximately 50% of emergency shelters in Canada were included in this analysis, representing about 70% of available emergency shelter beds. The methodology takes into account people who use more than one shelter to ensure that individuals are only counted once. Domestic violence shelters, immigrant and refugee shelters, and transitional housing are not included due to insufficient data coverage.
Shelter use in 2023
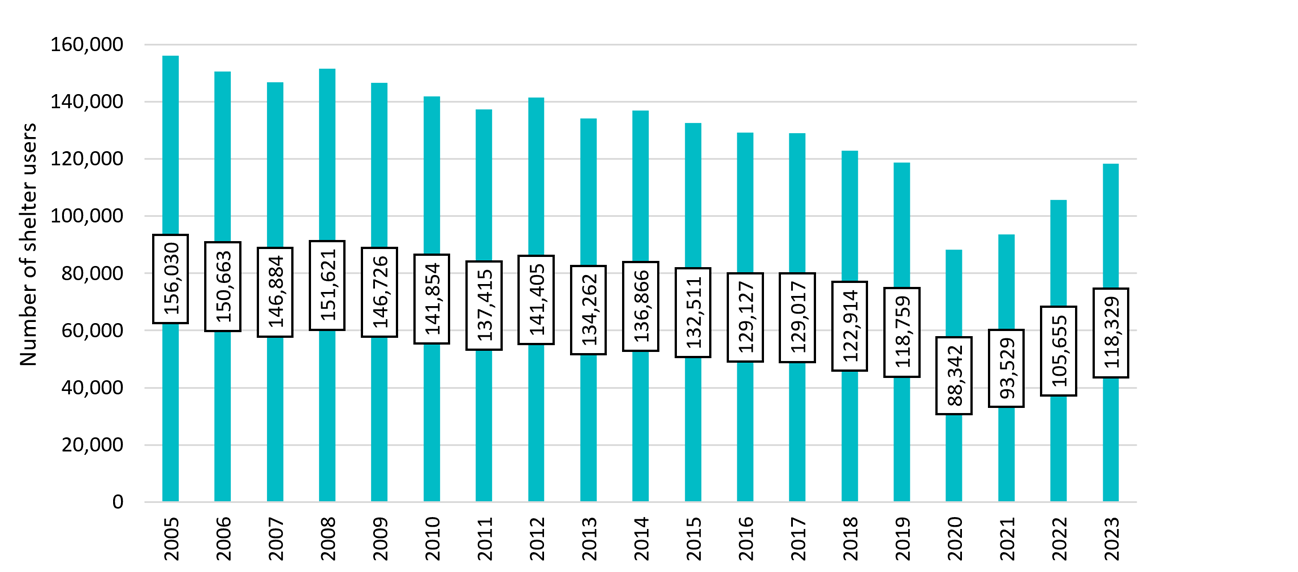
In 2023, an estimated 118,329 people experienced homelessness in an emergency shelter, compared to 105,655 in 2022 (Figure 1). There was a gradual recovery from 2020 to 2023 in shelter use following a dramatic drop at the start of the Covid-19 pandemic. The number of shelter users in 2023 was on par with what we were seeing in 2019 pre-pandemic (118,759). On an average night in 2023, there were approximately 16,627 people staying in shelters, compared to 16,248 in 2022 (2.3% increase).
Figure 1: Number of shelter users from 2005 to 2023
-
Figure 1 - Text version
Figure 1. Number of shelter users from 2005 to 2023 Year Number of shelter users 2005 156,030 2006 150,663 2007 146,884 2008 151,621 2009 146,726 2010 141,854 2011 137,415 2012 141,405 2013 134,262 2014 136,866 2015 132,511 2016 129,127 2017 129,017 2018 122,914 2019 118,759 2020 88,342 2021 93,529 2022 105,655 2023 118,329
Shelter capacity and occupancy
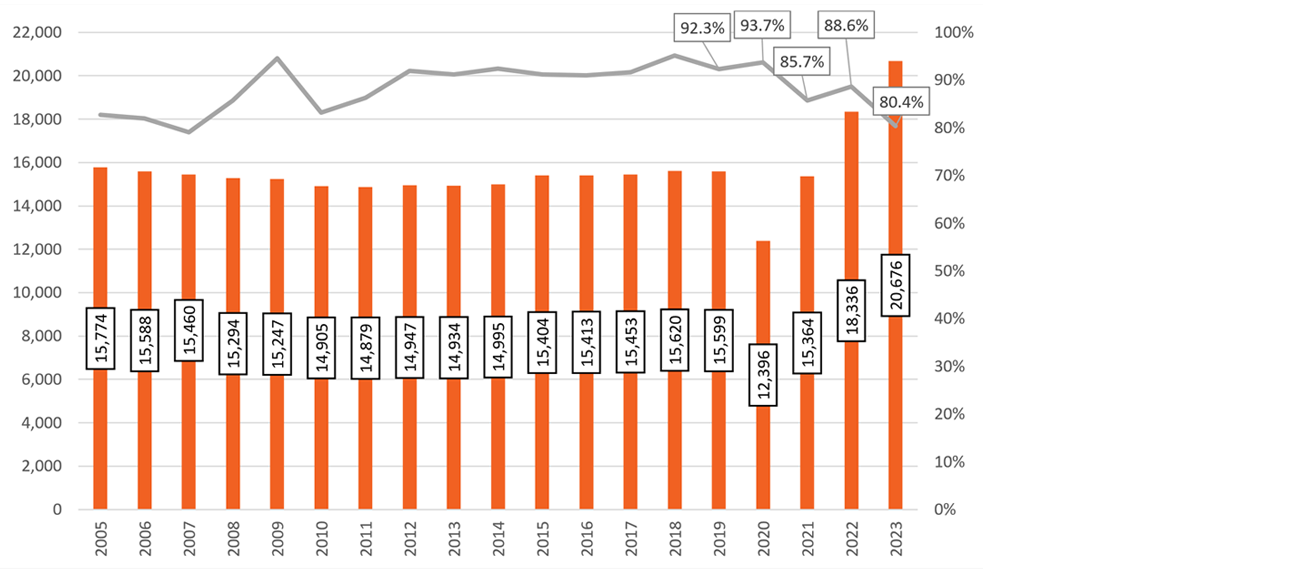
The overall permanent emergency shelter system capacity grew by almost 13% between 2022 and 2023. In 2023 there were 20,676 permanent beds compared to 18,336 beds in 2022 (Figure 2). However, growth was uneven across shelter types. Family shelter capacity increased 14.4%, adult shelter capacity increased 11.4% and youth shelter capacity increased by 23.5% compared to 2022. For overall trends on shelter capacity in Canada, please refer to the 2023 Shelter Capacity Report.
Shelter occupancy dropped significantly between 2022 (88.6%) and 2023 (80.4%).
Figure 2: Beds available and average occupancy from 2005 to 2023
-
Figure 2 - Text version
Figure 2. Bednights and occupancy from 2005 to 2023 Year Average occupancy rate Beds available 2005 82.7% 15,774 2006 82.0% 15,588 2007 79.1% 15,460 2008 85.7% 15,294 2009 94.6% 15,247 2010 83.2% 14,905 2011 86.3% 14,879 2012 91.9% 14,947 2013 91.2% 14,934 2014 92.4% 14,995 2015 91.2% 15,404 2016 91.0% 15,413 2017 91.7% 15,453 2018 95.2% 15,620 2019 92.3% 15,599 2020 93.7% 12,396 2021 85.7% 15,364 2022 88.6% 18,336 2023 80.4% 20,676
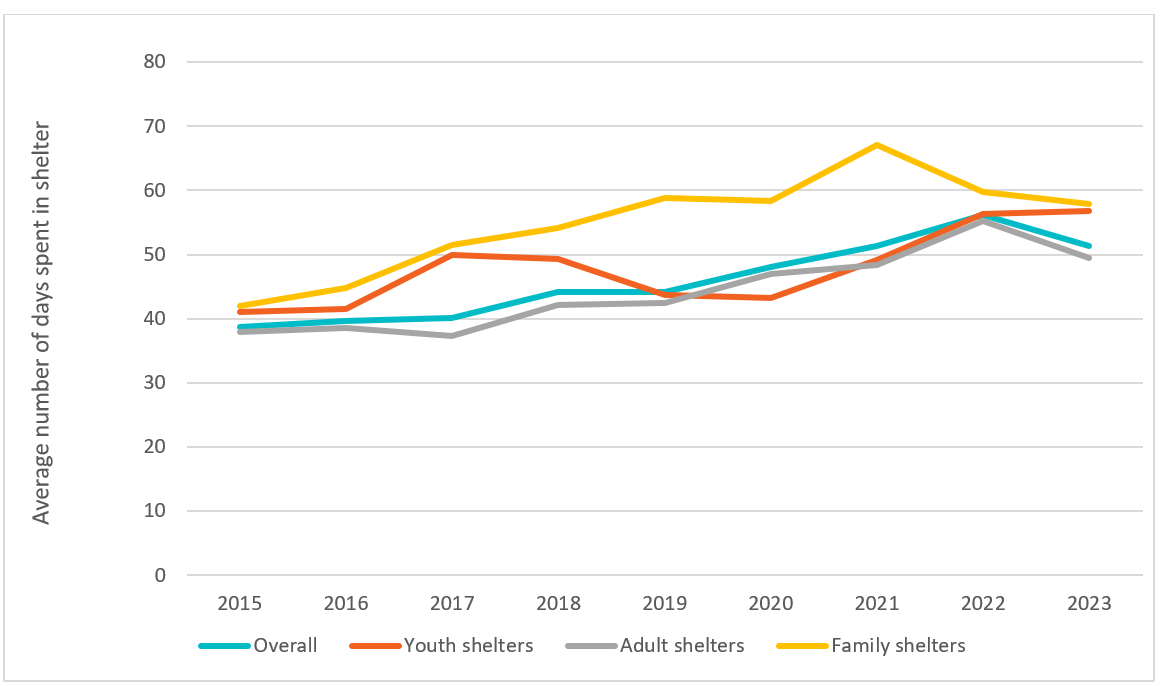
The lower occupancy rate in 2023 was driven by both an increased number of beds and slightly shorter stays among adult shelter users (Figure 3), though youth shelter stays remained consistent. In 2015, the average shelter stay among all shelter users was 38.7 days. The average stay had climbed to 56.1 days in 2022 and dropped down to 51.3 days in 2023.
Figure 3: Average length of stay per calendar year 2015 to 2023 by shelter type
-
Figure 3 - Text version
Figure 3. Average Length of Stay 2015 to 2023 Year Overall Youth shelters Adult shelters Family shelters 2015 38.7 41.1 37.9 41.9 2016 39.7 41.5 38.6 44.8 2017 40.1 50.0 37.3 51.5 2018 44.2 49.3 42.2 54.2 2019 44.2 43.7 42.4 58.8 2020 48.0 43.2 47.0 58.3 2021 51.4 49.1 48.4 67.1 2022 56.1 56.4 55.2 59.8 2023 51.3 56.8 49.5 57.8
Demographics
Age
The average age of shelter users in 2023 was 39.3 years. Accompanied children (aged 0-16) represented 3.5% of shelter users. Youth (aged 13-24) made up 11.9% of shelter users. The majority (61.3%) of shelter users were adults (aged 25-49). Older adults (aged 50-64) were 19.2% of the shelter user population and seniors (aged 65+) were 4.2%. The relative proportions of all age groups have remained relatively unchanged since 2015 with the exception of youth, which has dropped steadily from 17.9% in 2015 to 11.9% in 2023.
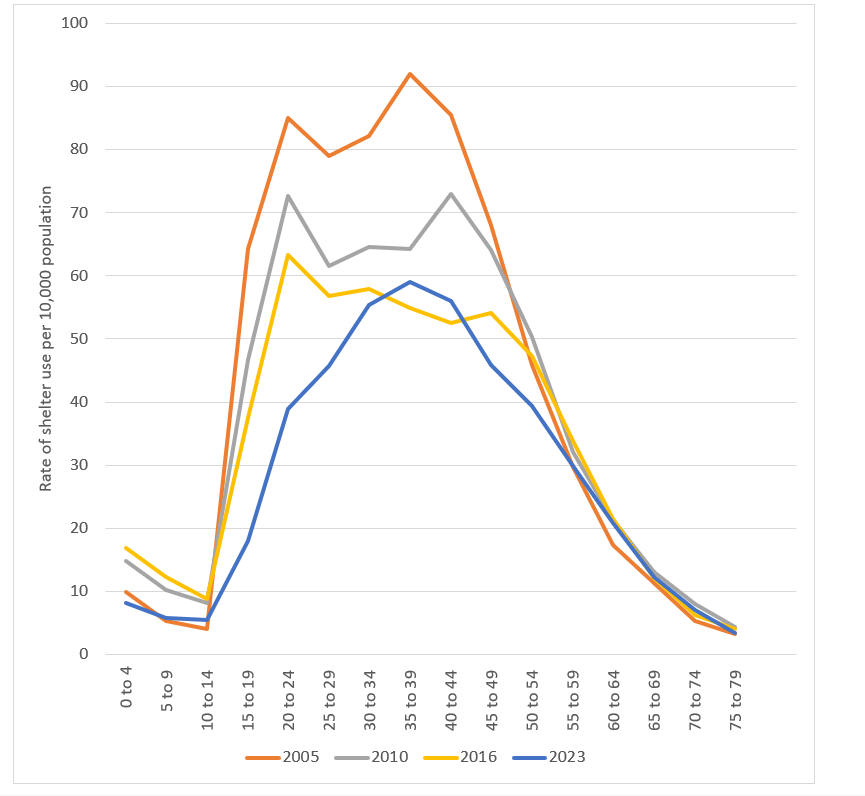
While the relative proportion in most age groups has remained steady since 2015, the overall rate of shelter use per 10,000 population has dropped significantly over time for most age groups (Figure 4). The largest rate decrease between 2005 and 2023 was seen among youth between the ages of 15 and 19 (-46.3), 20 to 24 (-46.0), and 25 to 29 (-33.2). Rates for adults aged 30 to 49 also decreased significantly over this time period (a rate decrease between -22.2 and -33.0). Rates have not changed significantly between 2005 and 2023 for children under the age of 14 or older adults over the age of 55.
Figure 4 shows a small trend reversal between 2016 and 2023 among the 35 to 39 (+4.1) , and 40 to 44 (+3.4) age groups, where there was a slight increase in rates of shelter use.
It also appears that the overall pattern of shelter use rates is shifting over time. In years prior to 2023, there were rate peaks among the 20 to 24 age group. There was also a cohort effect showing another peak among those who were 35 to 39 in 2005, 40 to 44 in 2010 and 45 to 49 in 2016. In contrast, the 2023 rates follow a more normal distribution with the peak occurring among those aged 35 to 39.
Figure 4: Rate of shelter use per 10,000 population by age group (2005, 2010, 2016, 2023)
-
Figure 4 - Text version
Figure 4. Rate of shelter use per 10,000 population by age group (2005, 2010, 2016, 2023) Age Group 2005 2010 2016 2023 0 to 4 9.8 14.8 16.9 8.2 5 to 9 5.4 10.3 12.3 5.8 10 to 14 4.1 8.2 8.8 5.5 15 to 19 64.2 46.6 37.5 17.9 20 to 24 85.0 72.6 63.3 39.0 25 to 29 78.9 61.6 56.7 45.7 30 to 34 82.1 64.6 57.9 55.3 35 to 39 92.0 64.3 54.9 59.0 40 to 44 85.5 73.0 52.6 56.0 45 to 49 68.1 64.1 54.2 45.9 50 to 54 45.9 50.4 47.3 39.4 55 to 59 29.7 32.1 33.8 29.8 60 to 64 17.3 21.2 21.4 20.8 65 to 69 11.4 13.1 12.1 12.3 70 to 74 5.4 8.1 6.3 7.1 75 to 79 3.2 4.3 4.0 3.5
Gender
In 2023, 67.8% of shelter users were men, 31.1% were women, and 1.1% identified as gender diverse. The proportion of men and women has remained statistically unchanged between 2015 and 2023. A statistically significant increase in the proportion of shelter users reporting as gender diverse was observed between 2015 (0.5%) and 2021 (1.1%) and it has remained stable since.
Indigenous Peoples
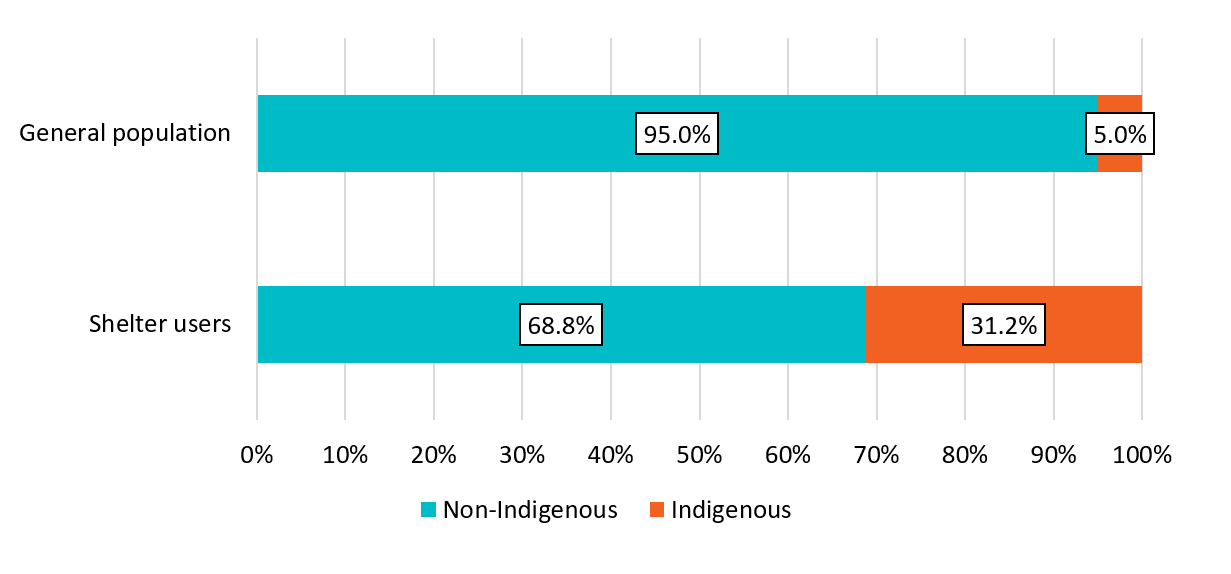
Indigenous Peoples continued to be overrepresented in Canada's emergency shelters in 2023. According to the 2022 census, Indigenous Peoples represent about 5.0% of the Canadian population, yet the percentage of shelter users in 2023 who identified as Indigenous was 31.2% (Figure 5). The proportion of Indigenous Peoples among shelter users has not changed significantly since 2015 (31.2%).
Figure 5: Proportion of shelter-using population and general population by Indigenous identity (2023)
-
Figure 5 - Text version
Figure 5. Proportion of shelter-using population and general population by Indigenous status Population Non-Indigenous Indigenous Shelter users 68.8% 31.2% General population 95.0% 5.0%
Veterans
An estimated 1.2% of shelter users in 2023 reported serving as either Canadian Armed Forces, former RCMP, Veterans of allied countries, or civilian Veterans. This is consistent with the estimated overall proportion of Veterans in Canada (1.7%). The proportion of Veterans has dropped slightly since 2015 (1.9%) but the change is not statistically significant.
Citizenship
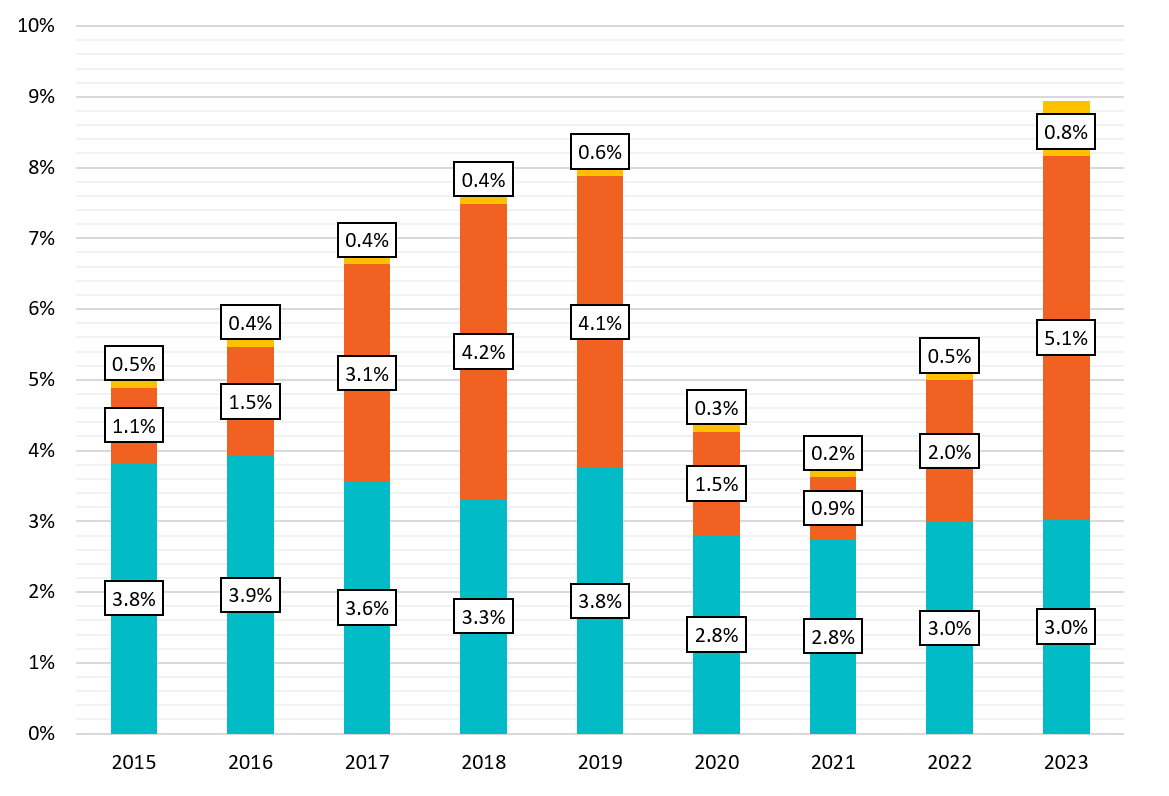
In 2023, the majority (87.3%) of shelter users were Canadian citizens, which has been the case for all years of analysis since 2015. The proportion of refugees and refugee claimants in the shelter system was 5.1% in 2023, up from 2022 (2.0%). Pandemic travel restrictions in 2020 and 2021 may have contributed to a decrease in the number of asylum claims, with a recovery throughout 2022 and 2023 (Figure 6).
Figure 6: Proportion of non-citizens among shelter using population from 2015 to 2023
-
Figure 6 - Text version
Figure 6. Proportion of non-citizens among shelter using population from 2015 to 2023 Year Permanent Residents / Immigrants Refugee and Refugee Claimants Visa Holders 2015 3.8% 1.1% 0.5% 2016 3.9% 1.5% 0.4% 2017 3.6% 3.1% 0.4% 2018 3.3% 4.2% 0.4% 2019 3.8% 4.1% 0.6% 2020 2.8% 1.5% 0.3% 2021 2.8% 0.9% 0.2% 2022 3.0% 2.0% 0.5% 2023 3.0% 5.1% 0.8%
Chronic homelessness among shelter users
In 2023, data from a subset of 24 communities were used to estimate chronic homelessness in CanadaFootnote 1. Shelter users are considered chronically homeless if they meet at least one of the following criteria:
- Acute chronicity: used a shelter for six months (180 days) or more in the past year
- Prolonged instability: had shelter stays in each of the last three years
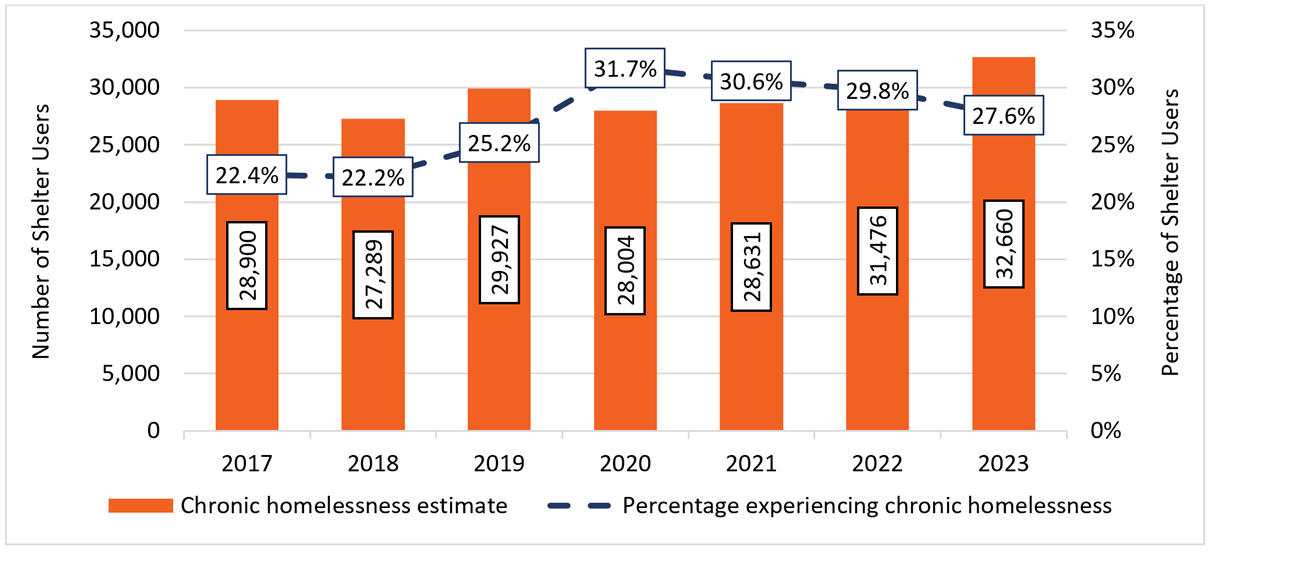
In 2023, 27.6% of shelter users in the sample met one or both criteria for chronic homelessness, a decrease from 29.8% in 2022. However, applying this proportion to the national estimate of shelter users suggests that approximately 32,660 individuals experienced chronic homelessness in 2023, representing a 4.4% increase from 2022 (31,476) (Figure 7).
Figure 7: Proportion and estimated number of chronic shelter users from 2017 to 2023
-
Figure 7 - Text version
Figure 7. Proportion and estimated number of chronic shelter users from 2017 to 2023 Year Percentage experiencing chronic homelessness Chronic homelessness estimate 2017 22.4% 28,900 2018 22.2% 27,289 2019 25.2% 29,927 2020 31.7% 28,004 2021 30.6% 28,631 2022 29.8% 31,476 2023 27.6% 32,660
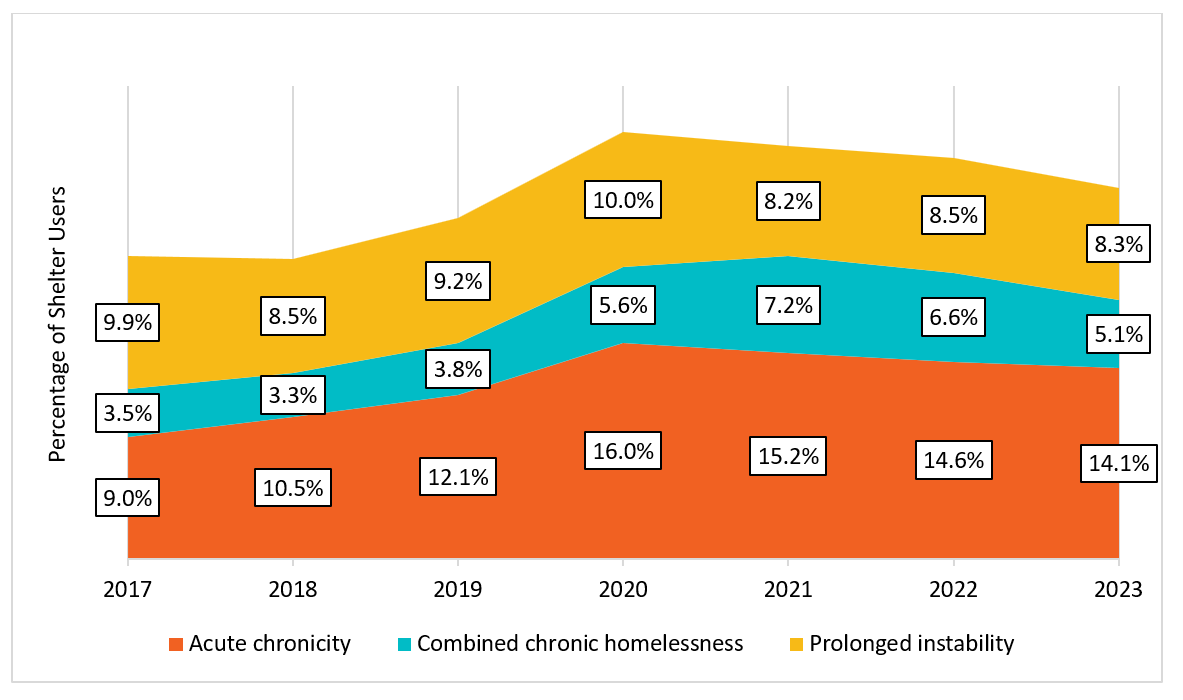
Focusing specifically on shelter users who met the criteria for chronic homelessness, 14.1% met the criteria for acute chronicity only, 8.3% for prolonged instability only, and 5.1% met the criteria for both types of chronic homelessness (Figure 8).
From 2017 to 2020, the proportion of shelter users who met only the acute chronicity indicator increased from 9.0% to 16.0%, before falling slightly to 14.6% in 2022, and further to 14.1% in 2023.
The proportion of those who experienced prolonged instability has fluctuated over time, ranging between 8.2% and 10.0%.
The proportion of shelter users who experienced both types of chronic homelessness was stable between 2017 and 2019 (from 3.5% to 3.8%), but increased to 7.2% in 2021. This figure has since decreased to 5.1% in 2023.
Figure 8: Acute chronicity and prolonged instability from 2017 to 2023
-
Figure 8 - Text version
Figure 8. Acute chronicity and prolonged instability from 2017 to 2023 Year Acute chronicity Combined chronic homelessness Prolonged instability Total chronic homelessnessFootnote 2 2017 9.0% 3.5% 9.9% 22.4% 2018 10.5% 3.3% 8.5% 22.2% 2019 12.1% 3.8% 9.2% 25.2% 2020 16.0% 5.6% 10.0% 31.7% 2021 15.2% 7.2% 8.2% 30.6% 2022 14.6% 6.6% 8.5% 29.8% 2023 14.1% 5.1% 8.3% 27.6%
For more information
To find out more about homelessness research, visit the Data analysis, reports and publications page.
If you have any questions about this report, contact us.
Copyright
© 2024 HIS MAJESTY THE KING IN RIGHT OF CANADA as represented by the Minister of Housing, Infrastructure and Communities.
Catalogue No. T94-60/1-2024E-PDF
ISBN: 978-0-660-74351-6
Report a problem on this page
- Date modified:
