
Homelessness data snapshot: Analysis of chronic homelessness among shelter users in Canada 2017 - 2023
-
Copyright
Aussi disponible en français sous le titre :
Aperçu des données sur l’itinérance : Analyse de l’itinérance chronique parmi les personnes utilisant des refuges au Canada de 2017 à 2023Information contained in this publication or product may be reproduced, in part or in whole, and by any means, for personal or public non-commercial purposes without charge or further permission, unless otherwise specified. Commercial reproduction and distribution are prohibited except with written permission from Housing, Infrastructure and Communities Canada.
For more information, contact:
Housing, Infrastructure and Communities Canada
180 Kent Street, Suite 1100
Ottawa, Ontario K1P 0B6
info@infc.gc.ca© His Majesty the King in Right of Canada, as represented by the Minister of Housing, Infrastructure and Communities, 2025.
Cat. No. T94-60/5-2025E-PDF
ISBN 978-0-660-75295-2
On this page

- Introduction
- Data
- Research findings
- Demographic analysis
- Key findings
- For more information
- Annex: Comparison of acute chronicity and prolonged instability within each population
Introduction
Chronic homelessness generally refers to long periods of homelessness that are associated with greater risks of harm and difficulty accessing stable housing. Experiences of chronic homelessness are often compounded by challenges related to mental illness, substance use, or disabilities. For many communities, preventing and reducing chronic homelessness is a priority.
This report provides an estimate and overview of chronic homelessness in Canada between 2017 and 2023. It also includes a demographic analysis of chronic homelessness in 2023, identifying the relative prevalence across specific populations.
Data
The national definition of chronic homelessness is inclusive of experiences of homelessness that occur in sheltered and unsheltered areas, as well as experiences of hidden homelessness. It includes individuals who are currently experiencing homelessness and who meet at least one of the following criteria:
- They have a total of at least six months (180 days) of homelessness over the past year, or
- They have recurrent experiences of homelessness over the past three years, with a cumulative duration of at least 18 months (546 days).
To estimate chronic homelessness at a national level, an indicator is used based on shelter use patterns. While this excludes experiences of homelessness that occur outside of the shelter systemFootnote 1, shelter use is the most consistent and reliable source of data available for analyzing homelessness trends over time. The chronic homelessness indicator differs from the national definition to account for limitations in the available data. Without longitudinal data on experiences of homelessness outside of the shelter system, the indicator relies on shelter data to provide an estimate of how chronic homelessness is changing at the national level. The indicator identifies emergency shelter users as experiencing chronic homelessness if they meet at least one of the following criteria:
- Acute chronicity: used a shelter for six months (180 days) or more in the past year, or
- Prolonged instability: accessed shelters at least once in each of the last three years.
Acute chronicity can be characterized as the experience of recent, persistent homelessness, whereas prolonged instability can be characterized as a longer-term lack of stable housing and repeated or prolonged homelessness. Some individuals exhibit both persistent homelessness within the past year, and recurrent returns to homelessness over the past three years. This exposure to both acute and repeated experiences of protracted homelessness is referred to as combined chronic homelessness.
Therefore, the indicator is able to categorize each shelter user into one of four distinct groups:
- Acute chronicity only,
- Prolonged instability only,
- Combined chronic homelessness (both acute chronicity and prolonged instability), and
- Not chronically homeless.
The national chronic homelessness indicator is calculated using data from communities that have complete coverage of their permanent emergency shelter system for three consecutive years, and annual estimates of national shelter use from the National Shelter Study. The data are collected by service providers and communities using the Homeless Individuals and Families Information System (HIFIS) and through data-sharing partnerships with jurisdictions that use similar systems.
The sample used to estimate chronic homelessness varies annually as the set of communities that meet the eligibility criteria changes. In 2023, the sample included 24 communities that met the data requirements, representing 48.8% of national emergency shelter capacity. This percentage is slightly lower than in 2018 (51.6%, 21 communities), but higher than in other years: 2022 (44.6%, 17 communities), 2021 (39.4%, 17 communities), 2020 (40.3%, 17 communities), 2019 (46.1%, 16 communities), and 2017 (32.7%, 22 communities). While this sample covers a significant portion of shelter user experiences, some regional trends may not be captured.
Research findings
According to the National Shelter Study 2023 Update, an estimated 118,329 people experienced homelessness in an emergency shelter in 2023, up from 105,655 in 2022. Shelter use has steadily increased each year since 2020, the first year of the COVID-19 pandemic, when it saw a significant 25.6% decline. Between 2005 and 2020, the number of shelter users had generally trended downward, with the sharpest drop occurring in 2020. The 2023 figure is comparable to the pre-pandemic estimate from 2019 (118,759).Footnote 2
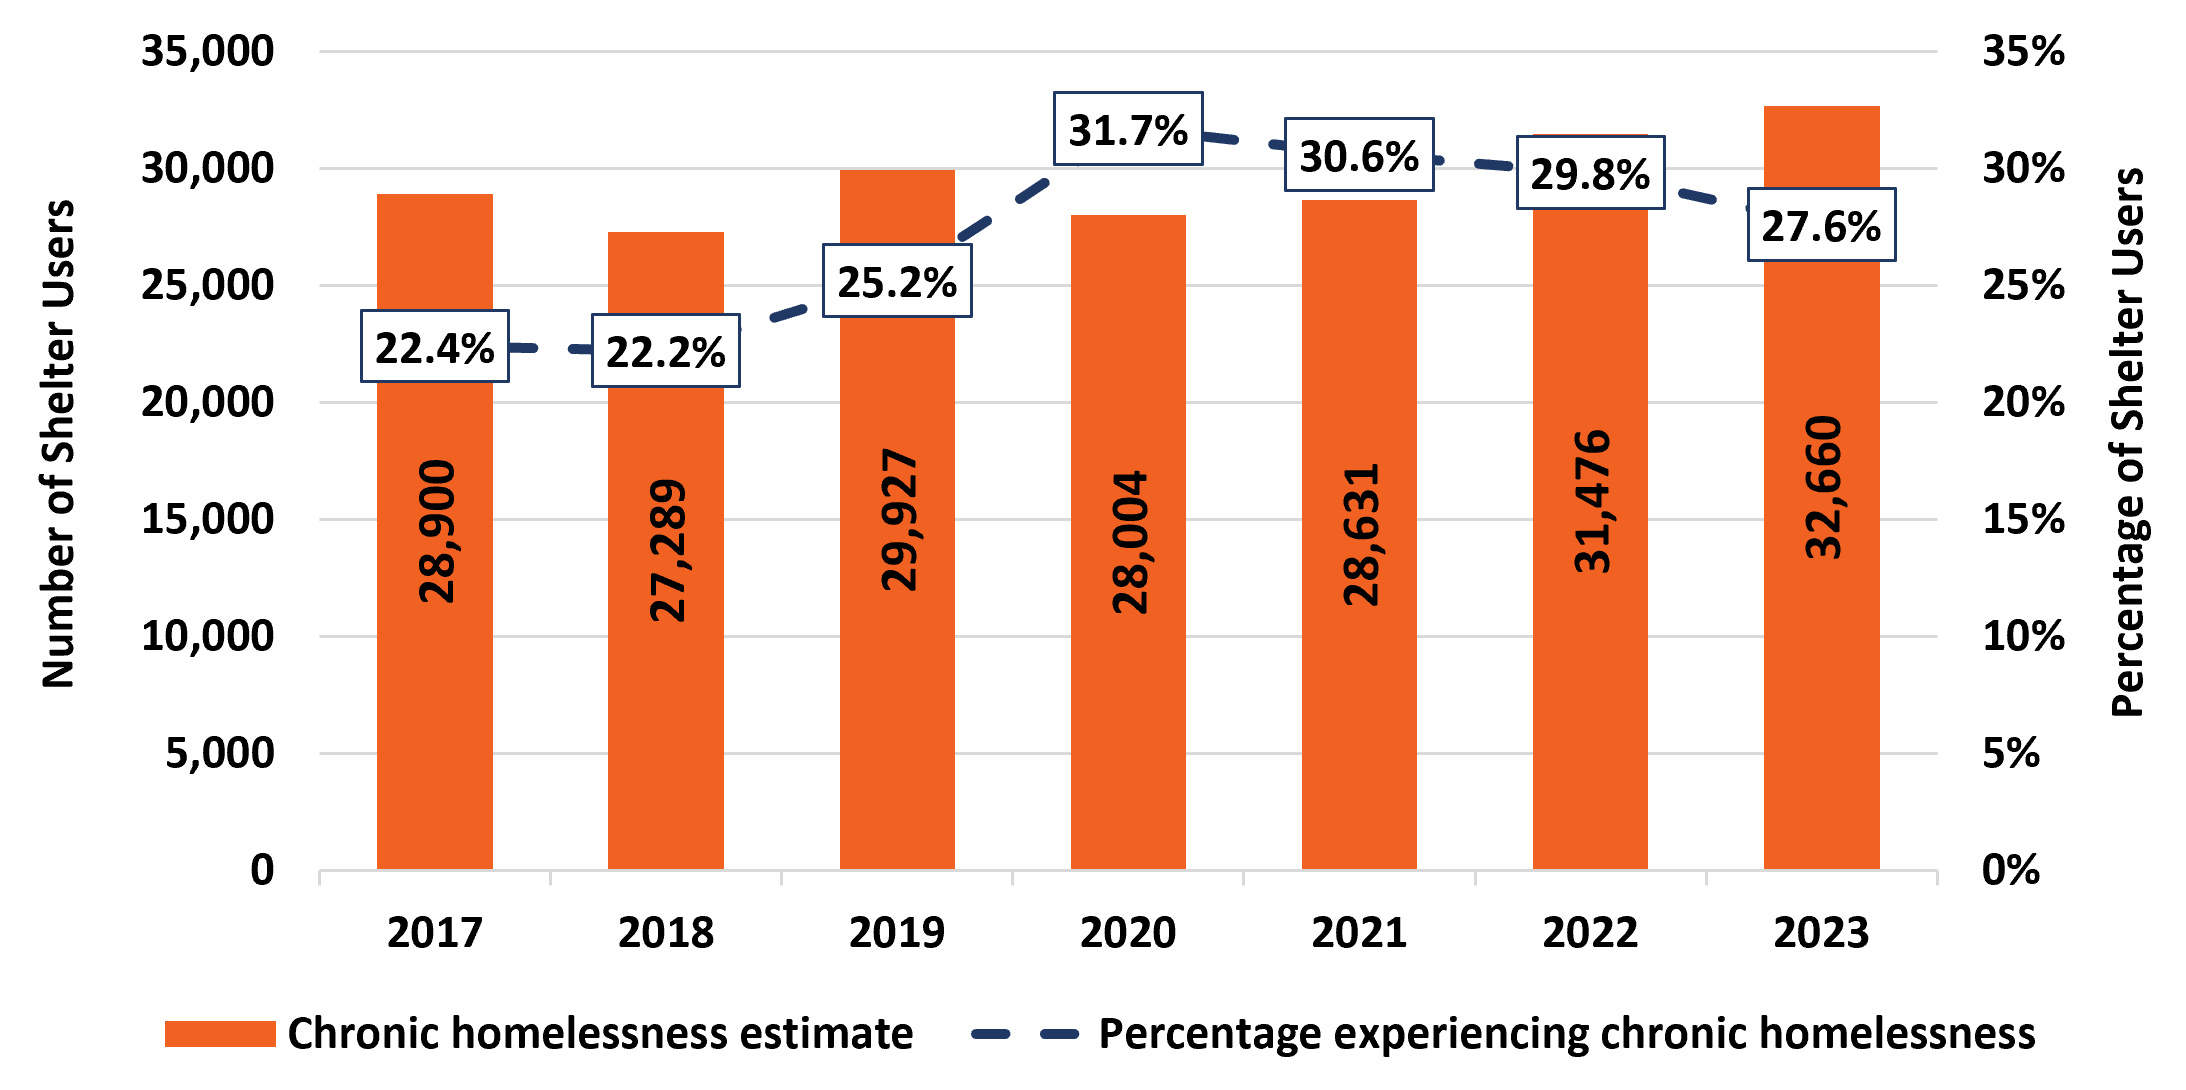
In 2023, an estimated 32,660 (27.6%) people experienced chronic homelessness. This represents an increase in the proportion of shelter users identified as chronically homeless from 2017 (22.4%), but a decrease from 2020 (31.7%) (Figure 1). The estimated number of chronically homeless shelter users remained relatively stable from 2017 (28,900) to 2021 (28,631), but increased in 2022 (31,476) and again in 2023 (32,660). So, while the proportion of shelter users experiencing chronic homelessness is trending downwards, the estimated number is increasing. This is due to an increase in the number of shelter users who were not experiencing chronic homelessness in 2023.
Figure 1: Chronic homelessness from 2017 to 2023
-
Figure 1 - Text version
Figure 1: Chronic homelessness from 2017 to 2023 Year Percentage experiencing chronic homelessness Chronic homelessness estimate 2017 22.4% 28,900 2018 22.2% 27,289 2019 25.2% 29,927 2020 31.7% 28,004 2021 30.6% 28,631 2022 29.8% 31,476 2023 27.6% 32,660
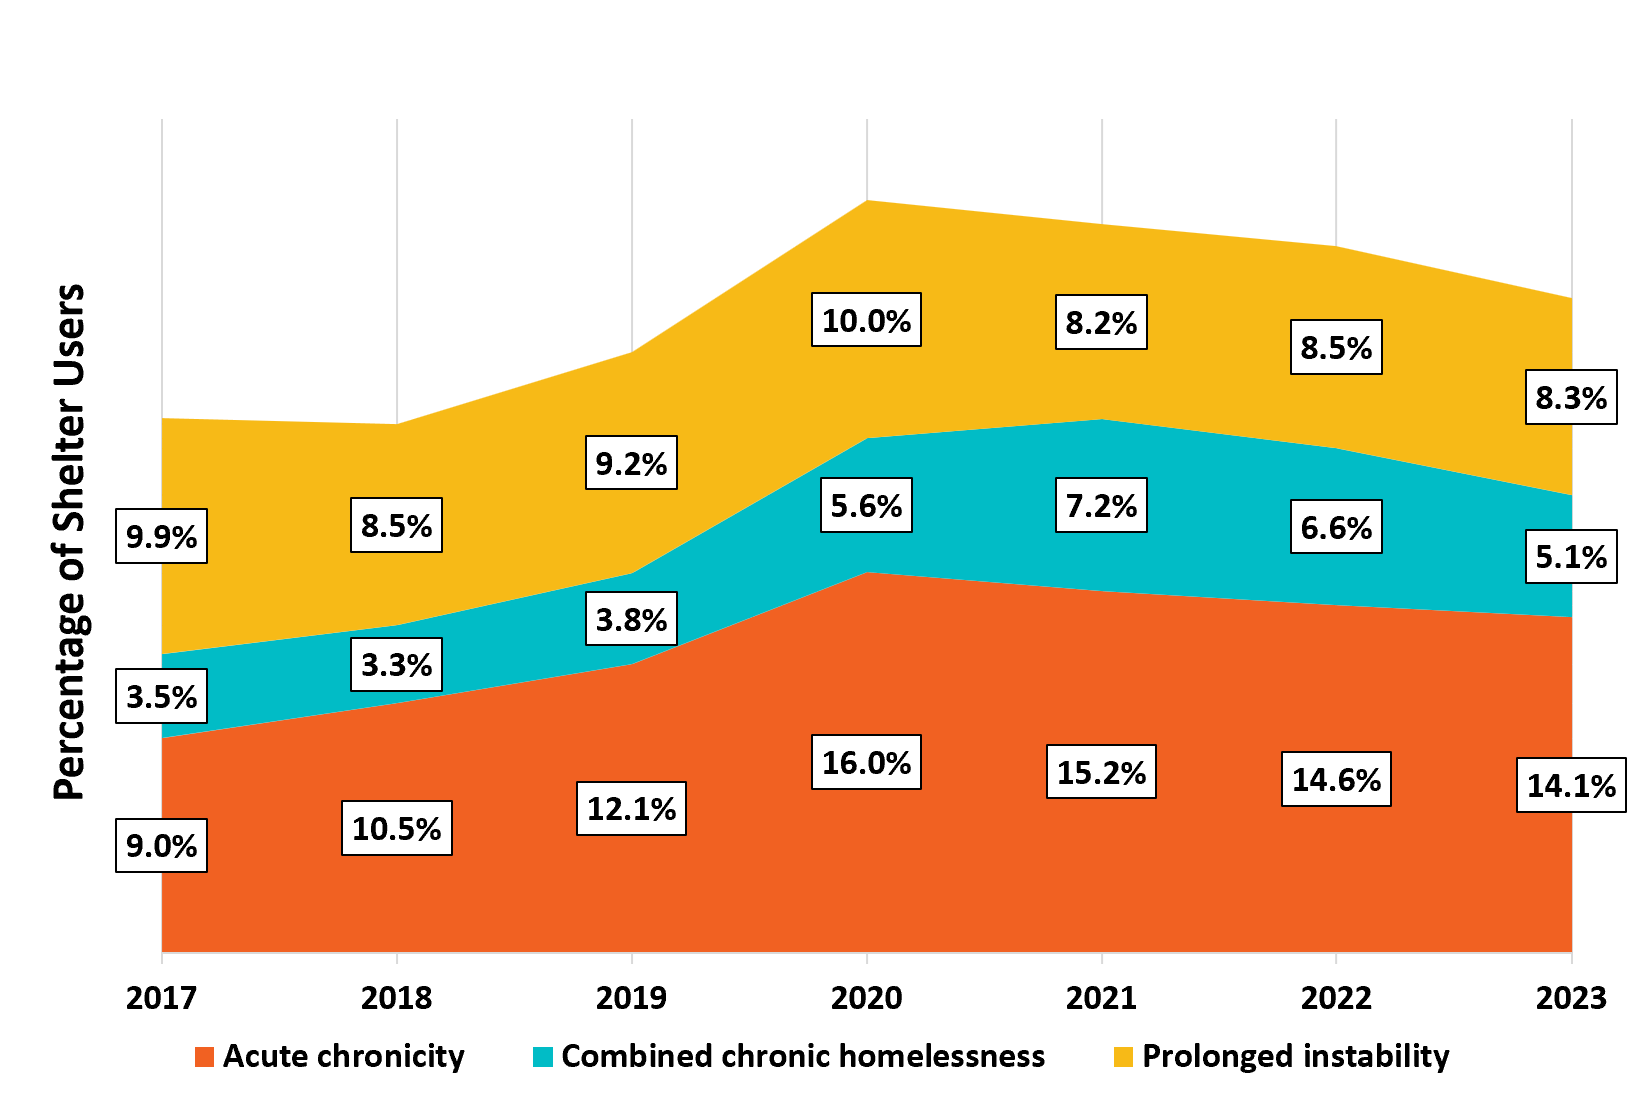
The overall chronic homelessness estimate includes three categories of shelter users: those who meet the acute chronicity criterion, those who meet the prolonged instability criterion, and those who meet both criteria. Between 2017 and 2023, different trends were seen for these three chronic homelessness categories (Figure 2).
- The prevalence of shelter users experiencing acute chronicity increased steadily from 2017 to 2020, and decreased slightly into 2023, dropping from 16.0% in 2020 to 14.1% in 2023.
- The prevalence of shelter users experiencing prolonged instability remained relatively stable from 2017 to 2020, but has remained at a slightly lower level in the years following. In 2023, this proportion was 8.3%.
- The prevalence of shelter users who experienced combined chronic homelessness was relatively stable between 2017 (3.5%) and 2019 (3.8%), before increasing in 2020 (5.6%) and 2021 (7.2%). This prevalence decreased in 2022 to 6.6% and 5.1% in 2023.
Figure 2: Acute chronicity and prolonged instability from 2017 to 2023
-
Figure 2 - Text version
Figure 2: Acute chronicity and prolonged instability from 2017 to 2023 Year Acute chronicity Combined chronic homelessness Prolonged instability Total chronic homelessnessFootnote 3 2017 9.0% 3.5% 9.9% 22.4% 2018 10.5% 3.3% 8.5% 22.2% 2019 12.1% 3.8% 9.2% 25.2% 2020 16.0% 5.6% 10.0% 31.7% 2021 15.2% 7.2% 8.2% 30.6% 2022 14.6% 6.6% 8.5% 29.8% 2023 14.1% 5.1% 8.3% 27.6%
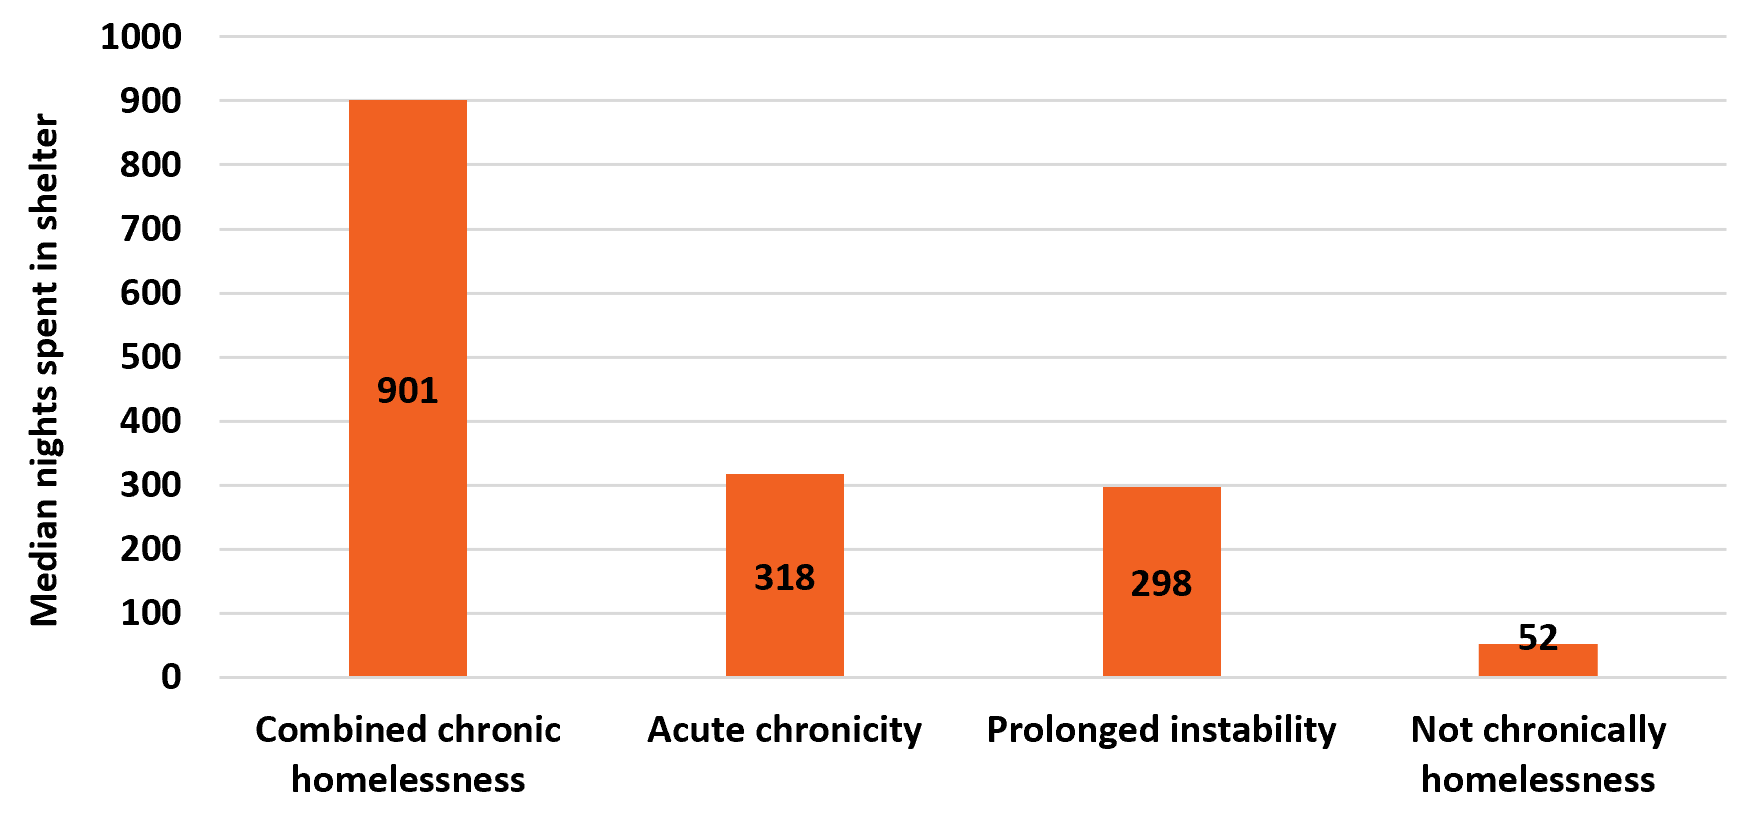
To better understand how chronic homelessness impacts individuals over a longer timescale, shelter use patterns were examined over a 14-year period, from 2010 to 2023, for each chronic homelessness group in 2023 (Figure 3).
- For comparison, shelter users that did not meet any of the criteria for chronic homelessness spent a median of 52 nights in shelter from 2010 to 2023.
- Those experiencing prolonged instability spent a median of 298 nights in shelter from 2010 to 2023.
- Those who experienced acute chronicity spent a median of 318 nights in shelter from 2010 to 2023.
- Those who experienced combined chronic homelessness (meeting both criteria) tended to spend more nights in shelter overall. The median number of nights spent in shelter from 2010 to 2023 was 901 nights, which was nearly three times higher than any other group over this period.
It is notable that the indicator for prolonged instability requires only one stay in shelter per year over three consecutive years, yet the median nights in shelter for this group is similar to the median nights for shelter users experiencing acute chronicity. The difference between the minimum requirement and the median for this group suggests that they tend to experience persistent multi-year housing insecurity.
Figure 3: Median nights spent in shelter from 2010 to 2023
-
Figure 3 - Text version
Figure 3: Median nights spent in shelter from 2010 to 2023 Chronic status Median nights spent in shelter Combined chronic homelessness 901 Acute chronicity 318 Prolonged instability 298 Not chronically homelessness 52
Demographic analysis
Age and chronic homelessness
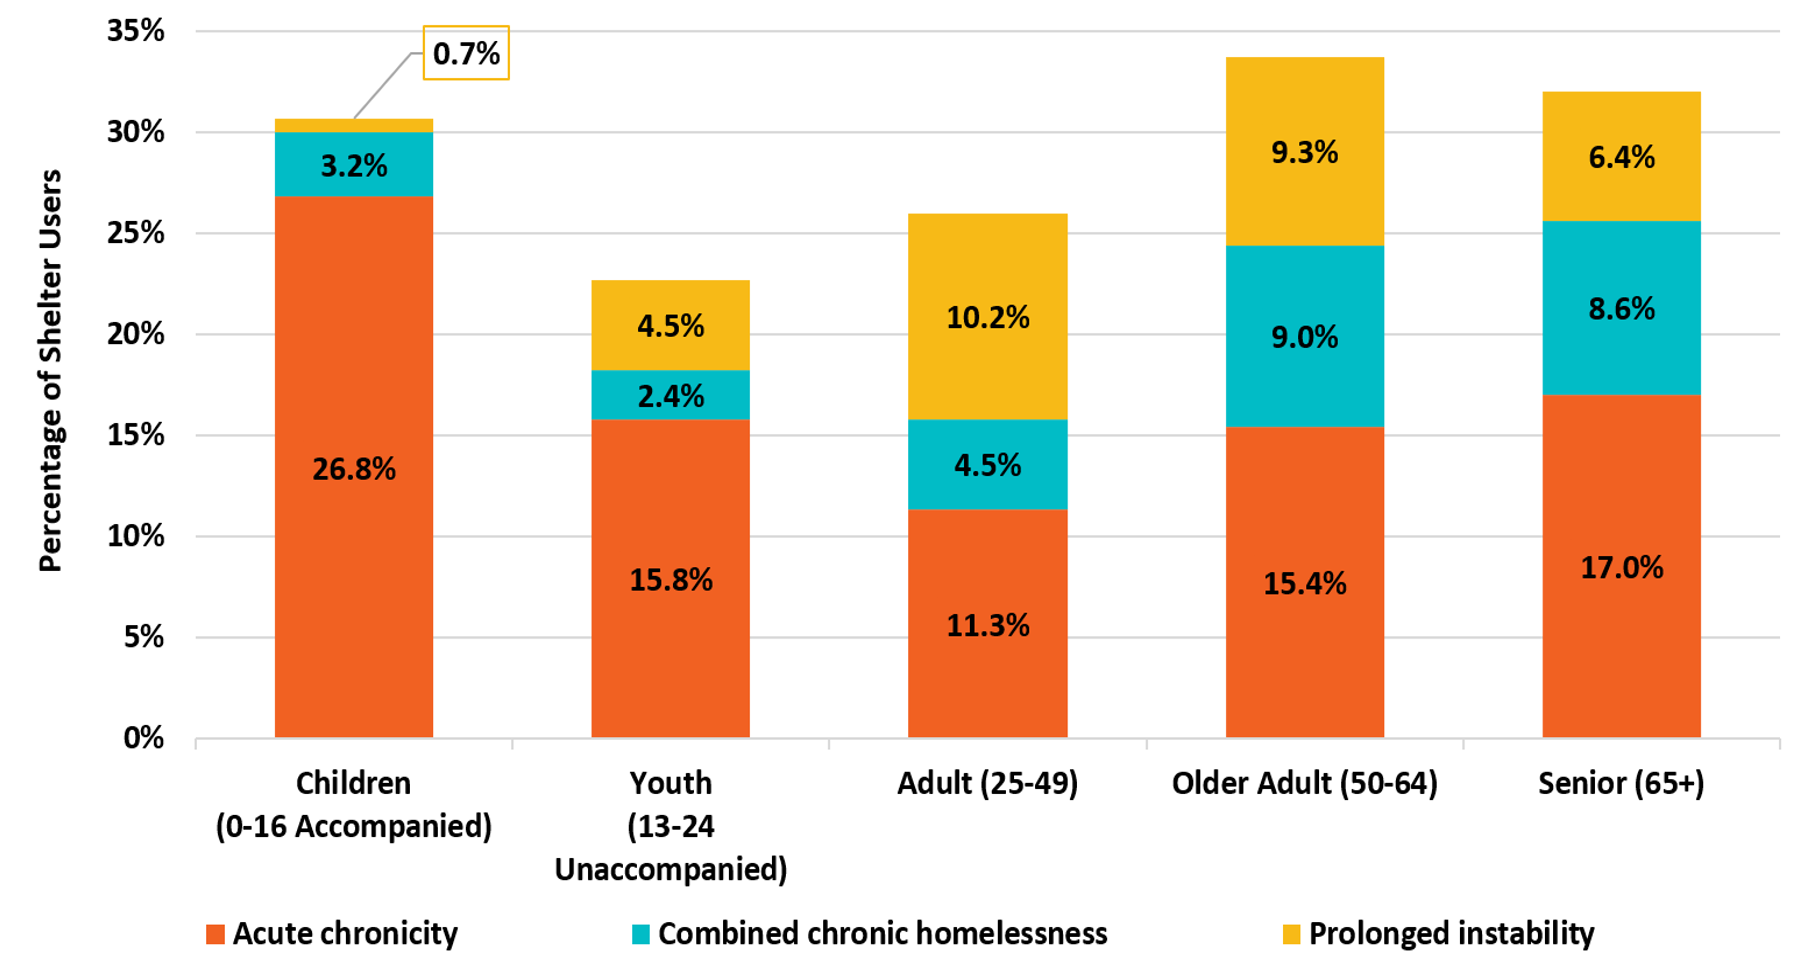
Statistically significant differences were found in patterns of acute chronicity and prolonged instability by different age groups (Figure 4).
- Acute chronicity was highest among accompanied children, while being the lowest among adults.
- Adults and older adults were most likely to experience prolonged instability, followed by older adults, and youth. Accompanied children were the least likely to experience prolonged instability.
- Combined chronic homelessness, which entails intensive and multi-year shelter use, tended to increase with age. This type of chronic homelessness was highest among older adults and seniors, followed by adults. Children and youth had the lowest rates of combined chronic homelessness.
Figure 4: Acute chronicity and prolonged instability by age in 2023
-
Figure 4 - Text version
Figure 4: Acute chronicity and prolonged instability by age in 2023 Age group Acute chronicity Combined chronic homelessness Prolonged instability Total chronic homelessnessFootnote 3 Children
(0-16 Accompanied)26.8% 3.2% 0.7% 30.7% Youth (13-14 Unaccompanied) 15.8% 2.4% 4.5% 22.7% Adult (25-49) 11.3% 4.5% 10.2% 26.0% Older Adult (50-64) 15.4% 9.0% 9.3% 33.7% Senior (65+) 17.0% 8.6% 6.4% 32.1%
Chronic homelessness tended to increase with age. Older adults and seniors had highest rates of chronic homelessness, while unaccompanied youth had the lowest rates. Accompanied children also experienced high rates of chronic homelessness, which may be due to longer stays in family shelters.Footnote 2
Gender and chronic homelessness
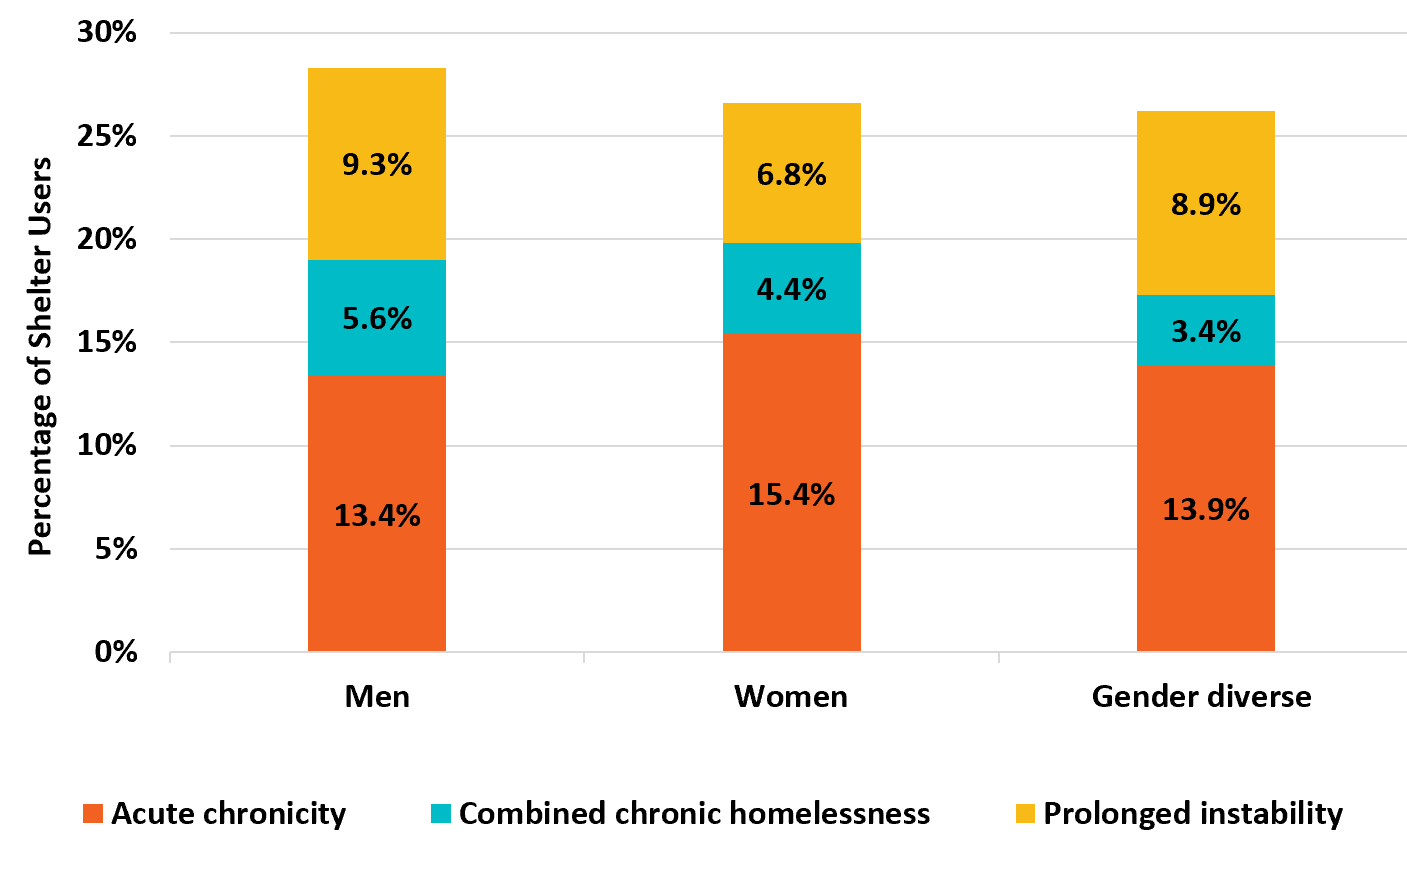
Rates of chronic homelessness also differed across gender groups: 28.3% of men, 26.6% of women, and 26.3% of gender diverse shelter users experienced chronic homelessness.
Statistically significant differences can be seen in patterns of acute chronicity and prolonged instability by different gender groups (Figure 5).
- Men had a higher rate of prolonged instability and combined chronic homelessness.
- Women had a higher rate of acute chronicity.
Figure 5: Acute chronicity and prolonged instability by gender in 2023
-
Figure 5 - Text version
Figure 5: Acute chronicity and prolonged instability by gender in 2023 Gender Group Acute chronicity Combined chronic homelessness Prolonged instability Total chronic homelessnessFootnote 3 Men 13.4% 5.6% 9.3% 28.3% Women 15.4% 4.4% 6.8% 26.6% Gender diverse 13.9% 3.4% 8.9% 26.3%
There was not enough data to detect statistically significant differences for gender diverse shelter users.
Indigenous status and chronic homelessness
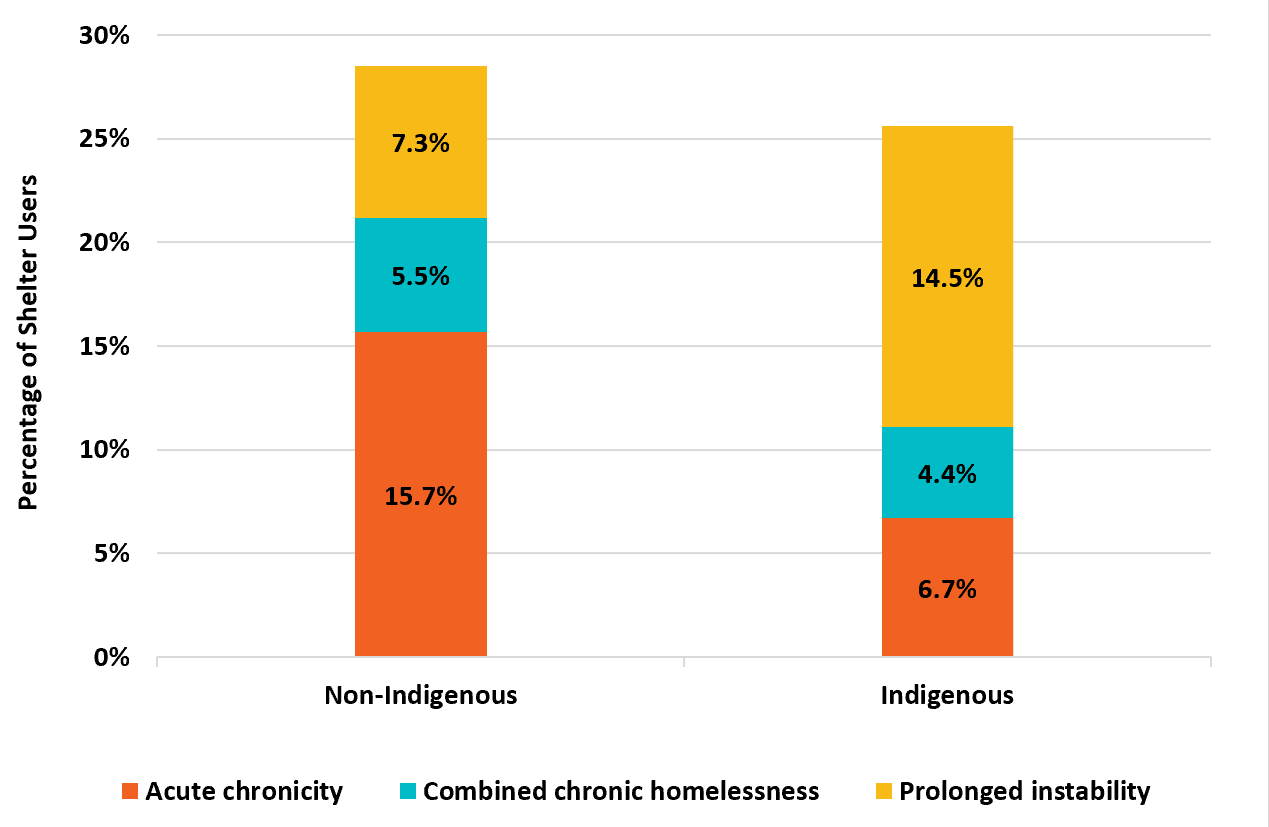
Statistically significant differences were seen in patterns of acute chronicity and prolonged instability (Figure 6).
- Indigenous shelter users had a higher rate of prolonged instability than non-Indigenous shelter users.
- Indigenous shelter users had a lower rate of acute chronicity compared to non-Indigenous shelter users.
Figure 6: Acute chronicity and prolonged instability by Indigenous status in 2023
-
Figure 6 - Text version
Figure 6: Acute chronicity and prolonged instability by Indigenous status in 2023 Indigenous Status Acute chronicity Combined chronic homelessness Prolonged instability Total chronic homelessness Non-Indigenous 15.7% 5.5% 7.3% 28.5% Indigenous 6.7% 4.4% 14.5% 25.6%
Indigenous shelter users had lower chronic homelessness rates compared to those who did not identify as Indigenous. It is important to consider, however, that Indigenous respondents in the 2020-2022 Point-in-Time count of homelessness survey were more likely to be in unsheltered locations, and to indicate that they had not used a shelter in the past year. As a result, their experiences of homelessness may be more likely to be missed by shelter system data, leading to an underestimation of chronic homelessness among Indigenous shelter users.
Veteran status and chronic homelessness
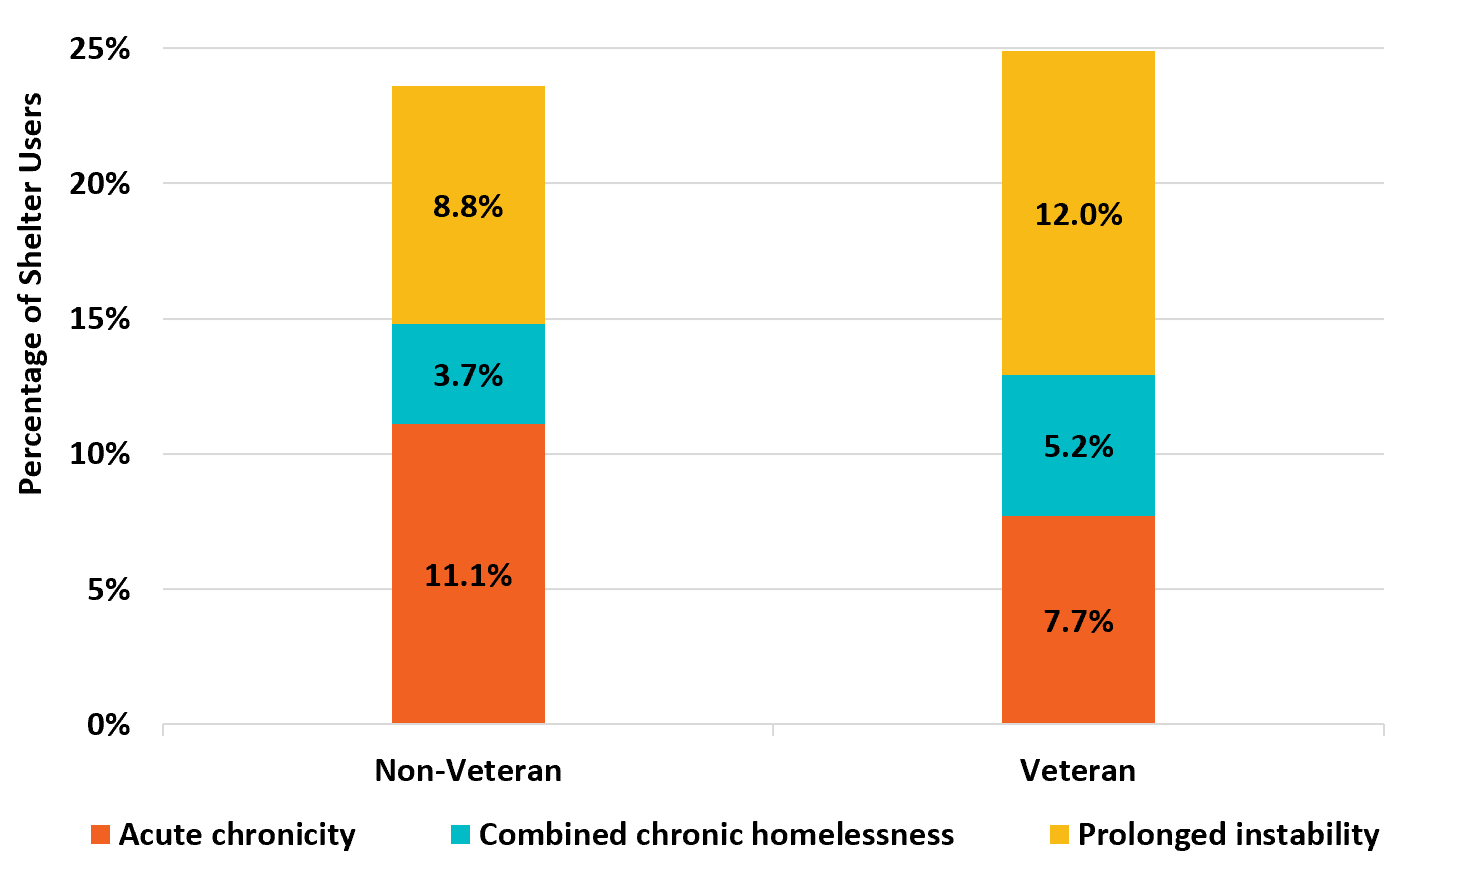
In 2023, the rate of chronic homelessness among shelter users who reported they were veterans (23.6%) was similar to the rate among non-veterans (24.9%).Footnote 4
Statistically significant differences can be seen in patterns of acute chronicity and prolonged instability (Figure 7).
- Veterans had a lower rate of acute chronicity compared to non-veterans.
- Prolonged instability is higher among veterans.
- The rates of combined chronic homelessness was similar among non-veterans and veterans.
Figure 7: Acute chronicity and prolonged instability by veteran status in 2023
-
Figure 7 - Text version
Figure 7: Acute chronicity and prolonged instability by veteran status in 2023 Veteran status Acute chronicity Combined chronic homelessness Prolonged instability Total chronic homelessnessFootnote 3 Non-Veteran 11.1% 3.7% 8.8% 23.6% Veteran 7.7% 5.2% 12.0% 24.9%
Citizenship status and chronic homelessness
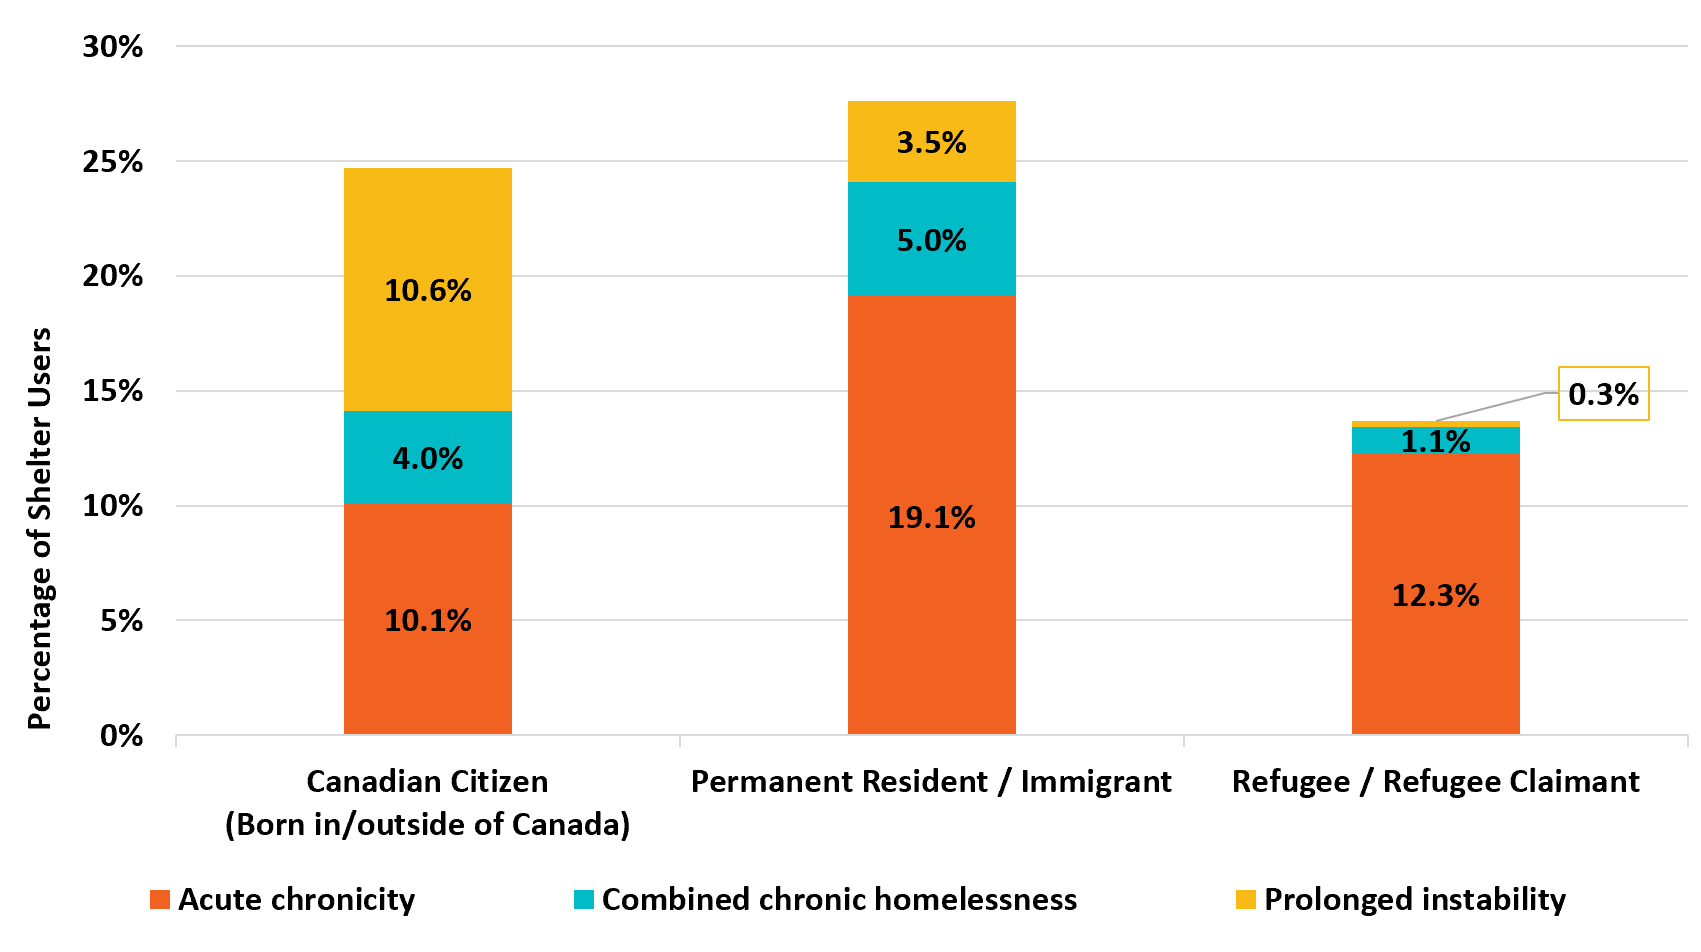
Statistically significant differences can be seen in patterns of acute chronicity and prolonged instability (Figure 8).
- Canadian citizens had a higher rate of prolonged instability compared to non-citizens.
- Permanent Residents/Immigrants, along with Refugees and Refugee Claimants were more likely to experience acute chronicity.
- Canadian citizens and Permanent Residents/Immigrants are more likely to experience combined chronic homelessness compared to Refugees/Refugee Claimants.
Figure 8: Acute chronicity and prolonged instability by citizenship status in 2023
-
Figure 8 - Text version
Figure 8: Acute chronicity and prolonged instability by citizenship status in 2023 Citizenship status Acute chronicity Combined chronic homelessness Prolonged instability Total chronic homelessnessFootnote 3 Canadian Citizen (Born in/outside of Canada) 10.1% 4.0% 10.6% 24.6% Permanent Resident/Immigrant 19.1% 5.0% 3.5% 27.6% Refugee/Refugee Claimant 12.3% 1.1% 0.3% 13.7%
Key findings
- The estimated number of emergency shelter users experiencing chronic homelessness remained relatively stable between 2017 (28,900) and 2021 (28,631), before increasing in 2022 (31,476) and 2023 (32,660). A rebound in shelter use after the COVID-19 pandemic likely contributed to this increase.
- As non-chronic shelter users increased in the post-pandemic period, the proportion of shelter users experiencing chronic homelessness has decreased slightly from 31.7% in 2020 to 27.6% in 2022.
- Acute chronicity among shelter users increased from 9.0% in 2017 to 16.0% in 2020, dropping slightly down to 14.1% in 2023.
- Prolonged instability remained relatively stable from 2017 to 2020, but was slightly lower in the years after. In 2023, it was 8.3%.
- Combined chronic homelessness was stable between 2017 and 2019 (3.5% to 3.8%), reaching its highest in 2021 at 7.2%, decreasing to 5.1% in 2023.
- Demographic findings in 2023 were largely consistent with those observed in 2021:
- Acute chronicity was generally higher among accompanied children (0-16), women, and non-Canadian citizen shelter users.
- Prolonged instability was generally higher among adults (25-49), older adults (50-64), men, Indigenous shelter users, veterans, and Canadian citizens.
A summary table (Table 1) with the estimated rates of chronic homelessness for different groups and a list of the communities included in the analysis are provided in the Annex.
We would like to thank all of the communities and service providers who provided the quality data that made it possible to do complete this analysis and contribute to the understanding of how chronic homelessness is changing over time.
For more information
Find out more about homelessness research.
If you have any questions about this report, contact us.
Annex: Comparison of acute chronicity and prolonged instability within each population
|
Acute chronicity |
Combined chronic homelessness |
Prolonged instability |
OverallFootnote 3 |
|---|---|---|---|---|
Children (0-16 Accompanied) |
26.8% |
3.2% |
0.7% |
30.7% |
Youth (13-24 Unaccompanied) |
15.8% |
2.4% |
4.5% |
22.7% |
Adult (25-49) |
11.3% |
4.5% |
10.2% |
26.0% |
Older Adult (50-64) |
15.4% |
9.0% |
9.3% |
33.7% |
Senior (65+) |
17.0% |
8.6% |
6.4% |
32.1% |
Men |
13.4% |
5.6% |
9.3% |
28.3% |
Women |
15.4% |
4.4% |
6.8% |
26.6% |
Gender diverse |
13.9% |
3.4% |
8.9% |
26.3% |
Non-Indigenous |
15.7% |
5.5% |
7.3% |
28.5% |
Indigenous |
6.7% |
4.4% |
14.5% |
25.6% |
Non-Veteran |
11.1% |
3.7% |
8.8% |
23.6% |
Veteran |
7.7% |
5.2% |
12.0% |
24.9% |
Canadian Citizen |
10.1% |
4.0% |
10.6% |
24.6% |
Permanent Resident/Immigrant |
19.1% |
5.0% |
3.5% |
27.6% |
Refugee/Refugee Claimant |
12.3% |
1.1% |
0.3% |
13.7% |
Report a problem on this page
- Date modified: