2017-18 Departmental Results Report
Analysis of trends in spending and human resources
Actual expenditures
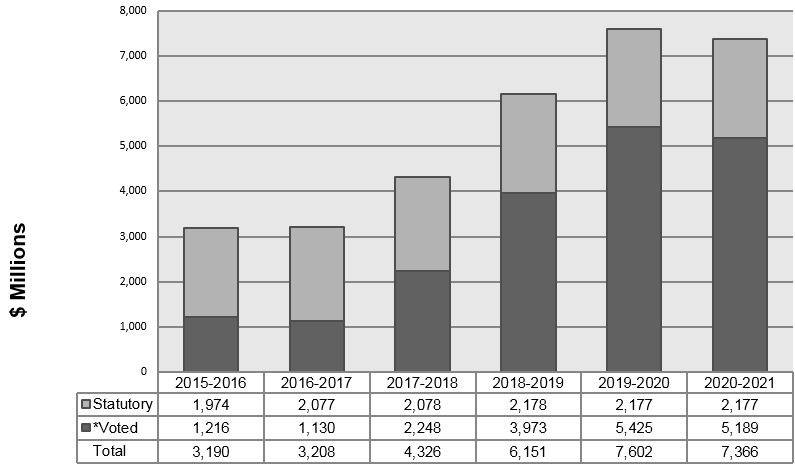
Departmental Spending Trend
In 2017-18, Infrastructure Canada's total spending was over $4.3 billion. Departmental spending experienced a significant increase compared to the previous two years. This trend can be attributed to an increase in spending for the new Champlain Bridge Corridor project to cover the first significant milestone payment, increased spending on contributions for new programs including the Public Transit Infrastructure Fund and the Clean Water and Wastewater Fund, and an increase in operating expenditures related to the overall increase in FTEs.

The *Voted spending was increased significantly in 2017-18 with Infrastructure Canada's implementation of new programming approved as part of the government's long-term infrastructure program.
Text description of graph 1Despite an increase in spending, Infrastructure Canada's reported unspent funds remain high at $2.8 billion. Unused funds at year end is not new for infrastructure programs; the practice is to re-profile amounts to future years when required. Funds remain in place to support approved programs and projects, and no projects are cancelled or unfunded as a result of the re-profile.
Of the $2.8 billion left unspent, $2.7 billion was re-profiled from 2017-18 into future years as announced in Budget 2018. This Budget updated the funding profile for a number of transfer payment programs to better align with when funding recipients plan to submit their payment claims. This ensures that infrastructure funding is available when it is needed. The total federal contribution to projects remains the same.
Infrastructure Canada will continue to work with provinces, territories and central agencies on the timely recording of expenses.
|
Programs and Internal Services |
2017-18 Main Estimates |
2017-18 Planned Spending |
2018-19 Planned Spending |
2019-20 Planned Spending |
2017-18 Total Authorities Available for Use |
2017-18 Actual Spending (Authorities Used) |
2016-17 Actual Spending (Authorities Used) |
2015-16 Actual Spending (Authorities Used) |
|---|---|---|---|---|---|---|---|---|
|
Financement des priorités provinciales et territoriales |
56,608,537 |
56,608,537 |
59,312,122 |
31,608,537 |
22,500,000 |
3,064,280 |
25,078,120 |
|
|
Financement permanent et souple de l’infrastructure publique |
2,074,765,524 |
2,074,765,524 |
2,173,015,976 |
2,173,015,976 |
2,074,732,375 |
2,072,595,796 |
2,102,832,309 |
1,974,387,706 |
|
Investissements dans les priorités liées aux infrastructures nationales |
3,058,211,074 |
3,058,211,074 |
1,787,661,698 |
3,267,878,874 |
3,157,667,575 |
729,280,490 |
164,694,236 |
139,119,440 |
|
Large-Scale Infrastructure Investments |
1,026,254,190 |
1,026,254,190 |
1,003,492,163 |
1,323,797,227 |
951,296,925 |
627,976,150 |
703,602,026 |
787,479,954 |
|
Infrastructure Investments in Small Communities and Rural Areas |
162,625,742 |
162,625,742 |
332,060,472 |
249,232,038 |
177,188,196 |
177,099,875 |
157,116,165 |
92,993,364 |
|
New Bridge for the St. Lawrence Corridor Project |
590,744,529 |
590,744,529 |
737,952,527 |
535,333,680 |
704,693,188 |
639,731,575 |
28,165,895 |
40,687,967 |
|
Subtotal |
6,969,209,596 |
6,969,209,596 |
6,093,494,958 |
7,549,257,795 |
7,097,186,796 |
4,269,183,886 |
3,159,474,911 |
3,059,746,551 |
|
Internal Services |
42,454,205 |
42,454,205 |
57,324,059 |
53,314,070 |
57,414,906 |
57,113,123 |
48,291,361 |
36,135,562 |
|
Total |
7,011,663,801 |
7,011,663,801 |
6,150,819,017 |
7,602,571,865 |
7,154,601,702 |
4,326,297,009 |
3,207,766,272 |
3,095,882,113 |
Actual human resources
|
Programs and Internal Services |
2015-16 |
2016-17 |
2017-19 |
2017-18 Actual |
2018-19 Planned |
2019-20 Planned |
|---|---|---|---|---|---|---|
|
Funding for Provincial-Territorial Priorities |
3 |
3 |
1 |
1 |
1 |
0 |
|
Permanent and Flexible Infrastructure Funding |
22 |
15 |
22 |
15 |
15 |
15 |
|
Investments in National Infrastructure |
27 |
34 |
46 |
69 |
92 |
102 |
|
Large-Scale Infrastructure Investments |
68 |
75 |
84 |
86 |
84 |
80 |
|
Infrastructure Investments in Small Communities and Rural Areas |
32 |
17 |
15 |
15 |
14 |
14 |
|
New Bridge for the St. Lawrence Corridor Project |
44 |
47 |
89 |
64 |
56 |
3 |
|
Subtotal |
196 |
191 |
257 |
250 |
262 |
214 |
|
Internal Services |
161 |
194 |
158 |
179 |
258 |
212 |
|
Total |
357 |
385 |
415 |
429 |
520 |
426 |
Expenditures by vote
For information on the Infrastructure Canada's organizational voted and statutory expenditures, please consult the Public Accounts of Canada 2017-18.xii
Government of Canada spending and activities
Information on the alignment of Infrastructure Canada's spending with the Government of Canada's spending and activities is available in the GC InfoBasexiii.
Financial statements and financial statements highlights
Financial statements
The Infrastructure Canada's financial statements (unaudited) for the year ended March 31, 2018, are available on the Department's websitexiv.
Financial statements highlights
|
Financial information |
2017-18 |
2017-18 |
2016-17 |
Difference (2017-18 actual minus 2017-18 planned) |
Difference (2017-18 actual minus 2016-17 actual) |
|---|---|---|---|---|---|
|
Total expenses |
6,496,331,468 |
3,765,188,733 |
3,193,050,577 |
(2,731,142,735) |
572,138,156 |
|
Total revenues |
- |
- |
- |
- |
- |
|
Net cost of operations before government funding and transfers |
6,496,331,468 |
3,765,188,733 |
3,193,050,577 |
(2,731,142,735) |
572,138,156 |
|
Financial Information |
2017-18 |
2016-17 |
Difference |
|---|---|---|---|
|
Total net liabilities |
2,011,212,737 |
1,371,502,173 |
639,710,564 |
|
Total net financial assets |
580,523,443 |
147,457,552 |
443,065,891 |
|
Departmental net debt |
1,430,689,294 |
1,224,044,621 |
206,644,673 |
|
Total non-financial assets |
2,144,924,585 |
1,371,707,995 |
773,216,590 |
|
Departmental net financial position |
714,235,291 |
147,663,374 |
566,571,917 |
Footnotes
- Footnote 16
-
There is no planned spending for this program in 2019-20 as this program is anticipated to end.
- Date modified: