The National Shelter Study: Emergency shelter use in Canada 2005 to 2021
Acknowledgements
This paper was developed by the Homelessness Policy Directorate at Infrastructure Canada.
We would like to acknowledge the collaboration and efforts each of the service providers that contributed data used in this paper.
We also would like to thank shelter staff for collecting the data, as well as shelter users for agreeing to share their information.
Principle Investigator and Contributors
- Annie Duchesne, Principal Investigator
- Alexander Robinson & Wendy Ngan, Patrick Hunter, Michelle Roberts, Siqin Guo, Rhi Ann Ng & Ian Cooper, Contributors
Executive Summary
Introduction
The National Shelter Study is an ongoing analysis of emergency shelter trends in Canada. This is the sixth edition of the National Shelter Study. It extends the timeframe of the analysis from 2005 to 2021 and describes trends in shelter use, shelter capacity and shelter users. Particular attention is paid to 2020 and 2021 and changes associated with the COVID-19 pandemic.
The National Shelter Study is the most comprehensive national-level study of homelessness in Canada and is important for understanding trends over time. While emergency shelter use is a strong indicator for homelessness, it is important to note this report does not include experiences of homelessness that take place outside of the emergency shelter systemFootnote 1.
Methods
The National Shelter Study analyzes data from services that use the Homeless Individuals and Families Information System (HIFIS), and from communities that use alternative systems and have entered into data sharing agreements with the federal government. Approximately 50% of emergency shelters in Canada are included in the analysis, representing about 70% of available emergency shelter beds.
Compared to previous reports, the results presented in this paper are based on an updated methodology for calculating homeless shelter use. A full description of the methodology is included in this paper.
Key Findings
Shelter capacity and COVID-19
- There was a large drop in total permanent emergency shelter capacity in 2020 as a result of the COVID-19 pandemic. Between 2019 and 2020, shelter capacity, defined as the number of beds available on a given night, decreased by 20.5% to allow for social distancing. Overall shelter capacity largely recovered in 2021, 1.5% lower than in 2019.
Shelter use and occupancy
- In 2021, an estimated 93,529 people used an emergency homeless shelter.
- The number of shelter users trended downwards from 2005 to 2019, with a sharp drop in 2020 and a partial recovery in 2021.
- Shelter occupancy decreased between 2020 (93.7%) and 2021 (85.7%). In 2020, there were fewer beds, but the beds were full. In 2021, the bed numbers had mostly recovered, however, shelter use did not increase at the same rate.
Demographics
- In 2021, 67.8% of shelter users were men and 31.1% were women. While the proportion of men and women has been relatively consistent since 2015, the proportion of shelter users reporting a gender other than man or woman increased significantly between 2015 (0.5%) and 2021 (1.1%).
- Similar to previous years, compared to the general population, children and seniors were under-represented among shelter users in 2021 while adults aged 25 to 49 were over-represented.
- An analysis of age specific rates of shelter use comparing the incidence of shelter use for the total population of a specific age group in Canada found decreases in the rates of shelter use for all age groups between 2005 and 2021, with the exception of children under the age of 15.
- In 2021, the majority (85.8%) of shelter users were Canadian citizens. This was observed for every year between 2015 and 2021.
- From 2015 to 2019 there was a steady increase in the proportion of permanent residents and refugees followed by a sharp decrease in 2020 and 2021.
- Indigenous Peoples made up 39.1% of shelter users in 2021, however, they represented only 5.0% of the Canadian population. Indigenous Peoples were 10.7 times more likely to use shelters compared to non-Indigenous people. This disparity was observed among all age groups though it was more pronounced among adults aged 25 and over. The pandemic disproportionately affected the rate of shelter use among Indigenous Peoples compared to non-Indigenous people.
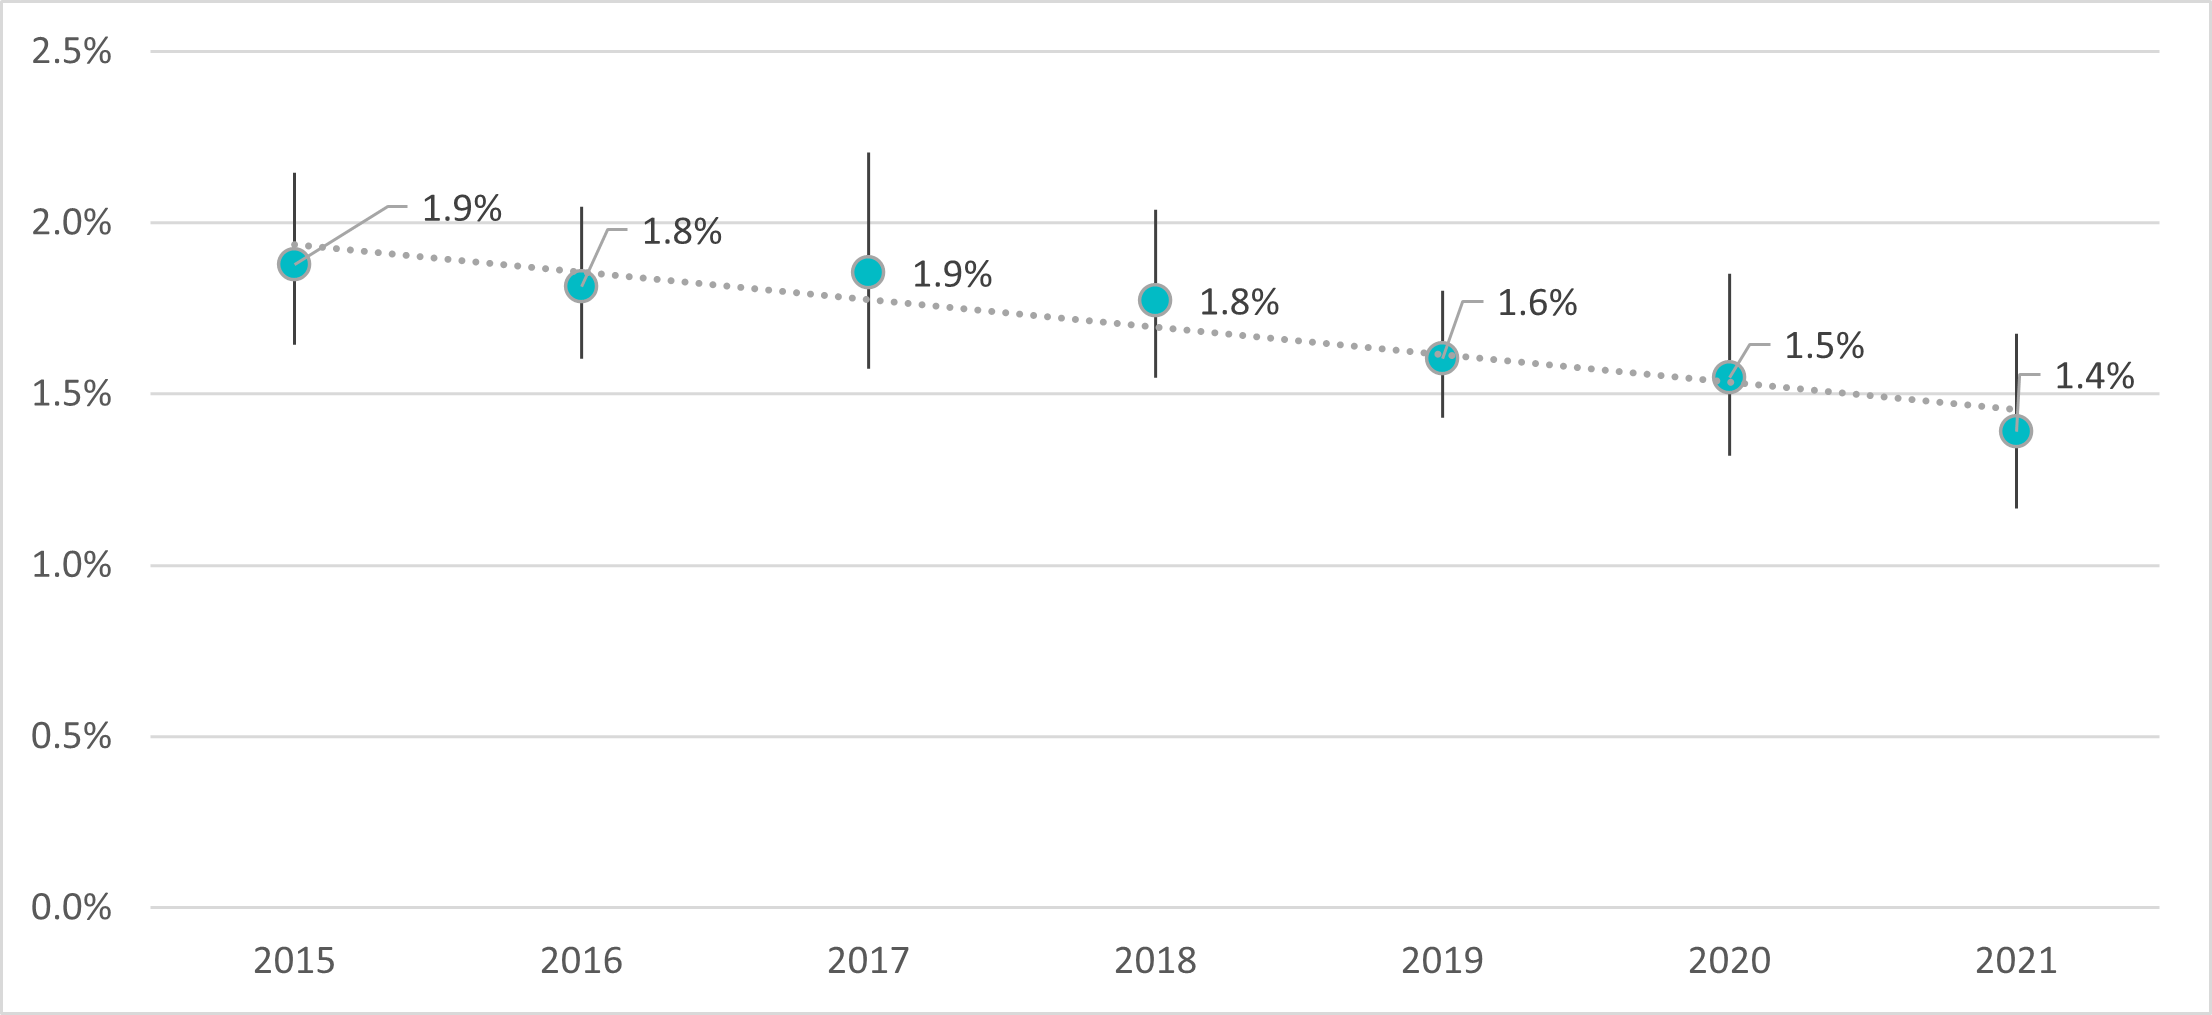
- There was a steady trend downwards in the number of Veterans using emergency shelters, though the proportion did not change significantly between 2015 (1.9%) and 2021 (1.4%).
The National Shelter Study
Previous Studies
There have been six iterations of the National Shelter Study since 2013.
- National Shelter Study 2005 To 2009 (Published 2013)
- National Shelter Study 2005 To 2014 Update (Published 2017)
- National Shelter Study 2005 To 2016 Update (Published 2021)
- National Shelter Study 2018 Snapshot Update (Published 2022)
- National Shelter Study 2019 Snapshot Update (Published 2022)
- National Shelter Study 2020 Snapshot Update (Published 2023)
- National Shelter Study 2021 Snapshot Update (Published 2023)
New Context
Over the course of the COVID-19 pandemic, the homeless service landscape changed constantly. As the sector responded to meet public health guidelines, there was a significant drop in emergency shelter spaces and a shift from reliance on the established emergency shelter system to temporary service locations such as hotels/motels, and makeshift use of public spaces. The adaptability and resilience of the Homelessness Management Information Systems was tested. The situation made it difficult to accurately capture shelter capacity and the size of the shelter population at the national level. In response, the national estimate methodology was updated to accommodate shifting shelter capacity.
When looking at trends in shelter use in 2020 and 2021, it is important to consider findings in the appropriate context. The COVID-19 pandemic evolved rapidly and was coupled with a variety of individual and government responses, including the Canada Emergency Response Benefit (CERB), rent moratoria, shelter-in-place lockdowns, border closures, social distancing rules, shelter capacity reductions, etc. The combination of these elements contributed to temporary reductions in shelter inflow, however, this should not be confused with a reduction in homelessness. The National Shelter Study does not capture homelessness in contexts outside of the permanent shelter system, such as temporary shelters, couch surfing and rough sleeping. This is an especially important point to remember when looking at 2020 and 2021 data because it excludes those who could not access shelter due to capacity reductions or those who chose not to access shelters to avoid exposure to the virus. As such, emergency shelter use in 2020 and 2021 may underrepresent homelessness in Canada to a greater degree compared to previous years.
Methods
The objective of the National Shelter Study is to estimate the total number of people who access emergency shelters in Canada. This data was provided to the federal government through the Homeless Individuals and Families Information System (HIFIS) and through individual data sharing agreements with jurisdictions that use comparable systems (City of Toronto, Province of Alberta, Region of Peel). Approximately 50% of emergency shelters in Canada are included in the analysis, representing about 70% of available emergency shelter beds.
The National Shelter Study uses data from permanent emergency homeless shelters due to the good availability of data from these services at a national level. Domestic violence shelters, transitional housing, temporary shelters, and immigrant and refugee shelters were excluded due to lack of data.
This paper employed an updated methodology compared to those published prior to 2023 (Table 1). Whereas the previous analyses assumed a fixed annual capacity, in the updated approach shelters were sampled monthly to account for variance in shelter capacity. The new approach is more sensitive to shifts in capacity due to major events like the COVID-19 pandemic, and results in a more accurate estimate of shelter use over the course of the year. A more detailed description of the methodology can be found in Annex A.
| Previous method |
Current method |
|---|---|
|
Permanent emergency shelters only in frame |
Permanent emergency shelters only in frame |
|
Fixed annual capacity |
Variable monthly capacity |
|
Annual sampling frame and weights |
Monthly sampling frames and weights |
Results
Shelter use
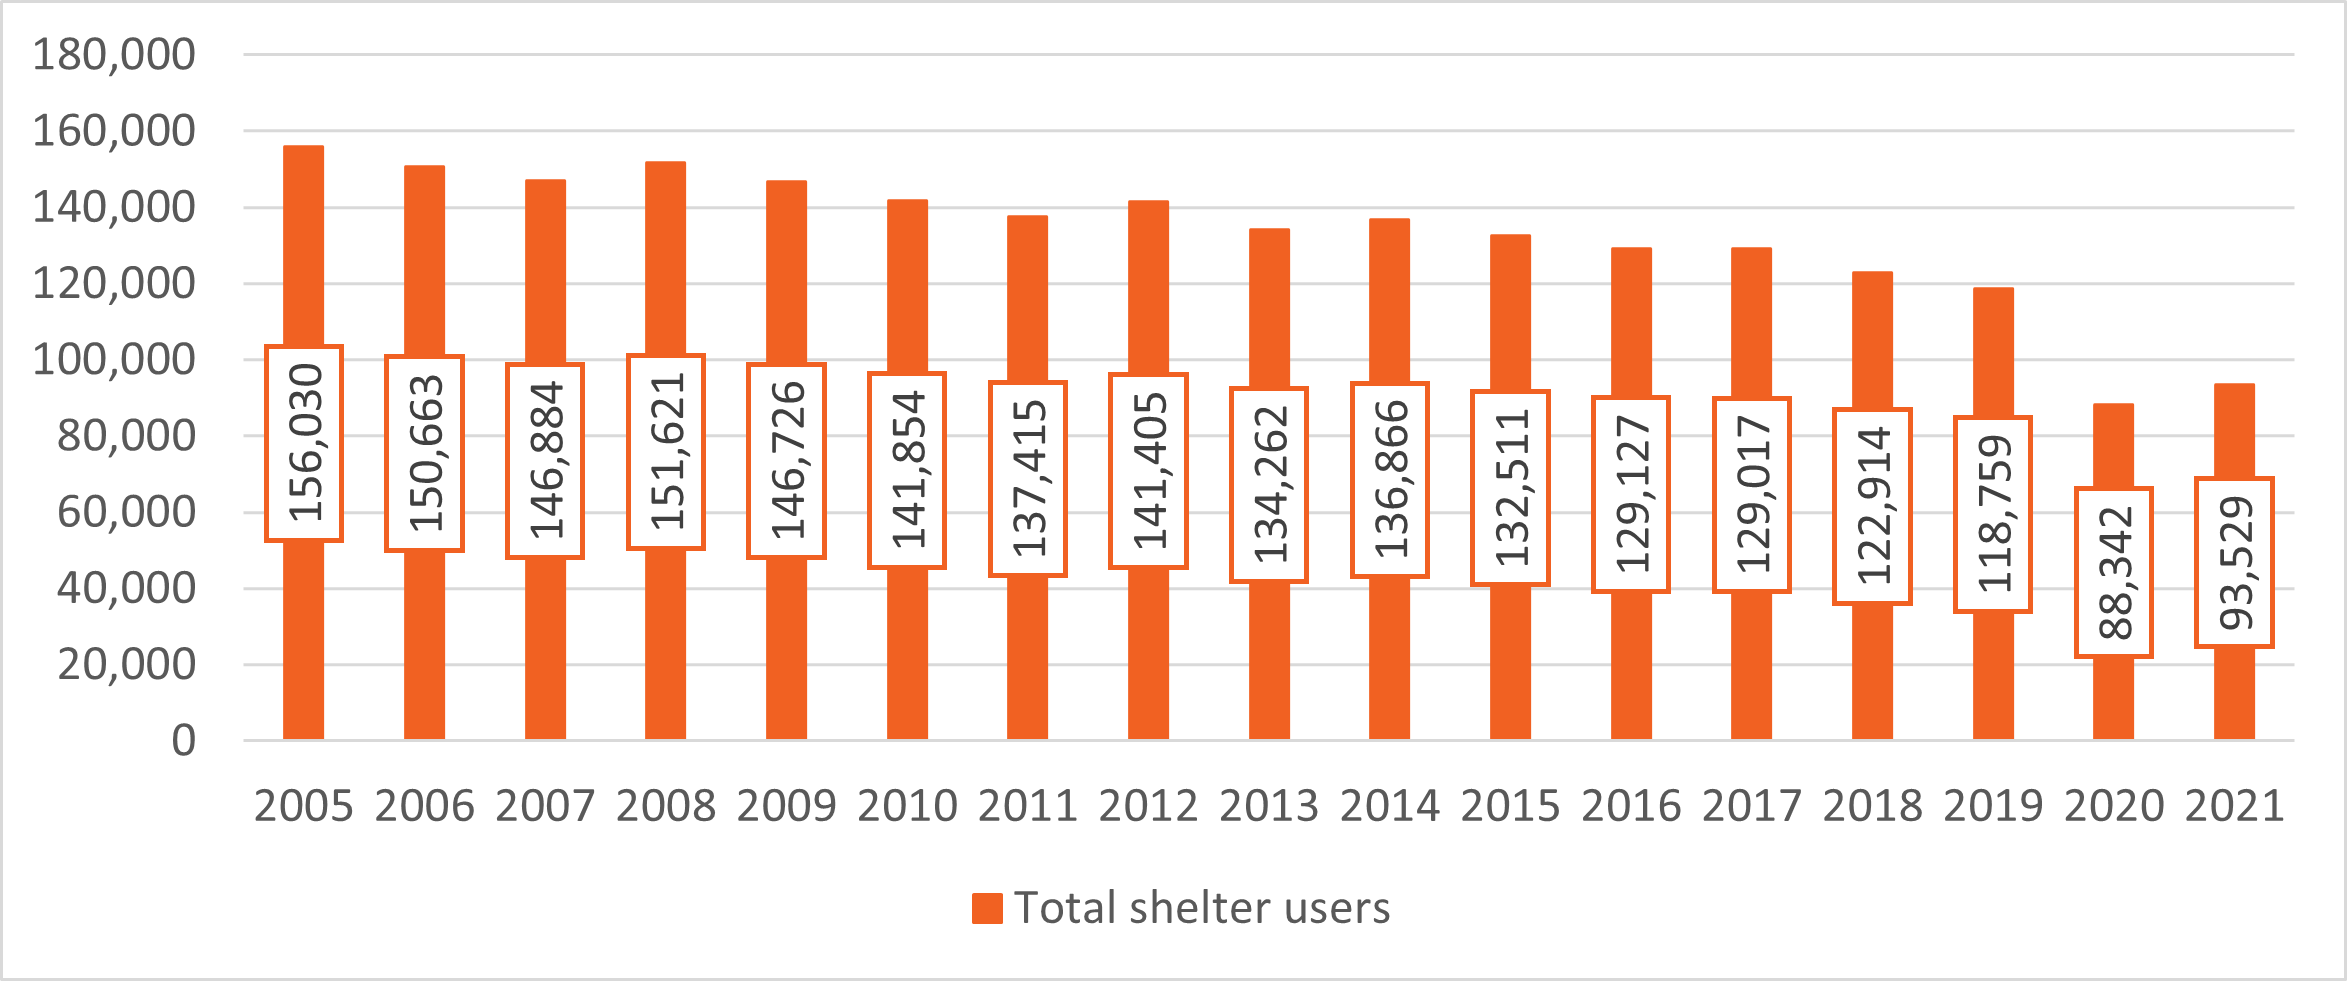
In 2021, an estimated 93,529 people used an emergency homeless shelter, compared to 88,342 in 2020 (Figure 1). On an average night, there were approximately 13,170 people staying in emergency shelters, compared to 11,614 in 2020Footnote 2.
The number of shelter users trended downwards between 2005 and 2019. The drop was more pronounced in 2020 in the first year of the pandemic, when shelter users decreased by 25.6%. Between 2020 and 2021, the number of shelter users increased by 5.9%.
Figure 1: Number of shelter users from 2005 to 2021
-
Figure 1 - Text version
Figure 1. Number of shelter users from 2005 to 2021 Year
Total shelter users
2005
156,030
2006
150,663
2007
146,884
2008
151,621
2009
146,726
2010
141,854
2011
137,415
2012
141,405
2013
134,262
2014
136,866
2015
132,511
2016
129,127
2017
129,017
2018
122,914
2019
118,759
2020
88,342
2021
93,529
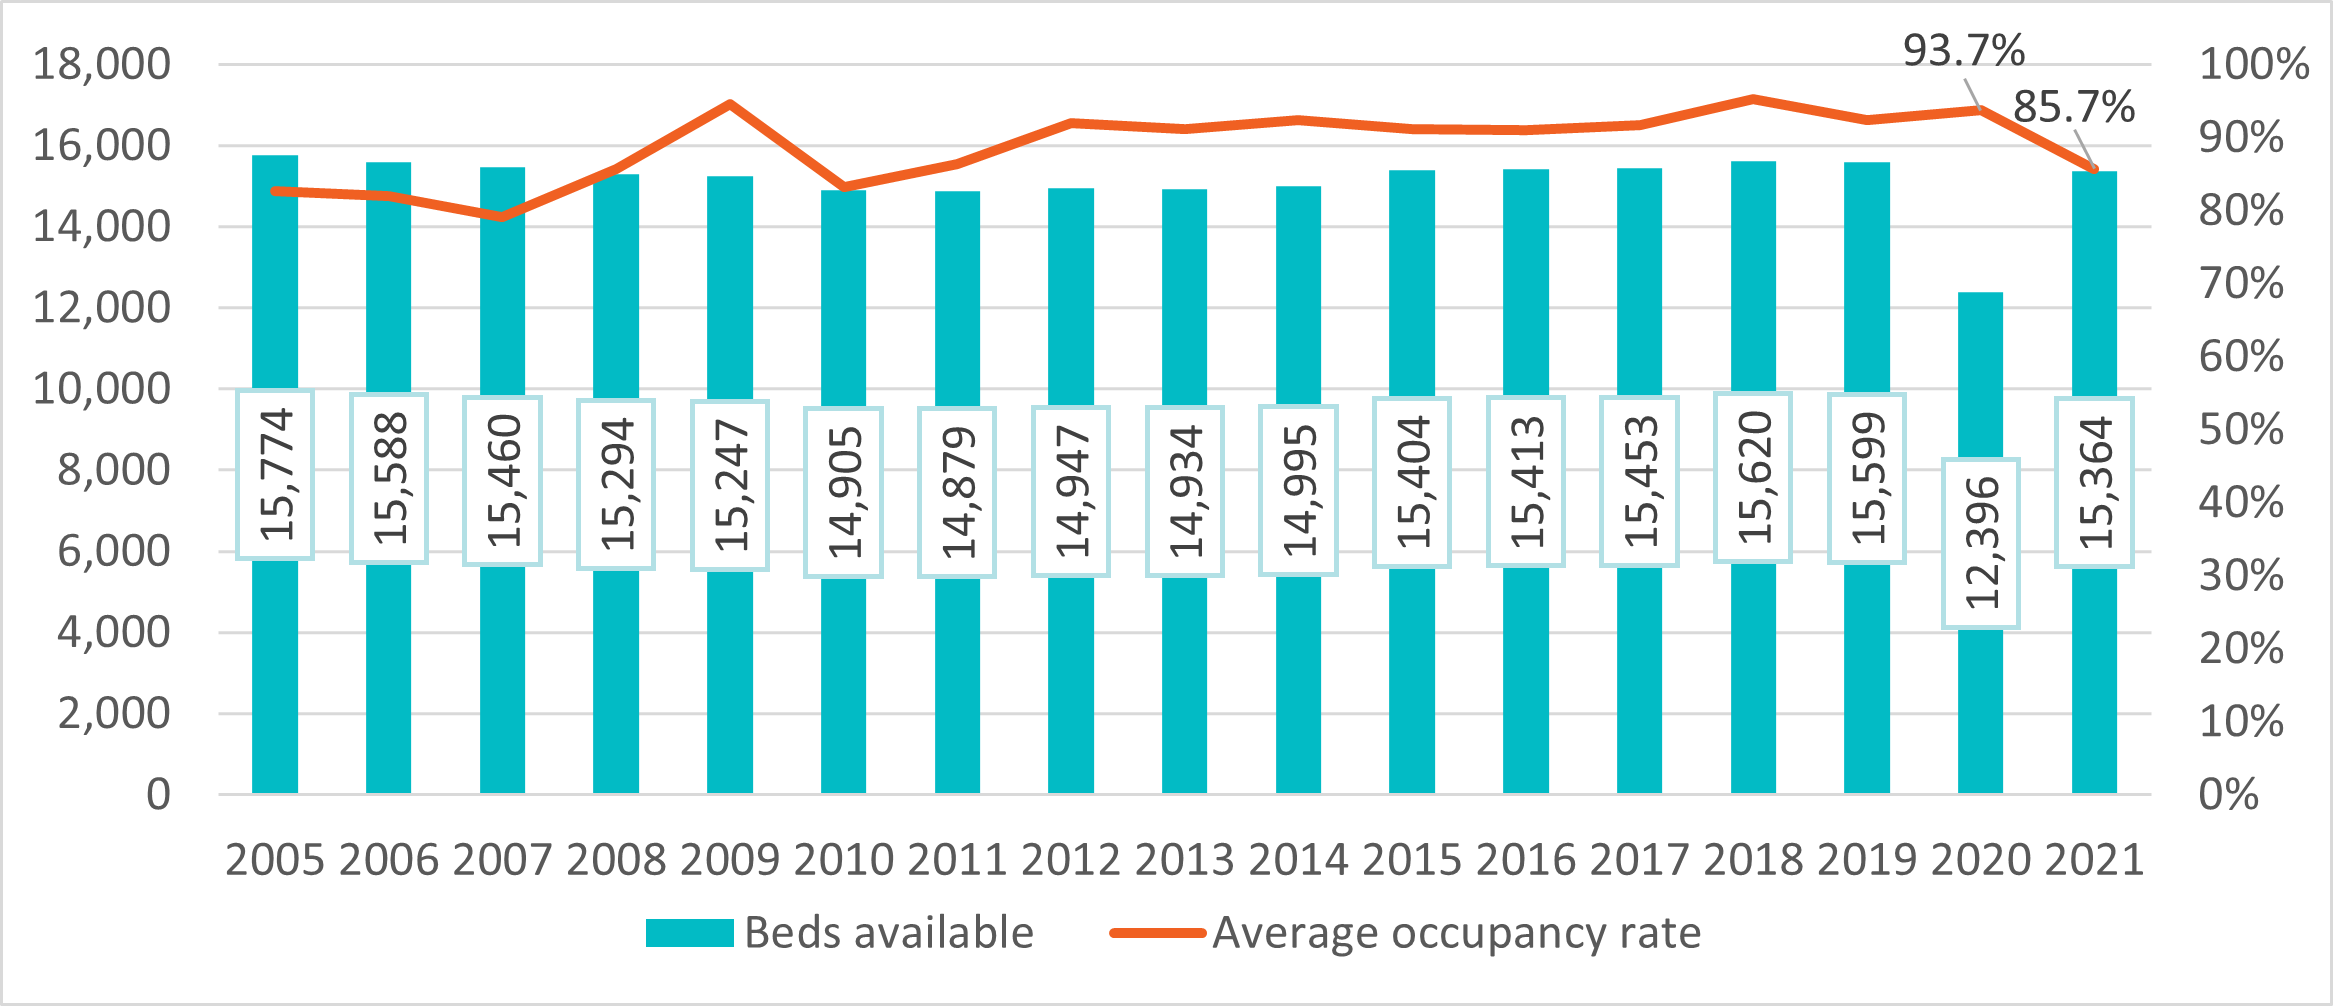
There was a large drop in total permanent emergency shelter capacity in 2020 as a result of the COVID-19 pandemic (Figure 2). Between 2019 and 2020, shelter capacity, defined as the number of beds available on a given night, decreased by 20.5% to allow for social distancing. Overall shelter capacity largely recovered in 2021, 1.5% lower than in 2019.
Despite a drop in the number of individuals and number of available beds between 2019 and 2020, the occupancy rate rose slightly in 2020 (Figure 2). This is due in part to the 20.5% drop in number of available shelter beds between 2019 and 2020. While there was a partial recovery in capacity and number of individuals using shelters in 2021, the occupancy rate was lower (85.7%) in comparison to recent years. This indicates there was less demand for permanent emergency shelter beds in 2021, even though the beds were once again available for use. Some possible explanations for this include:
- Communities continued to use temporary shelter sites in 2021 to allow for social distancing.
- Pandemic responses such as eviction moratoria and CERB reduced the need for emergency shelter services by helping people to avoid homelessness.
- Individuals avoided emergency shelters in favour of alternative options, like couch surfing and encampments, because of perceived risks (e.g. COVID-19) of staying in shelter.
Figure 2: Beds available and average shelter occupancy rate 2005 to 2021
-
Figure 2 - Text version
Figure 2. Beds available and average shelter occupancy rate from 2005 to 2021 Year
Average occupancy rate
Beds available
2005
82.7%
15,774
2006
82.0%
15,588
2007
79.1%
15,460
2008
85.7%
15,294
2009
94.6%
15,247
2010
83.2%
14,905
2011
86.3%
14,879
2012
91.9%
14,947
2013
91.2%
14,934
2014
92.4%
14,995
2015
91.2%
15,404
2016
91.0%
15,413
2017
91.7%
15,453
2018
95.2%
15,620
2019
92.3%
15,599
2020
93.7%
12,396
2021
85.7%
15,364
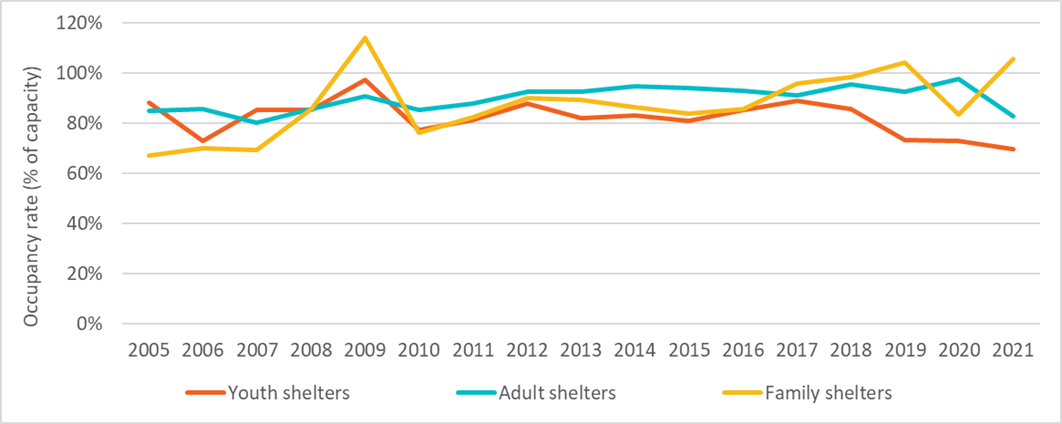
Despite the drop in 2021, shelter occupancy remained high. This was largely driven by stays in family and adult shelters. Family shelters operated over capacity in 2021. There was also an increase in occupancy for adult shelters in 2020, though this was likely driven by pandemic-related capacity reductions (Figure 3).
Figure 3: Occupancy rate by shelter type from 2005 to 2021
-
Figure 3 - Text version
Figure 3. Occupancy rate by shelter type from 2005 to 2021 Year
Youth shelters
Adult shelters
Family shelters
2005
88.2%
85.0%
67.3%
2006
72.9%
85.6%
70.0%
2007
85.5%
80.1%
69.5%
2008
85.5%
85.7%
85.7%
2009
97.2%
90.7%
114.2%
2010
77.3%
85.4%
76.3%
2011
81.3%
87.8%
82.4%
2012
87.8%
92.8%
90.1%
2013
82.0%
92.8%
89.4%
2014
83.3%
94.9%
86.3%
2015
81.0%
94.0%
84.1%
2016
85.5%
92.9%
85.7%
2017
89.0%
91.1%
95.8%
2018
85.7%
95.6%
98.5%
2019
73.4%
92.5%
104.2%
2020
73.1%
97.9%
83.6%
2021
69.7%
83.0%
106.0%
High occupancy rates may also have been driven by length of stay. While the number of people using shelters has decreased over time, there was a significant increase in the average number of days a person spent in shelter in 2021 (51.4 days) compared to 2005 (30.5 days) (Figure 4). The average length of stay varied by shelter type. In 2021, family shelter users spent more days on average in shelters (67.1 days) compared to youth (49.1 days) and general shelter users (48.4 days). This may be due in part to the difficulty in finding appropriate, safe and affordable housing for larger households.
Figure 4: Average length of stay in shelter per year from 2005 to 2021

-
Figure 4 - Text version
Figure 4. Average length of stay in shelter per year from 2005 to 2021 Year
Average length of stay in shelter per year
2005
30.5
2006
31.0
2007
30.4
2008
31.6
2009
35.9
2010
31.9
2011
34.1
2012
35.4
2013
37.0
2014
37.0
2015
38.7
2016
39.7
2017
40.1
2018
44.2
2019
44.2
2020
48.0
2021
51.4
Demographics
Gender
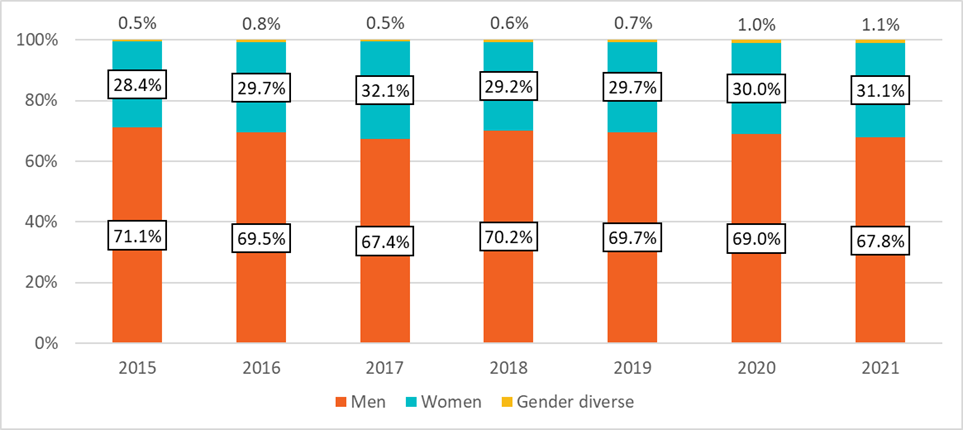
In 2021, 67.8% of shelter users identified as men and 31.1% as women (Figure 5). Those who reported a gender other than man or woman represented 1.1% of the shelter population. The proportion of men and women shelter users remained relatively consistent between 2015 and 2021. Small changes in proportion were not statistically significant for these groups. However, the proportion of people reporting a gender other than man or woman increased significantly between 2015 (0.5%) and 2021 (1.1%).
Figure 5: Gender distribution of shelter users from 2015 to 2021
-
Figure 5 - Text version
Figure 5. Gender distribution of shelter users from 2015 to 2021 Year
Men
Women
Gender diverse
2015
71.1%
28.4%
0.5%
2016
69.5%
29.7%
0.8%
2017
67.4%
32.1%
0.5%
2018
70.2%
29.2%
0.6%
2019
69.7%
29.7%
0.7%
2020
69.0%
30.0%
1.0%
2021
67.8%
31.1%
1.1%
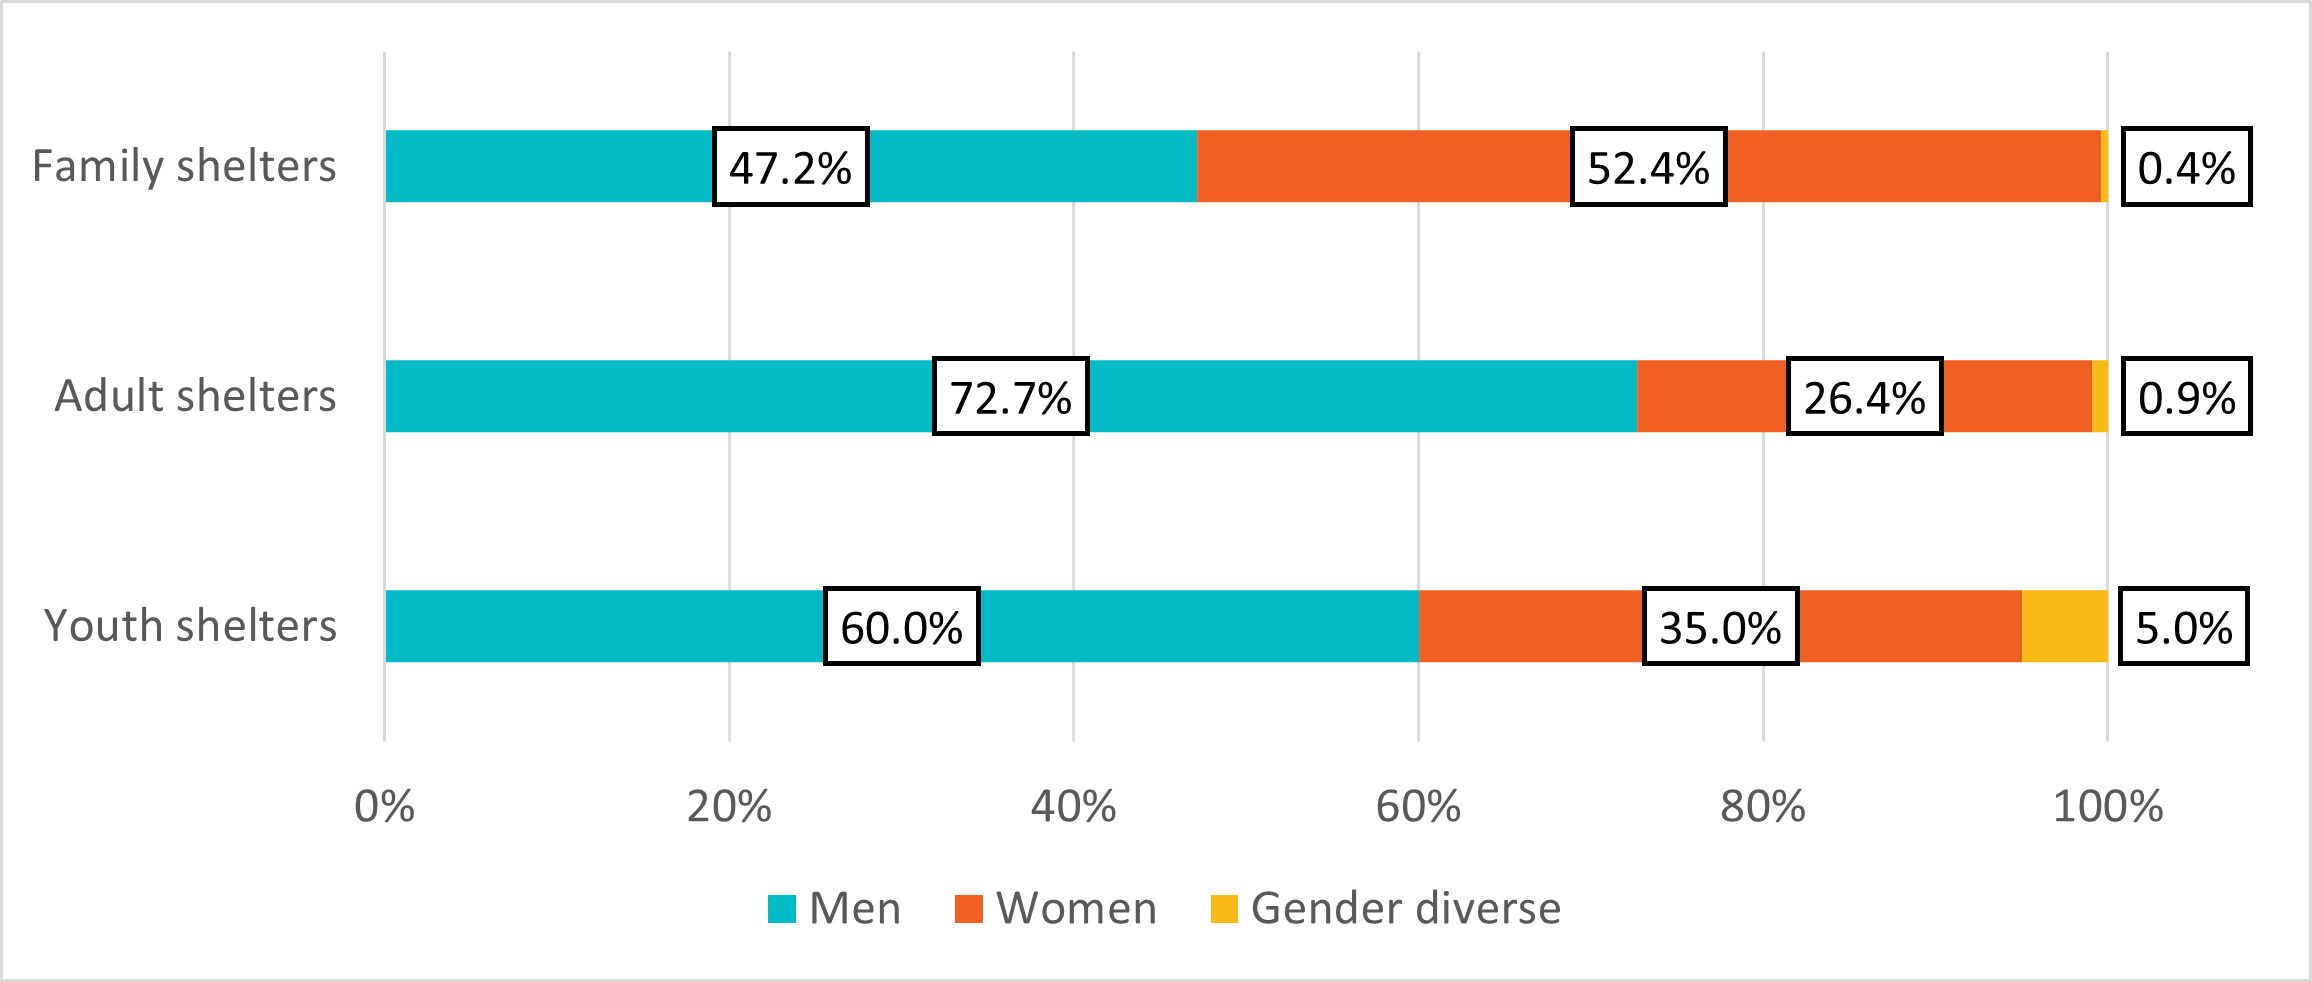
In 2021, men made up the majority of shelter users in youth shelters (59.9%) and adult shelters (72.2%). In family shelters, a slightly higher proportion of shelter users were women (52.2%). Gender diverse individuals made up a higher proportion of shelter users in youth shelters (5.0%) compared to adult shelters (0.9%) and family shelters (0.4%) (Figure 6).
Figure 6: Gender distribution by type of shelter in 2021
-
Figure 6 - Text version
Figure 6. Gender distribution by type of shelter in 2021 Gender
Youth shelters
Adult shelters
Family shelters
Men
60.0%
72.7%
47.2%
Women
35.0%
26.4%
52.4%
Gender diverse
5.0%
0.9%
0.4%
Age
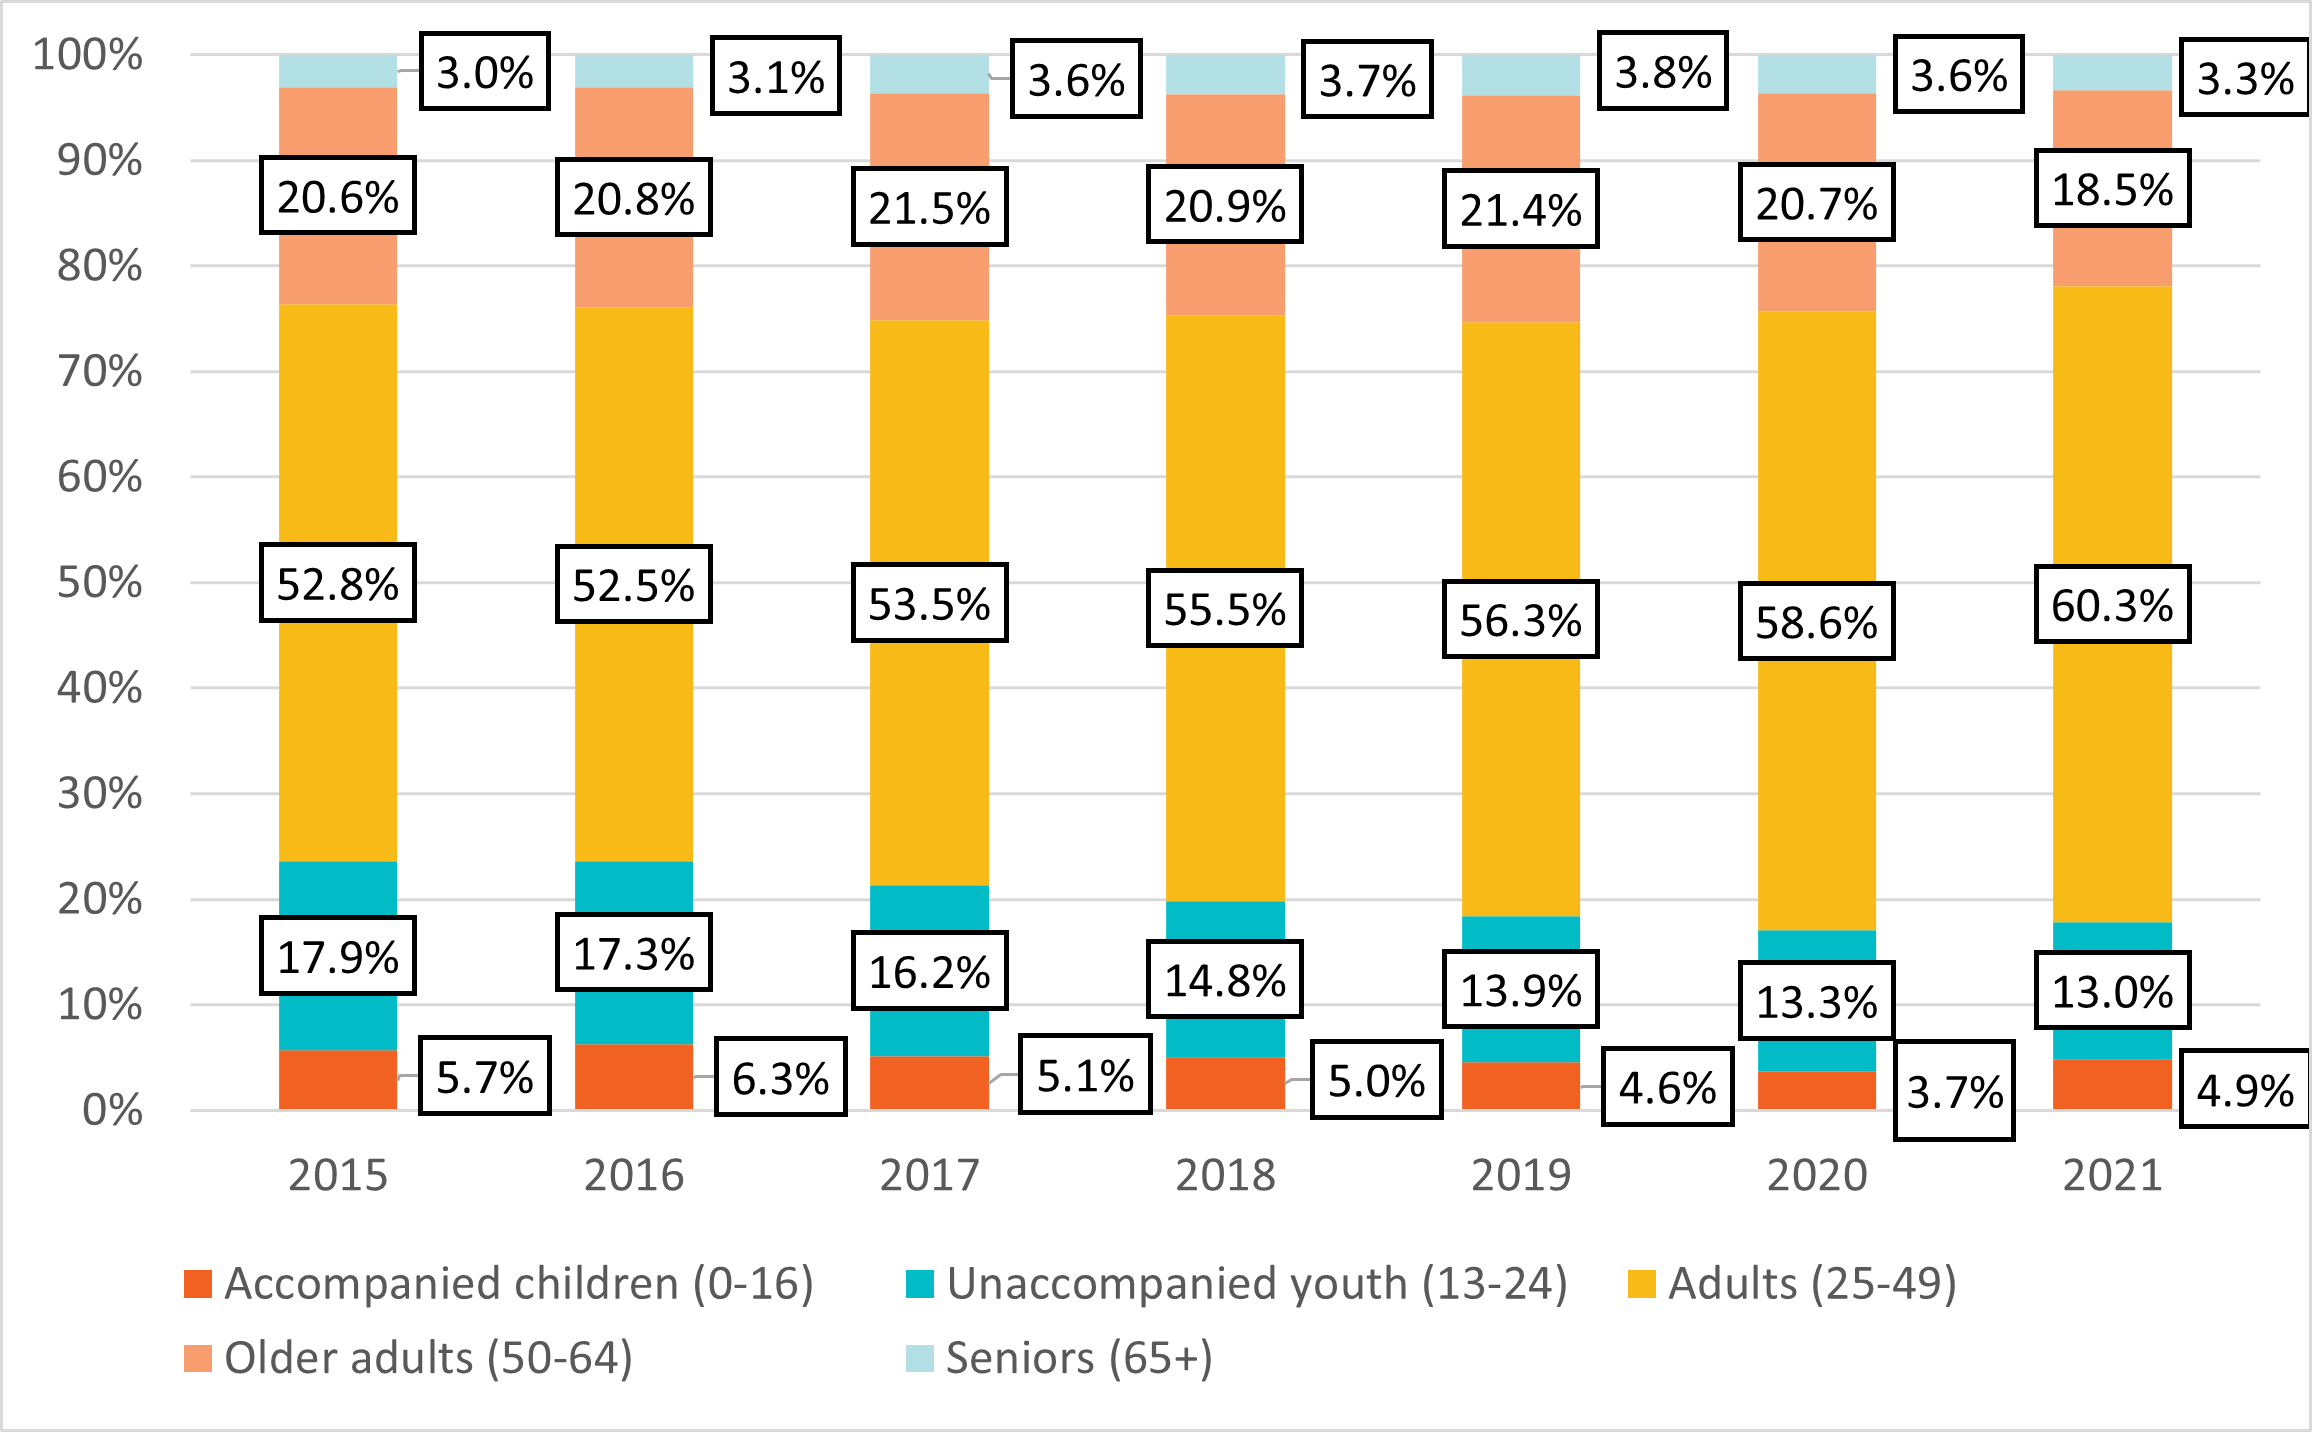
In 2021, the majority of shelter users were adults aged 25-49 (60.3%). The next largest group was older adults aged 50 to 64 (18.5%), followed by unaccompanied youth (13.0%), accompanied children (4.9%), and seniors (3.3%).
Between 2015 and 2021, there was a significant decrease in the proportion of unaccompanied youth among shelter users from 17.9% to 13.0% (Figure 7). The proportion of shelter users who were accompanied children, older adults, and seniors in 2021 was similar to previous years.
Consistent with findings from previous years, the average age of all shelter users in 2021 was 38.0 years old. This is slightly younger than the average age of the general Canadian population in 2021 (41.9)Footnote 3. The average age of shelter users varied by shelter type:
- The average age of youth shelter users was 21.3 years.
- The average age among family shelter users was 28.8 years. However, there are two distinct groups that access this type of service: adults and dependent children. Among adults who used family shelters, the average age was 38.7. Among dependent children who used family shelters, the average age was 7.6 years old.
- The average age of general shelter users was 41.5 years.
In 2021, shelter users who identified as gender diverse tended to be younger on average (29.8 years) compared to those who identified as men (39.6 years) or women (34.9 years). This corresponds to the higher proportion of those who identified as gender diverse in youth shelters, compared to other shelter types.
Figure 7: Age distribution for shelter users from 2015 to 2021
-
Figure 7 - Text version
Figure 7. Age distribution for shelter users from 2015 to 2021 Age group
Accompanied children (0-16)
Unaccompanied youth (13-24)
Adults (25-49)
Older adults (50-64)
Seniors (65+)
2015
5.7%
17.9%
52.8%
20.6%
3.0%
2016
6.3%
17.3%
52.5%
20.8%
3.1%
2017
5.1%
16.2%
53.5%
21.5%
3.6%
2018
5.0%
14.8%
55.5%
20.9%
3.7%
2019
4.6%
13.9%
56.3%
21.4%
3.8%
2020
3.7%
13.3%
58.6%
20.7%
3.6%
2021
4.9%
13.0%
60.3%
18.5%
3.3%
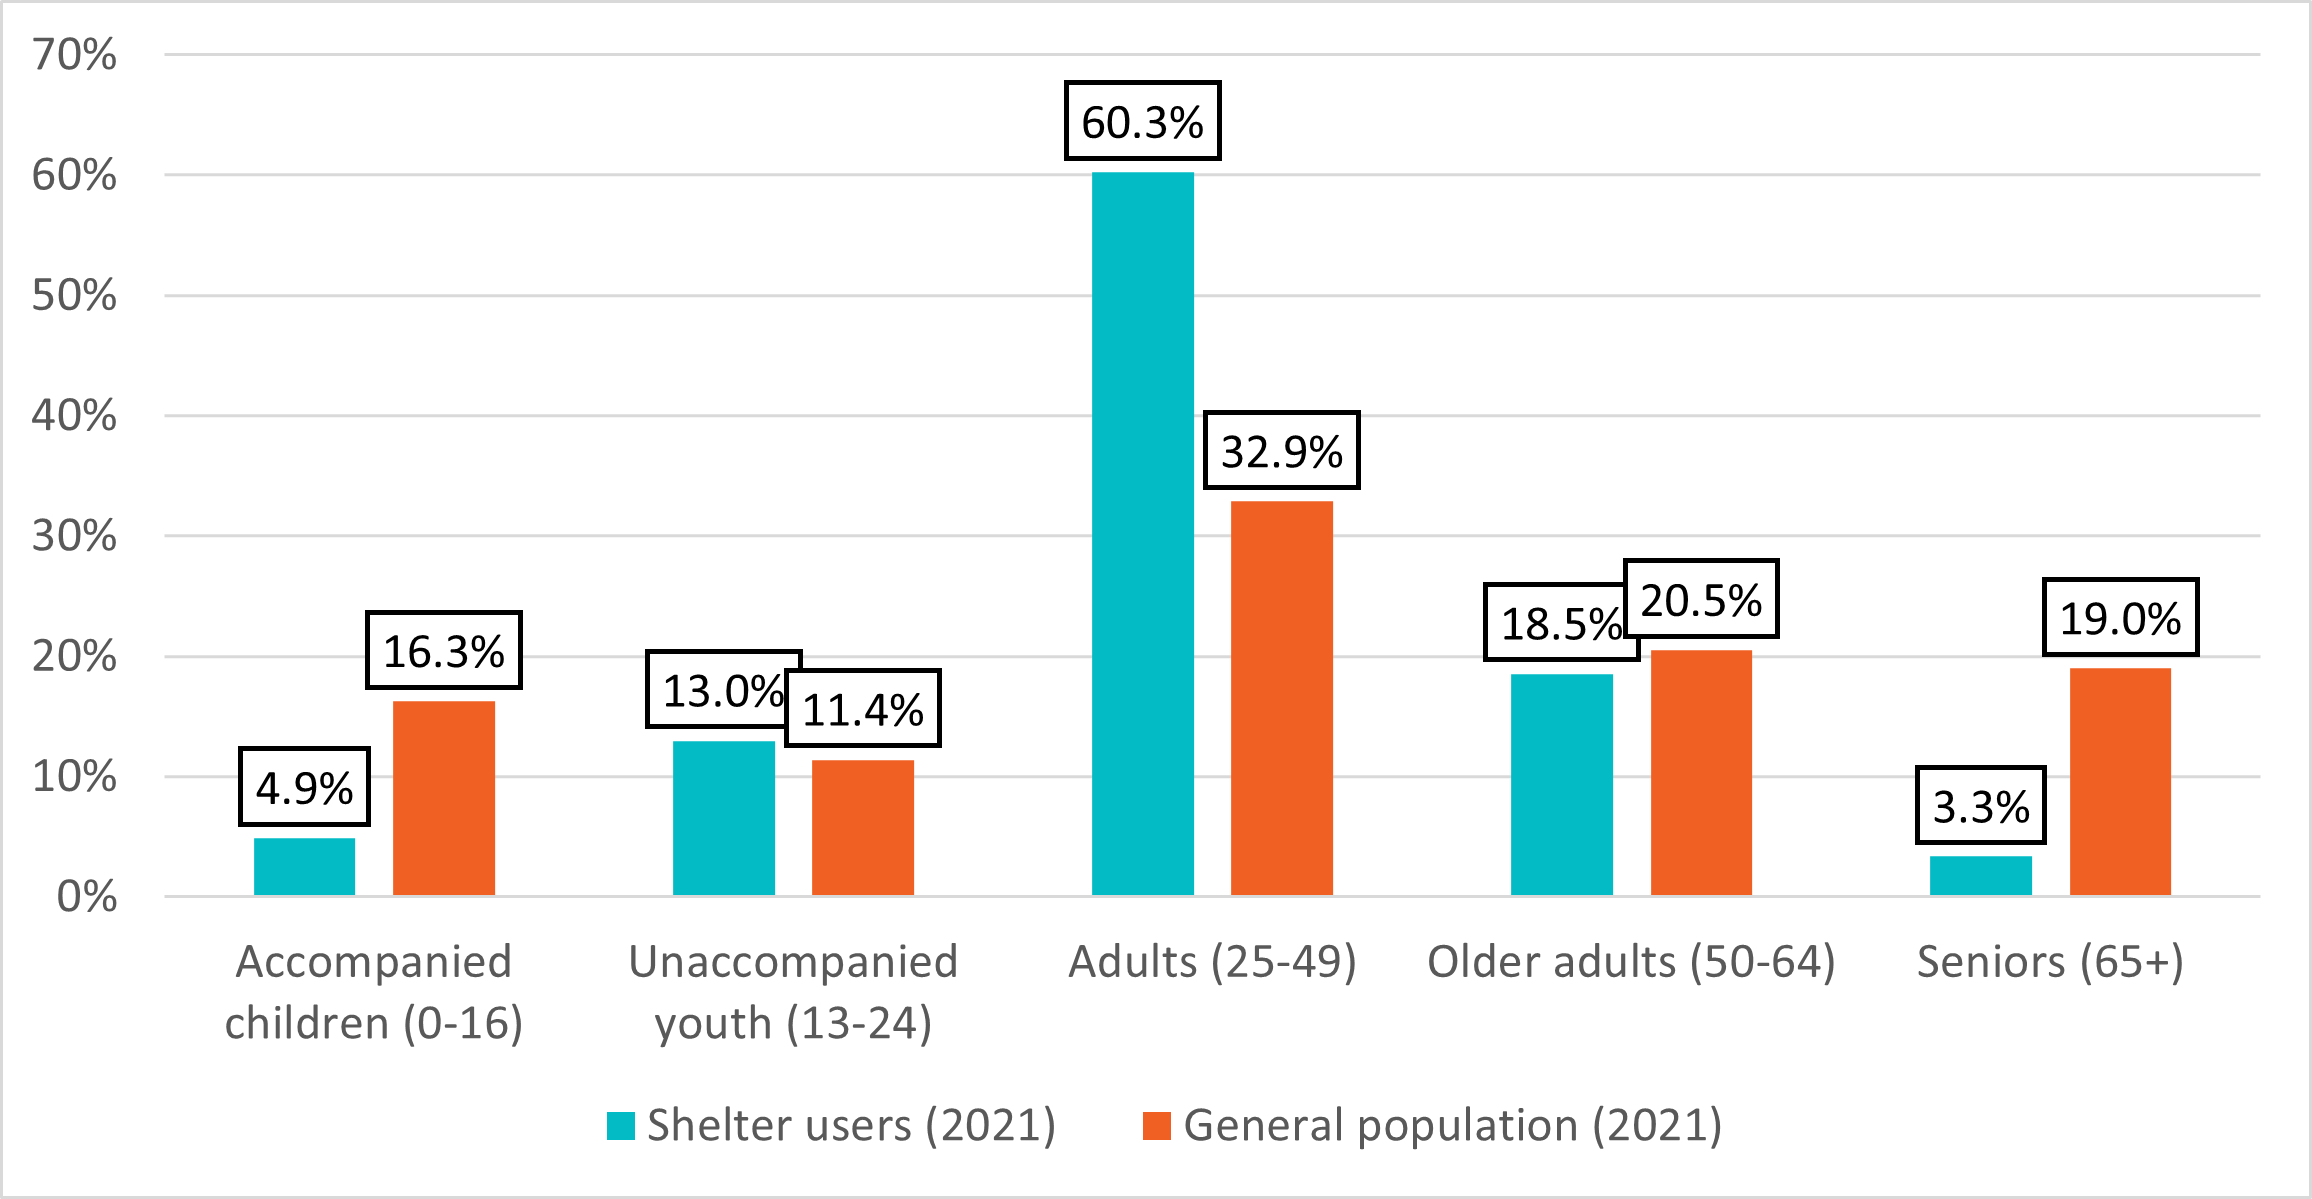
Compared to the general population, accompanied children and seniors were under-represented among shelter users in 2021, while adults aged 25-49 were overrepresented (Figure 8).
Some possible explanations for under-representation among people over the age of 65 include:
- Higher mortality rates among those who experience homelessness.
- Additional income sources become available after age 65 including Old Age Security pension, Guaranteed Income Supplement and Canada Pension Plan.
- More supportive housing options for seniors (priority group in many communities).
- Alternative accommodation options available to seniors, even for those with little or no income (e.g., assisted living facilities, long term care facilities).
- Shelter avoidance among seniors (safety concerns, inability of shelters to meet health and care needs)
Some possible explanations for under-representation among accompanied children:
- Additional financial supports for low-income families in comparison to single adults, which may prevent homelessness.
- Shelter avoidance among youth and families to avoid apprehension by child and social services.
- Involvement of child and family services to remove children and youth from families experiencing homelessness.
Figure 8: Age group distribution among shelter users compared to the general population (2021)
-
Figure 8 - Text version
Figure 8. Age group distribution among shelter users compared to the general population (2021) Age group
Shelter users (2021)
General population (2021)
Accompanied children (0-16)
4.9%
16.3%
Unaccompanied youth (13-24)
13.0%
11.4%
Adults (25-49)
60.3%
32.9%
Older adults (50-64)
18.5%
20.5%
Seniors (65+)
3.3%
19.0%
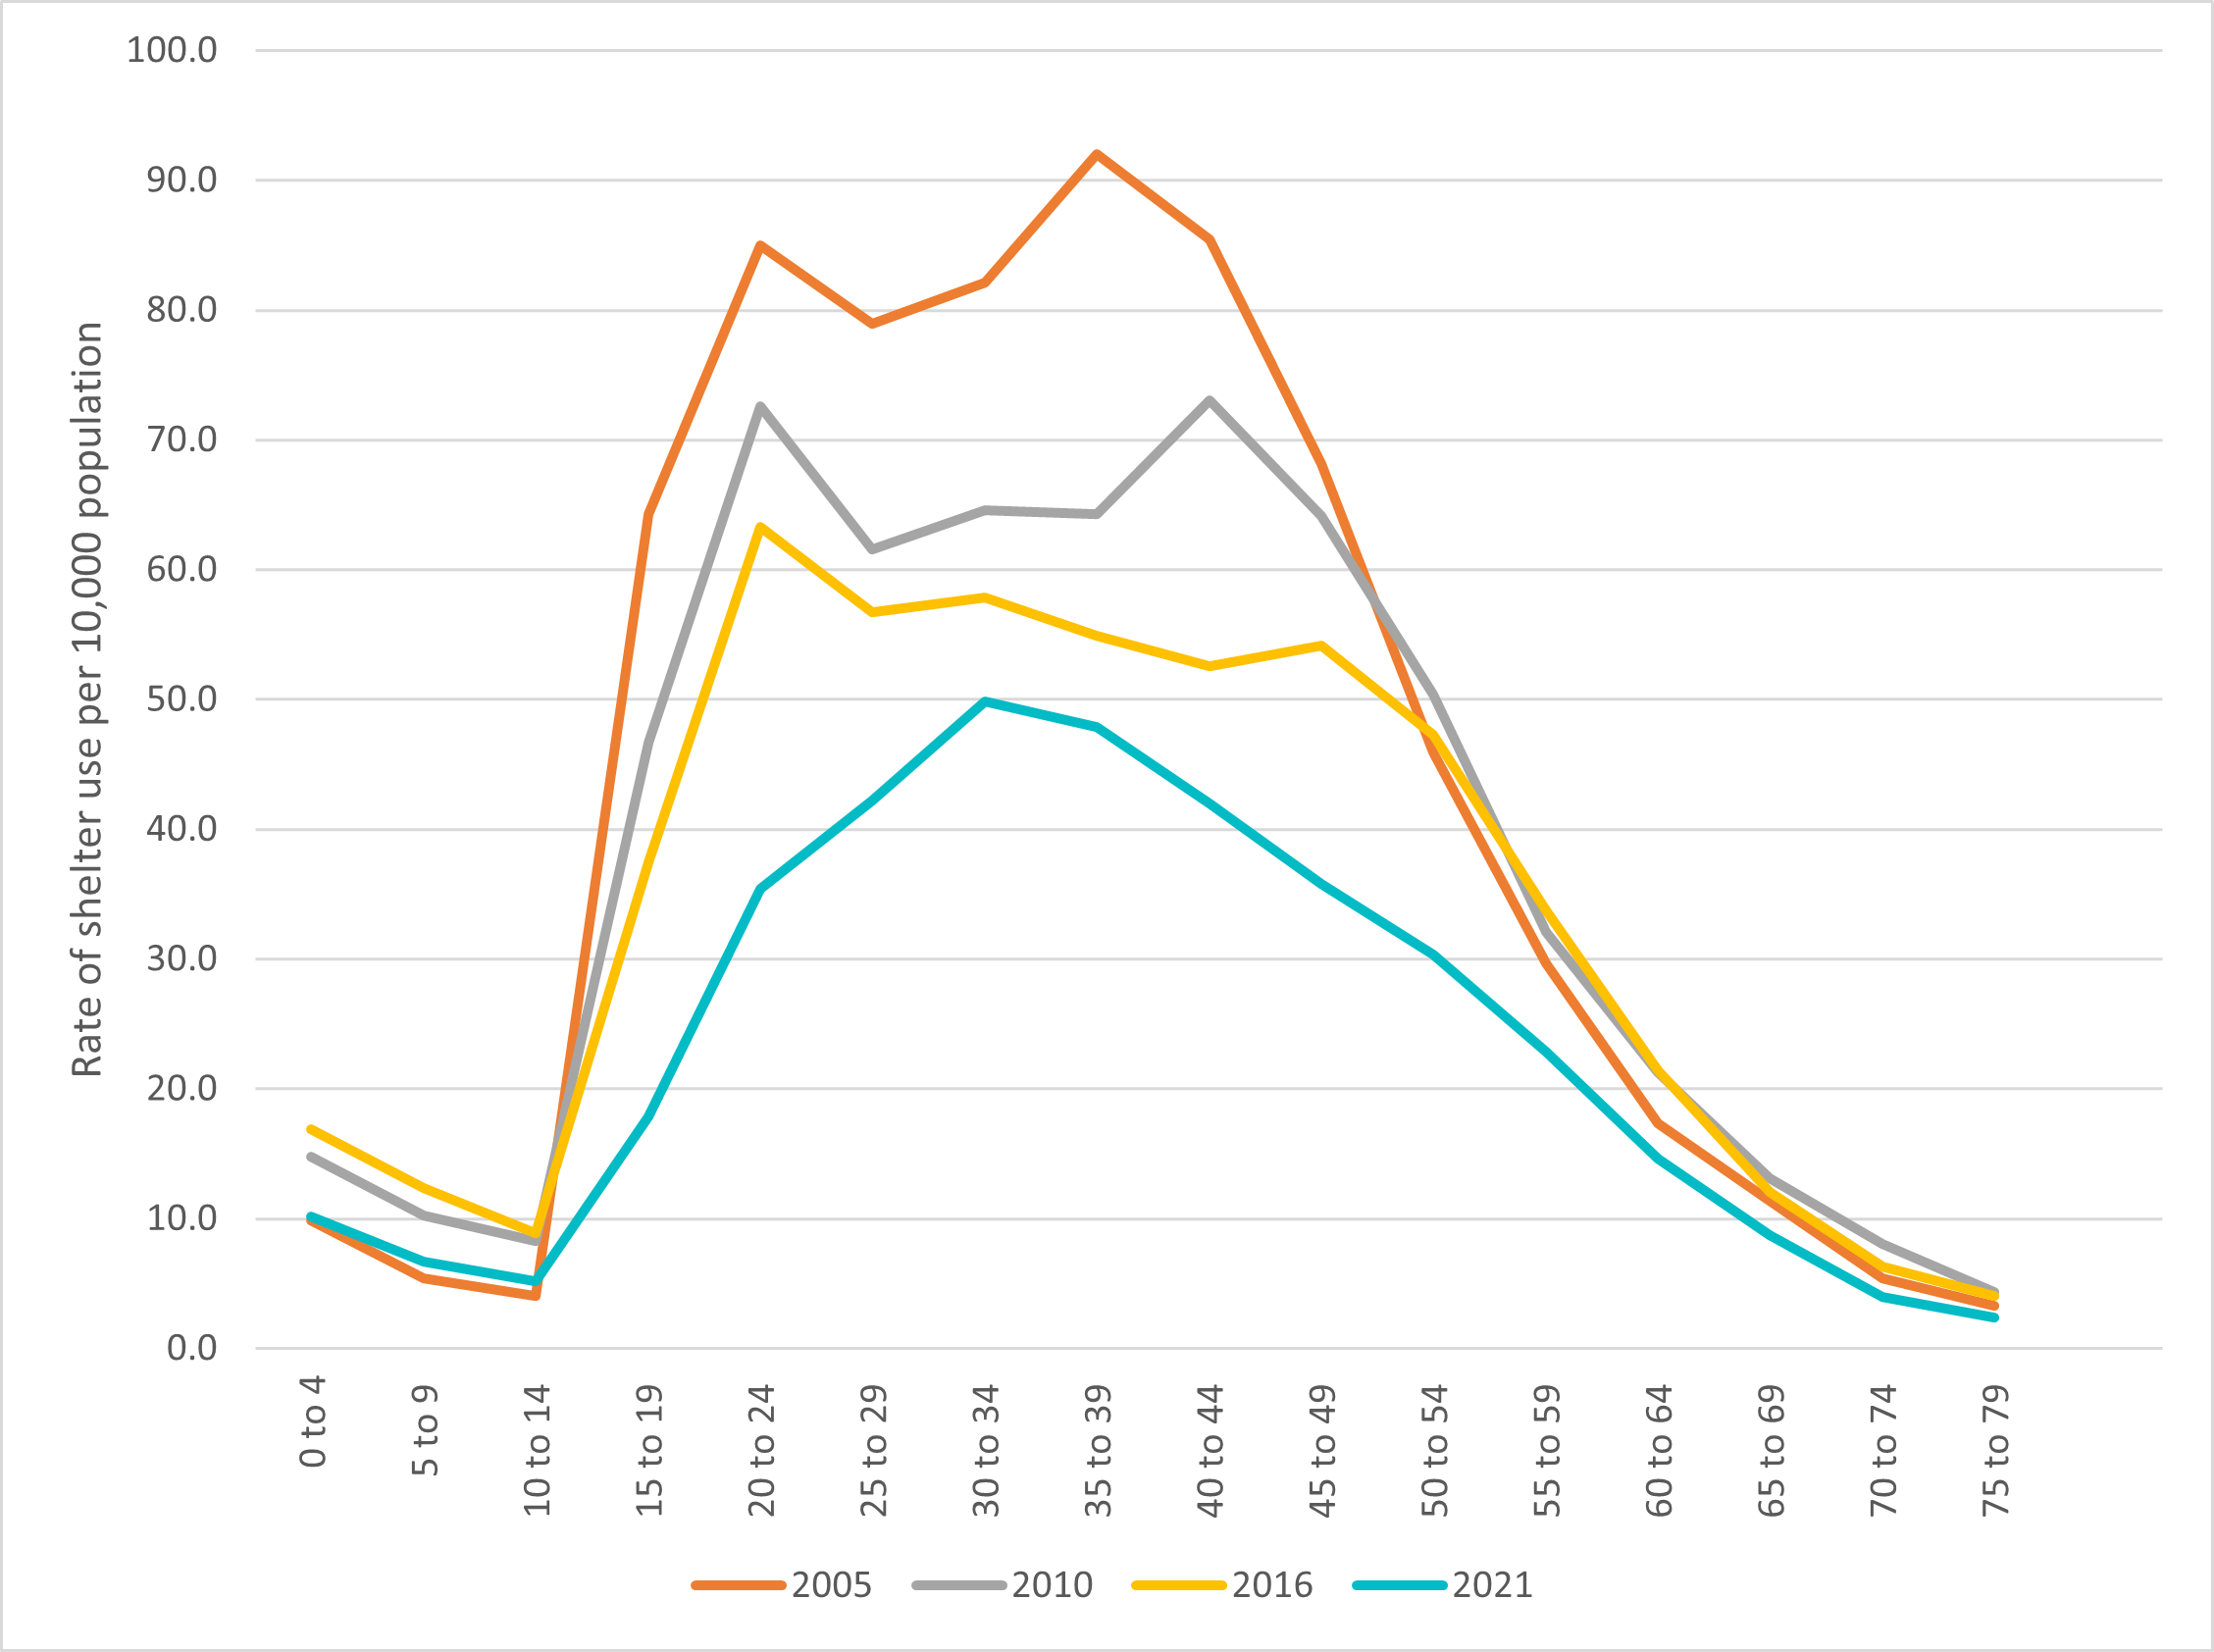
Another way to look at shelter use trends is to look at the rates of homelessness for various age categories compared to the Canadian population over time. Looking at the rate of shelter use by age controls for changes in the age composition of the Canadian population. Figure 9 shows how shelter use trends by age have changed over time. There were decreases in the rates of shelter use for all age groups between 2005 and 2021, with the exception of children under the age of 15. In 2021, the rate of shelter use among children aged 0 to 14 was slightly higher compared to 2005. This is possibly the result of an increased number of family shelter beds over this time period.
The shape of the age specific rates of shelter use graph follows a similar pattern in 2005, 2010 and 2016, but it changes in 2021. In previous years, the rate of homelessness spiked for older youth (aged 20 to 24) and we can see a cohort effect for individuals born between 1966 and 1970 with spikes in rates of shelter use for 35-39 year olds in 2005, 40 to 44 year olds in 2010, and 45 to 50 year olds in 2016. However, in 2021, while there was still an increase in rate of shelter use among 20 to 24 year olds, the effect was less pronounced compared to previous years. Instead, the highest rate of shelter use were among those aged 30 to 34 (49.8 per 10,000). This pattern shift may have been the consequence of pandemic responses such as eviction moratoria and pandemic supports as well as drops in permanent emergency shelter use among age groups that were considered to be at high risk of negative COVID-19 effects.
Figure 9: Age specific rates of shelter use per 10,000 population (2005, 2010, 2016 & 2021)
-
Figure 9 - Text version
Figure 9. Age specific rates of shelter use per 10,000 population (2005, 2010, 2016 & 2021) Age Group
Rate of shelter use per 10,000 population 2005
Rate of shelter use per 10,000 population 2010
Rate of shelter use per 10,000 population 2016
Rate of shelter use per 10,000 population 2021
0 to 4
9.8
14.8
16.9
10.2
5 to 9
5.4
10.3
12.3
6.7
10 to 14
4.1
8.2
8.8
5.1
15 to 19
64.2
46.6
37.5
17.9
20 to 24
85.0
72.6
63.3
35.4
25 to 29
78.9
61.6
56.7
42.2
30 to 34
82.1
64.6
57.9
49.8
35 to 39
92.0
64.3
54.9
47.9
40 to 44
85.5
73.0
52.6
41.9
45 to 49
68.1
64.1
54.2
35.8
50 to 54
45.9
50.4
47.3
30.3
55 to 59
29.7
32.1
33.8
22.9
60 to 64
17.3
21.2
21.4
14.6
65 to 69
11.4
13.1
12.1
8.7
70 to 74
5.4
8.1
6.3
4.0
75 to 79
3.2
4.3
4.0
2.4
Citizenship
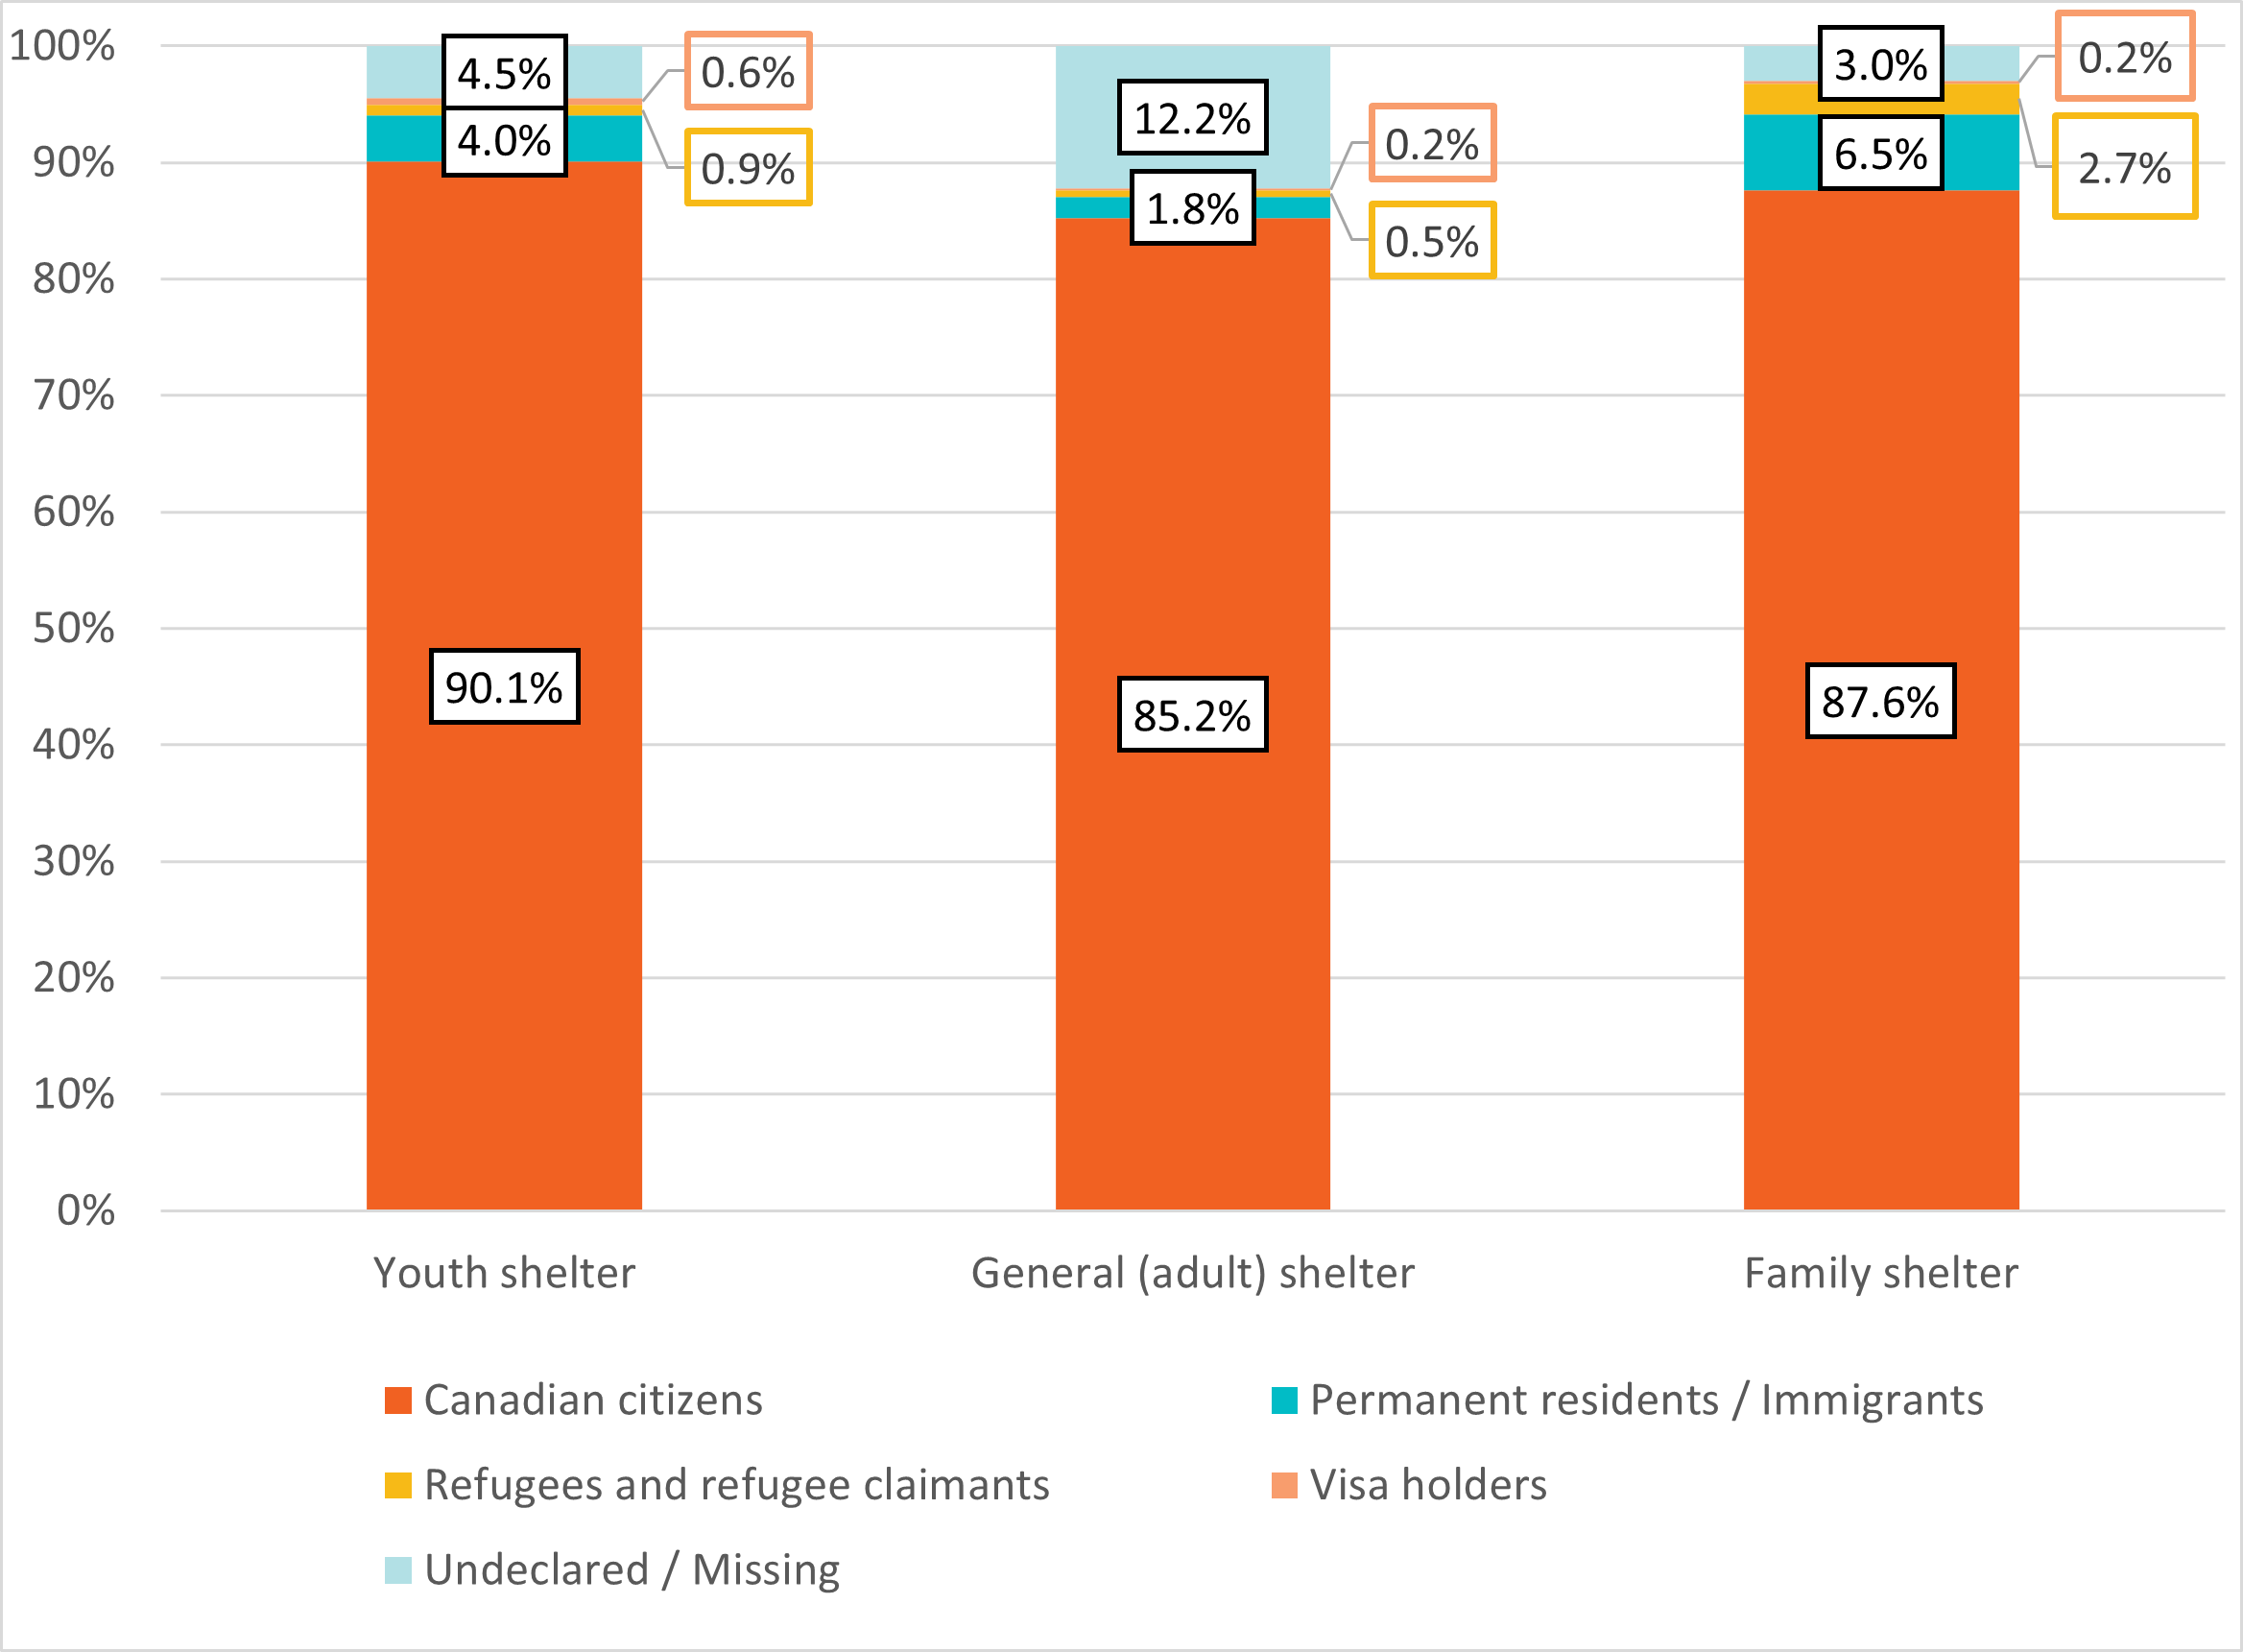
In 2021, the majority (85.8%) of shelter users were Canadian citizens. This was observed for every year between 2015 and 2021.
In 2021, non-citizens (refugees and refugee claimants, permanent residents/immigrants and visa holders) were most prevalent in family shelters (9.4%) compared to youth shelters (5.5%) and adult shelters (2.5%) (Figure 10).
Figure 10: Distribution of citizenship status by shelter type (2021)
-
Figure 10 - Text version
Figure 10. Distribution of citizenship status by shelter type (2021) Shelter type
Canadian citizens
Permanent residents / Immigrants
Refugees and refugee claimants
Visa holders
Undeclared / Missing
Youth shelter
90.1%
4.0%
0.9%
0.6%
4.5%
General (adult) shelter
85.2%
1.8%
0.5%
0.2%
12.2%
Family shelter
87.6%
6.5%
2.7%
0.2%
3.0%
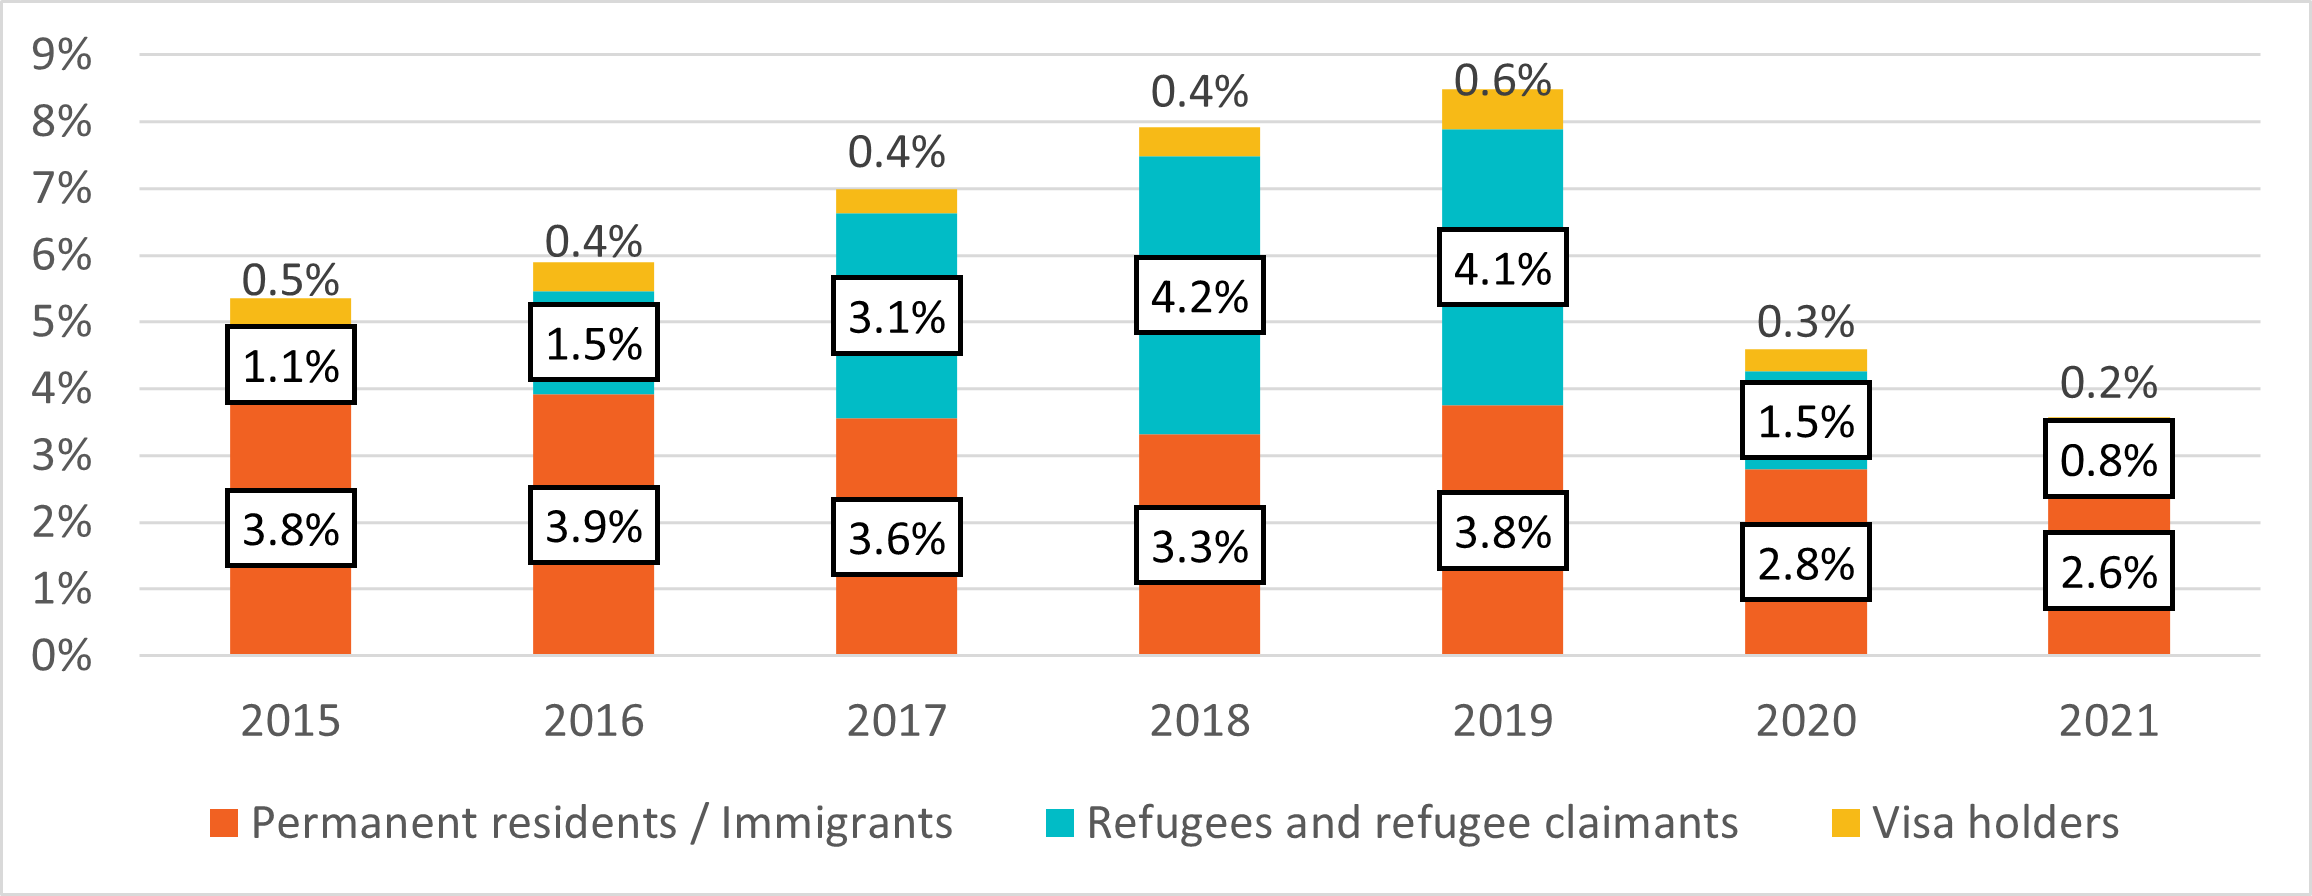
Between 2015 and 2019 there was a steady increase in the proportion of permanent residents and refugees, followed by a sharp decrease in 2020 and 2021 (Figure 11). The decline was likely partially due to border closures and a drop in irregular border crossings in 2020Footnote 4, resulting in a reduction in the inflow of refugee claimants. Access to increased pandemic supports may also have contributed to the reduction in refugees and permanent residents accessing shelter services. In 2021, the proportion of the shelter-using population represented by non-citizens was 3.6%, compared to 8.5% in 2019.
Figure 11: Change in proportion of non-citizen shelter users from 2015 to 2021
-
Figure 11 - Text version
Figure 11. Change in proportion of non-citizen shelter users from 2015 to 2021 Year
Permanent residents / Immigrants
Refugees and refugee claimants
Visa holders
2015
3.8%
1.1%
0.5%
2016
3.9%
1.5%
0.4%
2017
3.6%
3.1%
0.4%
2018
3.3%
4.2%
0.4%
2019
3.8%
4.1%
0.6%
2020
2.8%
1.5%
0.3%
2021
2.6%
0.8%
0.2%
Indigenous status
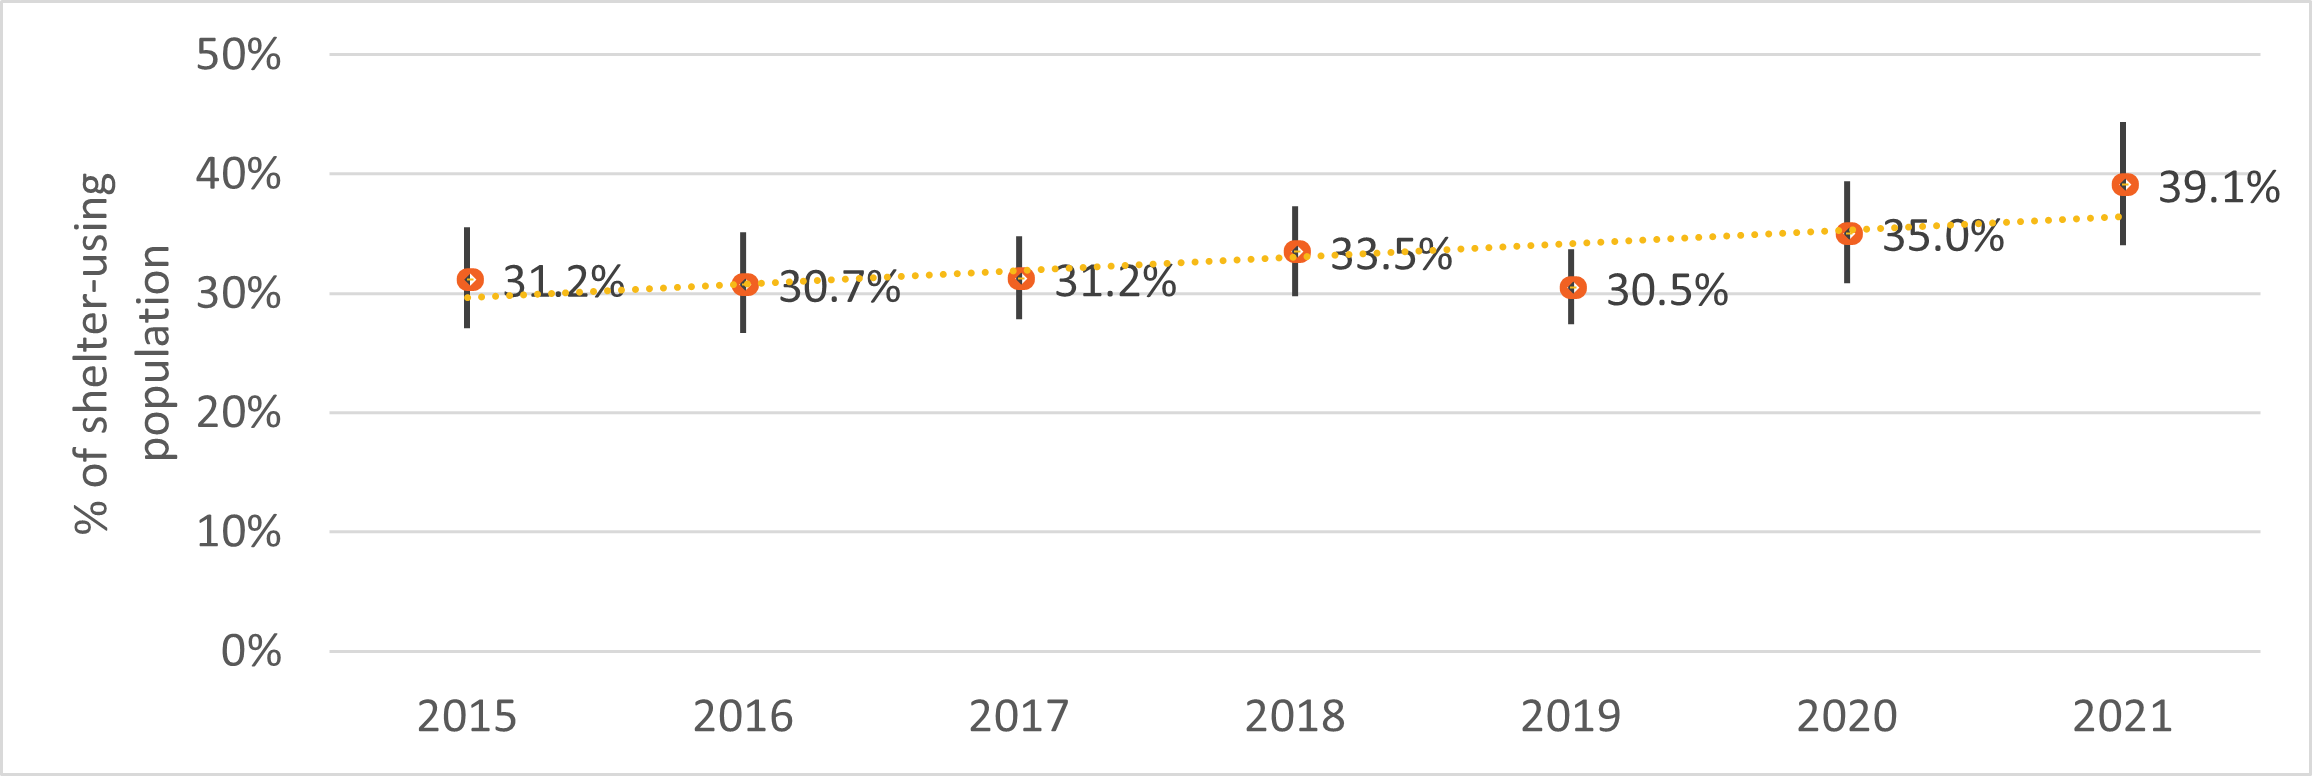
Between 2015 and 2021 there was a point estimate increase in the proportion of Indigenous-identifying shelter users (Figure 12).Footnote 5 However, the 95% confidence intervals overlapped year over year, indicating the trend is inconclusive. It is important to note Indigenous identity may be under-reported due to a disincentive to disclose. For example, some people may not disclose Indigenous status because they have experienced discrimination in social services spaces in the past, or may be concerned that racism in the application of child protection services policies will see them separated from their children.
Figure 12: Proportion of Indigenous-identifying shelter users from 2015 to 2021 with 95% confidence intervals included
-
Figure 12 - Text version
Figure 12: Proportion of Indigenous-identifying shelter users from 2015 to 2021 with 95% confidence intervals included Year
Proportion of shelter users that are Indigenous
Lower confidence interval
Upper confidence interval
2015
31.2%
27.1%
35.6%
2016
30.7%
26.7%
35.1%
2017
31.2%
27.8%
34.8%
2018
33.5%
29.8%
37.3%
2019
30.5%
27.4%
33.7%
2020
35.0%
30.8%
39.4%
2021
39.1%
34.1%
44.3%
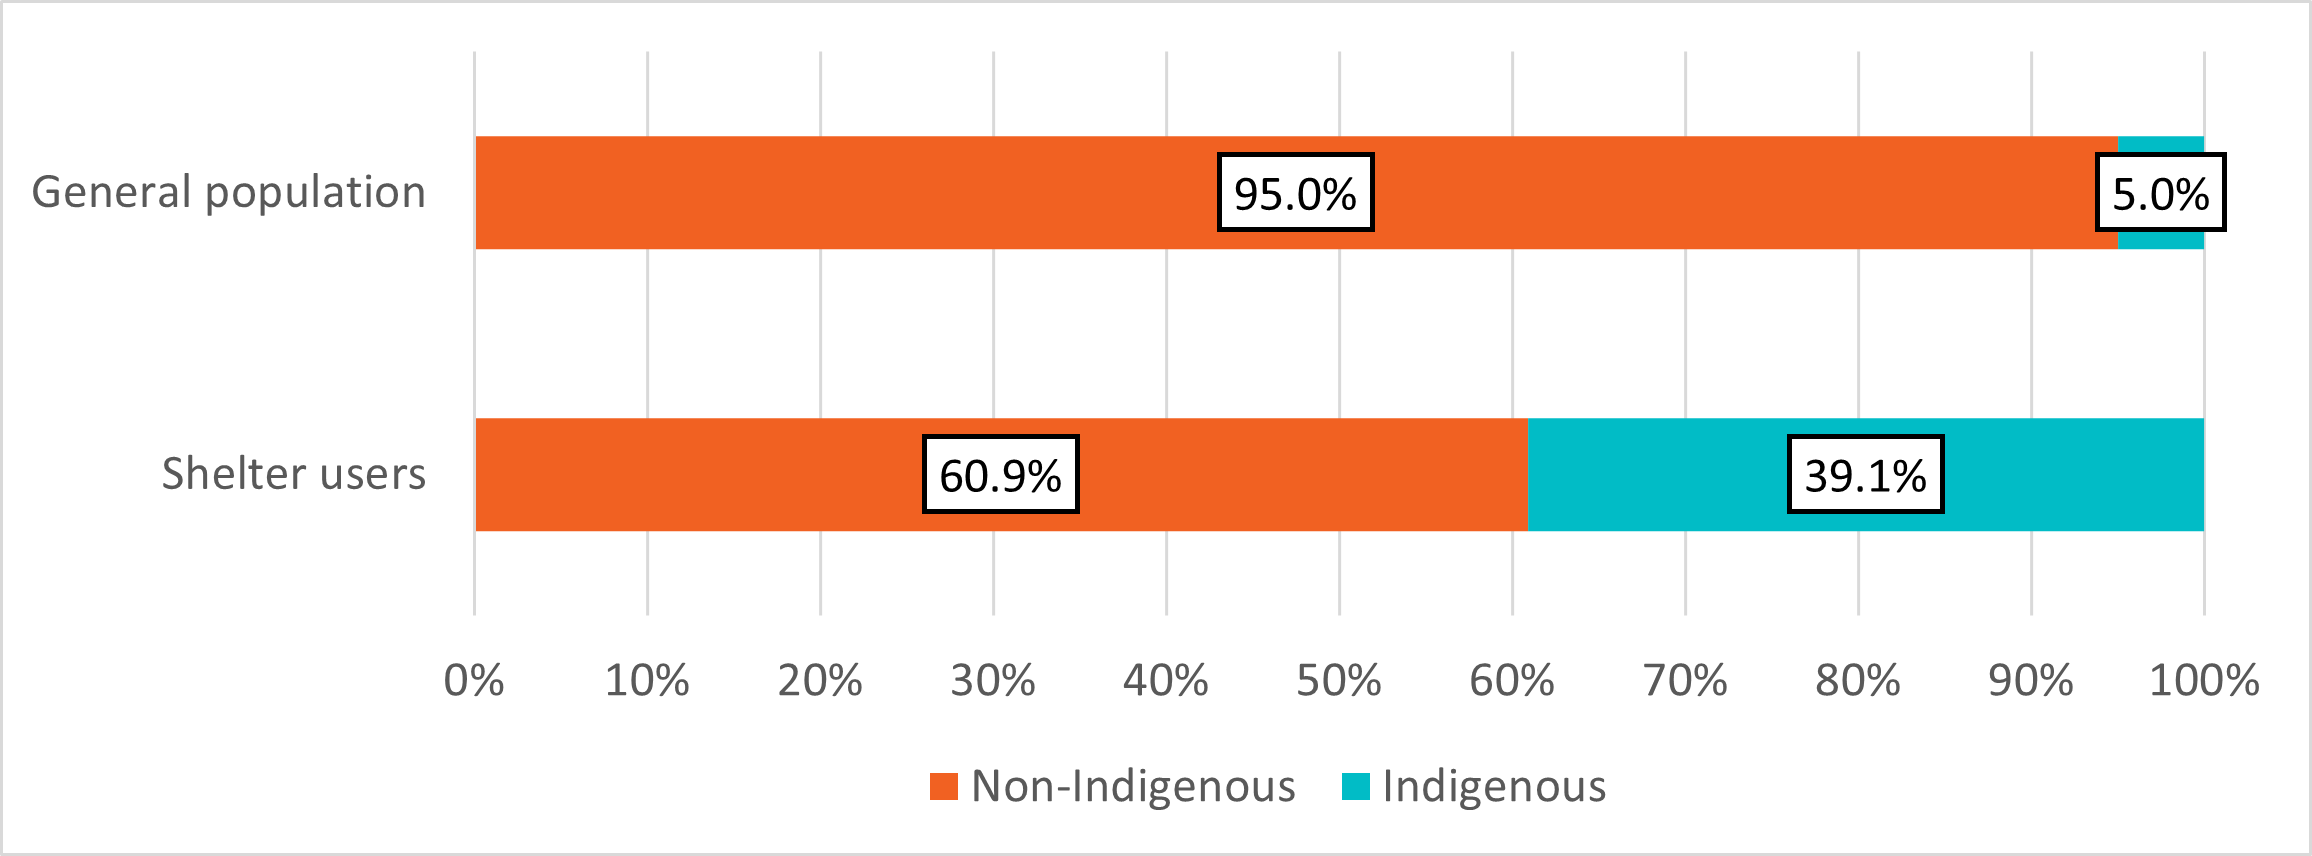
Regardless of year, Indigenous Peoples are overrepresented among shelter users compared to the general population. Indigenous Peoples were more prevalent among shelter users in 2021 (39.1%) compared to their representation among the general populationFootnote 6 (5.0%) (Figure 13).
Figure 13: Proportion of shelter-using population and general population by reported Indigenous status (2021)
-
Figure 13 - Text version
Figure 13. Proportion of shelter-using population and general population by reported Indigenous status (2021) Population
Non-Indigenous
Indigenous
Shelter users
60.9%
39.1%
General population
95.0%
5.0%
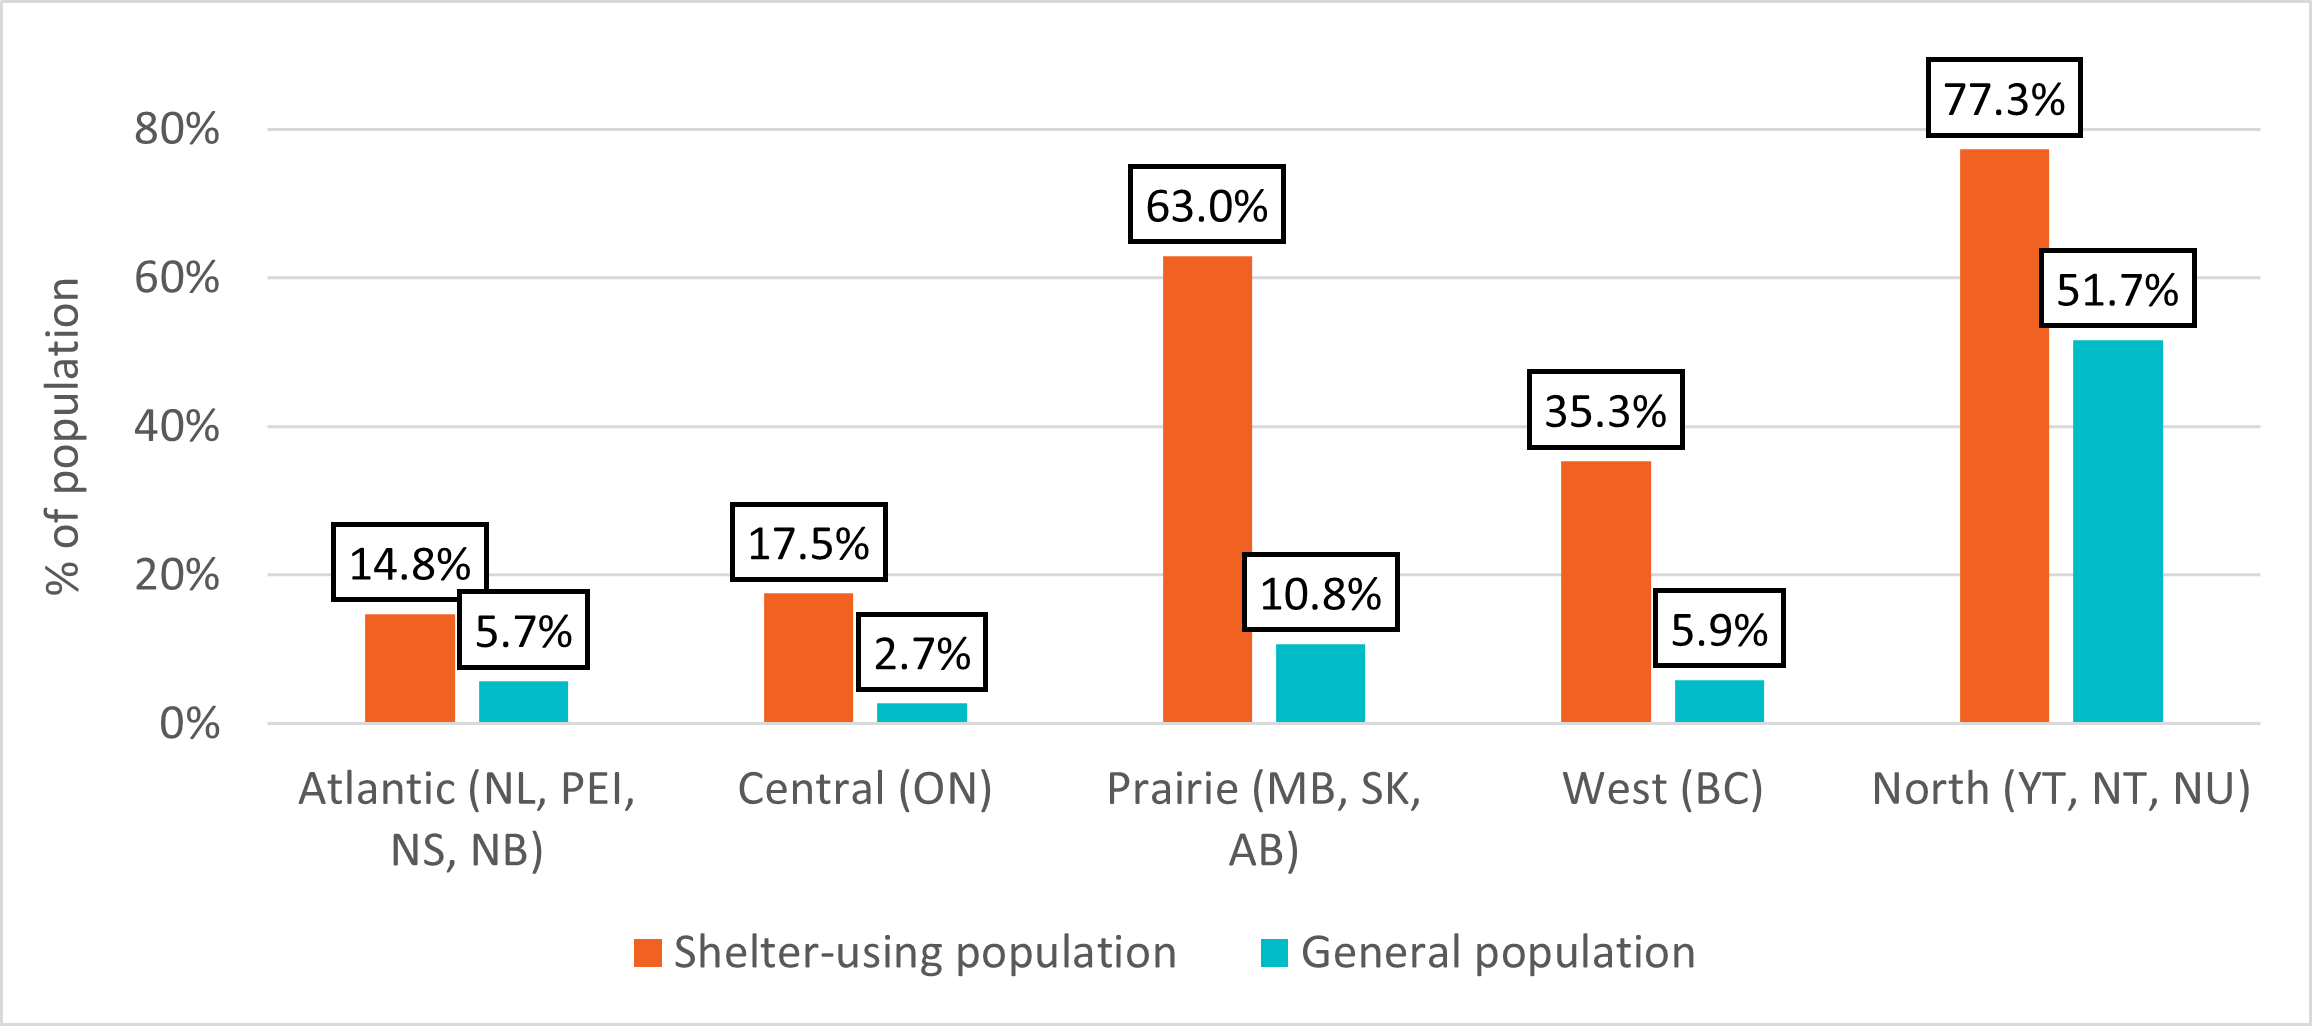
While the prevalence of Indigenous shelter use varied widely by region, Indigenous Peoples were overrepresented in shelters in all regions (Figure 14). Compared to the general population, Indigenous Peoples were most overrepresented in the Prairies (Manitoba, Saskatchewan, Alberta), Western Canada (British Columbia) and in the North (Yukon, Northwest Territories, and Nunavut)Footnote 7.
Figure 14: Representation of Indigenous-identifying shelter users, by region (2021)
-
Figure 14 - Text version
Figure 14. Representation of Indigenous-identifying shelter users, by region (2021) Region
Shelter-using population
General population
Atlantic (NL, PEI, NS, NB)
14.8%
5.7%
Central (ON)
17.5%
2.7%
Prairie (MB, SK, AB)
63.0%
10.8%
West (BC)
35.3%
5.9%
North (YT, NT, NU)
77.3%
51.7%
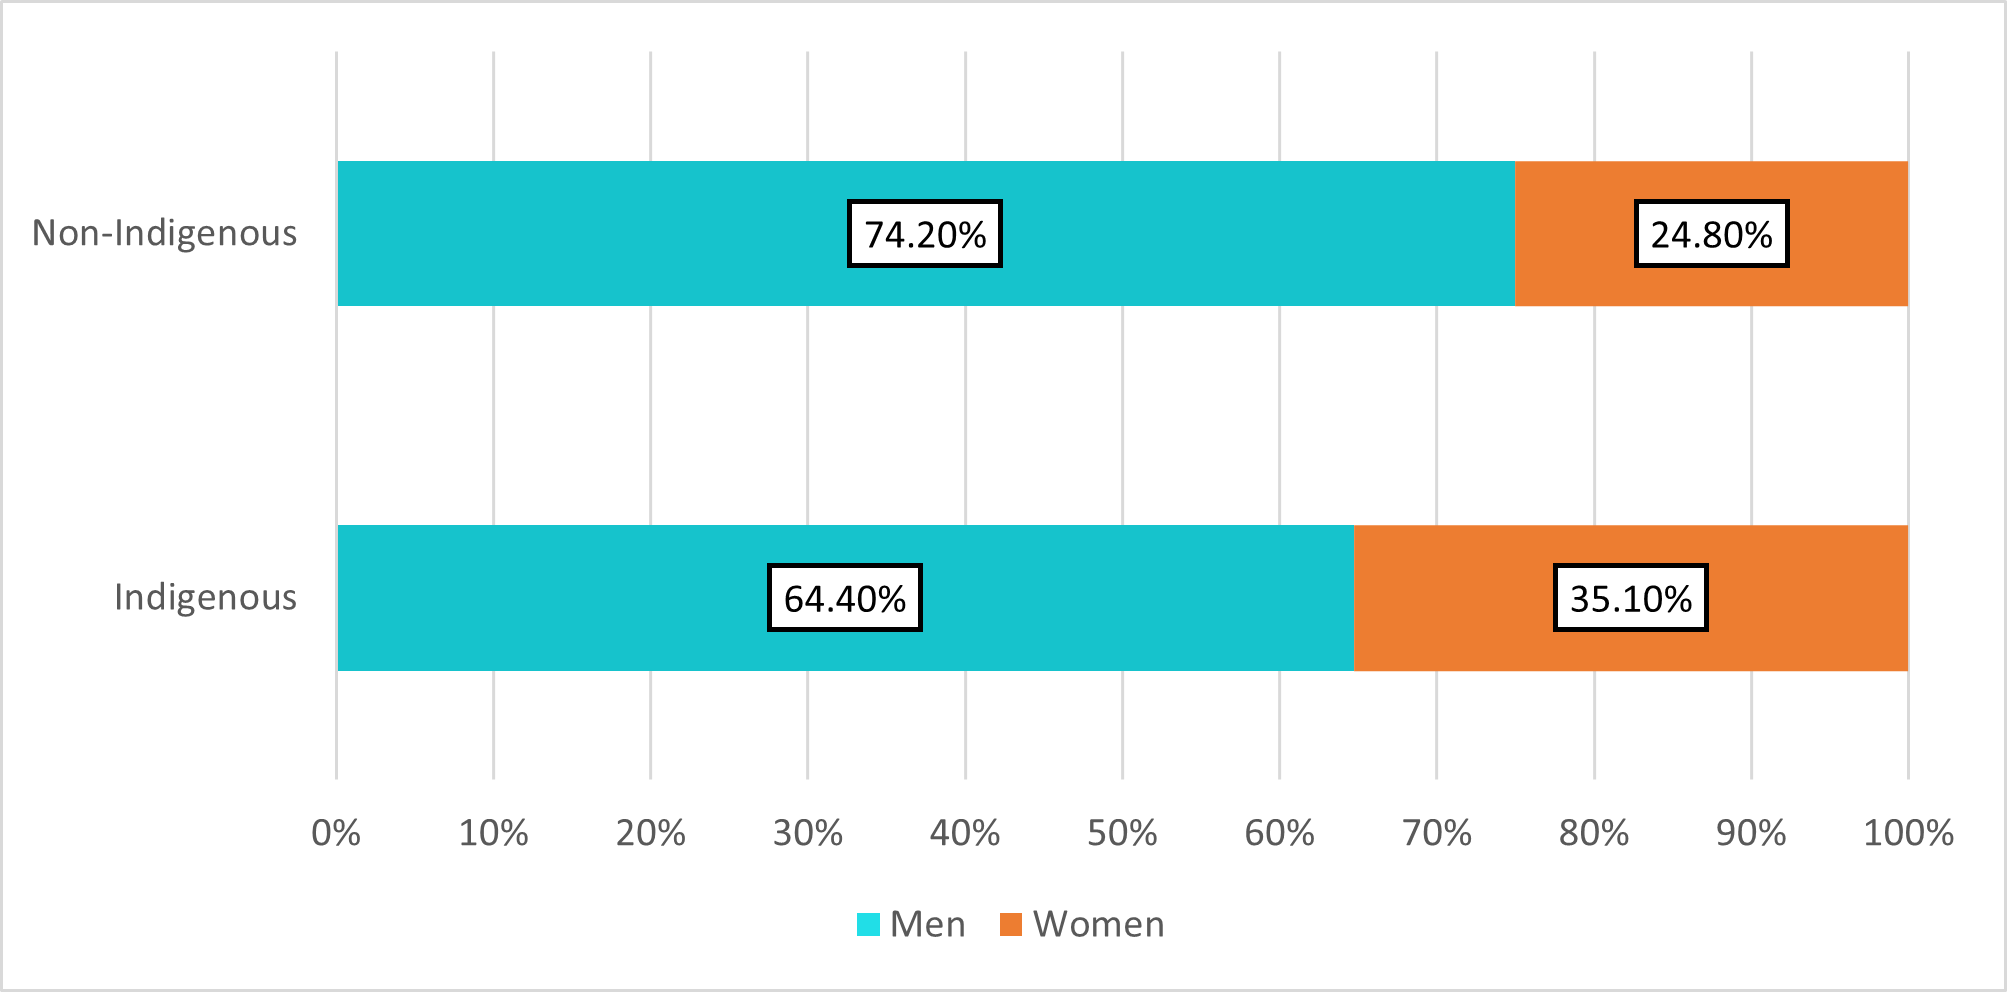
The proportion of women was higher among Indigenous shelter users compared to non-Indigenous shelter usersFootnote 8 (Figure 15). This difference was statistically significant.
Figure 15: Gender distribution among Indigenous and non-Indigenous shelter users (2021)
-
Figure 15 - Text version
Figure 15. Gender distribution in 2021 comparing Indigenous and non-Indigenous shelter users (2021) Indigenous status
Men
Women
Indigenous
64.4%
35.1%
Non-Indigenous
74.2%
24.8%
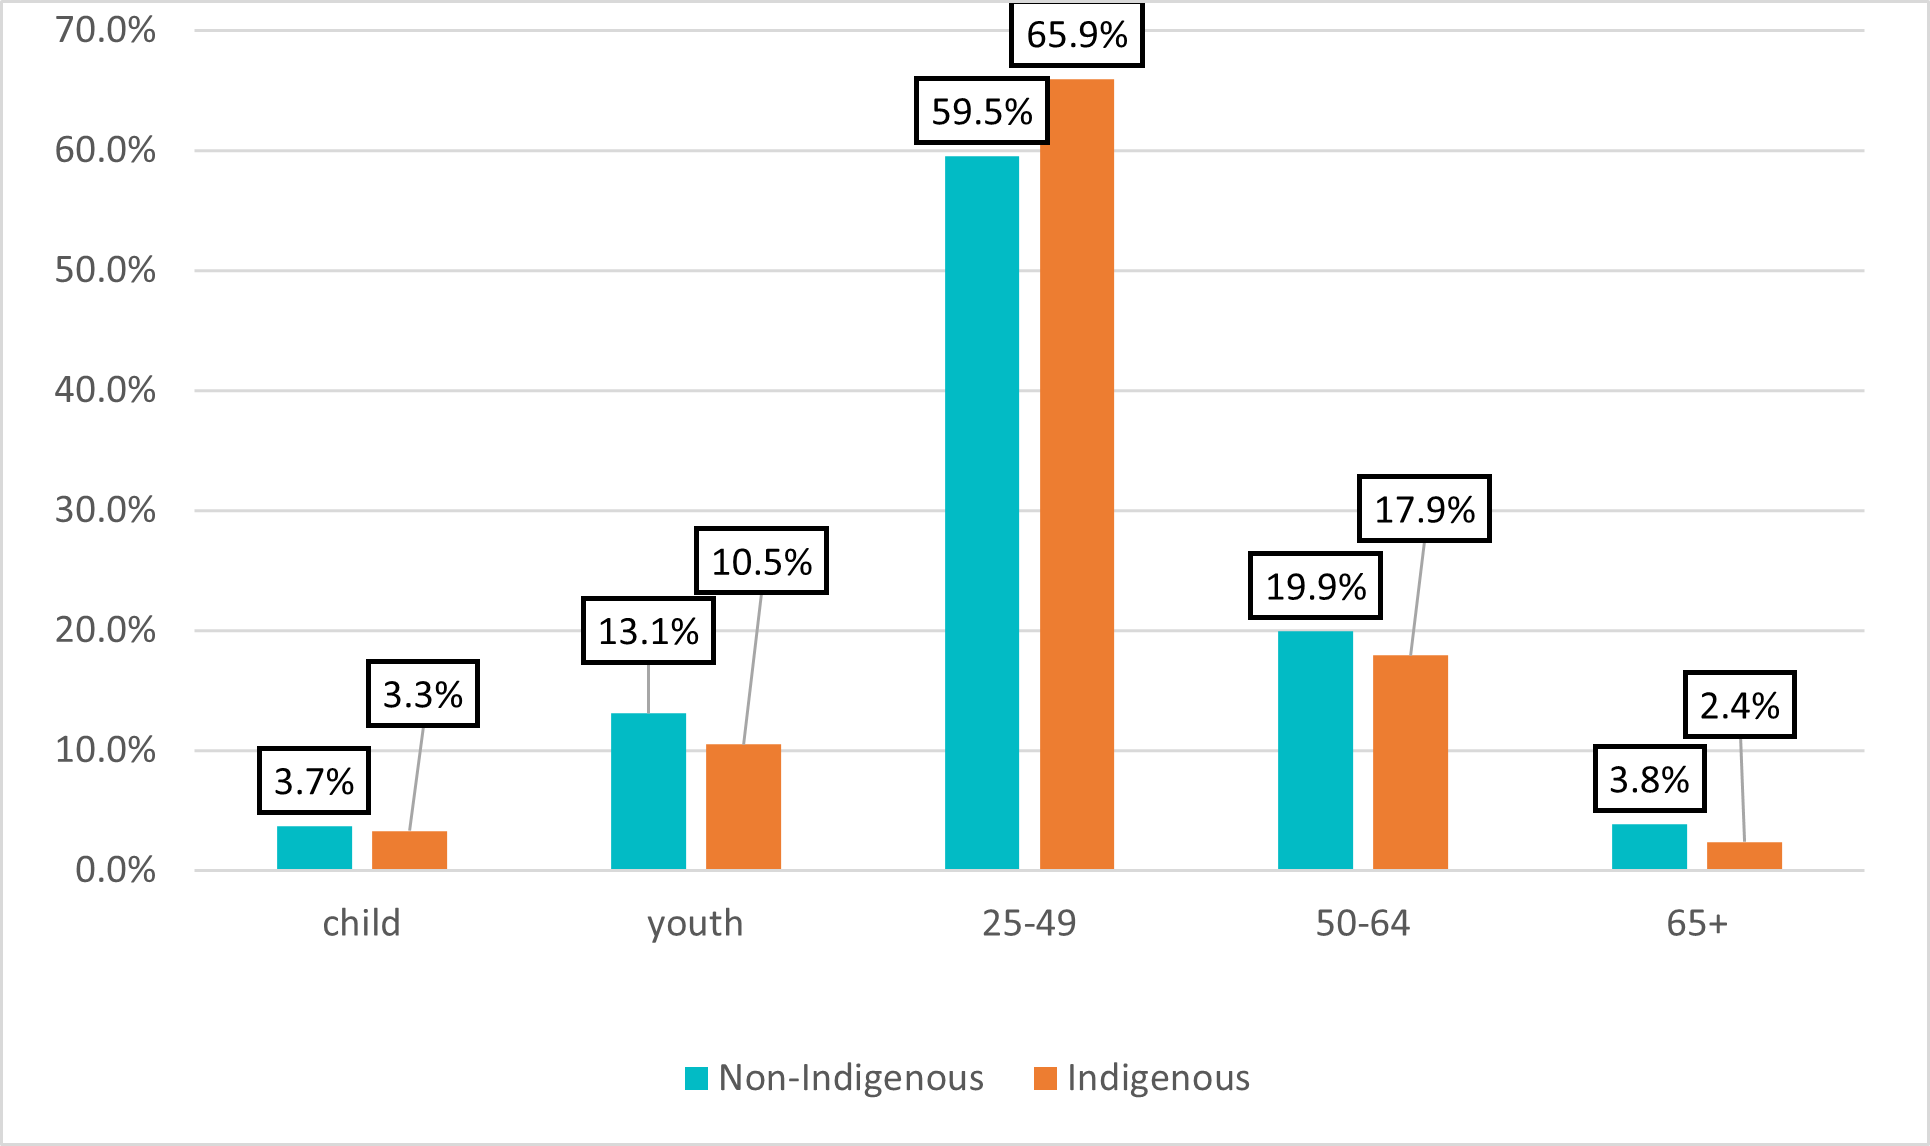
Age and shelter use trends were similar between non-Indigenous and Indigenous shelter users (Figure 16). The only groups where there was a statistically significant difference were among those aged 25-49, where there was a higher proportion among Indigenous (65.9%) shelter users compared to non-Indigenous (59.5%), and among seniors where there was a lower proportion among Indigenous (2.4%) shelter users compared to non-Indigenous (3.8%).
Figure 16: Age distribution comparing Indigenous and non-Indigenous shelter users (2021)
-
Figure 16 - Text version
Figure 16. Age distribution comparing Indigenous and non-Indigenous shelter users (2021) Indigenous status
child
youth
25-49
50-64
65+
Indigenous
3.3%
10.5%
65.9%
17.9%
2.4%
Non-Indigenous
3.7%
13.1%
59.5%
19.9%
3.8%
After controlling for the effects of ageFootnote 9, shelter use among Indigenous Peoples was 10.7 times higher than shelter use among non-Indigenous people. This disparity was found among all age groups, though it was more pronounced among adults aged 25 and over (Table 2). The highest rates of shelter use in 2021 occurred among adults aged 25 to 54 in both Indigenous and non-Indigenous groups. Overall, in 2021, Indigenous Peoples used shelters at a rate of 17.7 people per 1,000 population while non-Indigenous people used shelters at a rate of 1.7 people per 1,000 population.
| Age Group |
Indigenous age-standardized rate of shelter use per 1,000 |
Non-Indigenous age-standardized rate of shelter use per 1,000 |
Age-standardized rate ratio |
|---|---|---|---|
|
0 to 14 |
2.1 |
0.3 |
6.2 |
|
15 to 24 |
11.5 |
2.0 |
5.9 |
|
25 to 34 |
34.6 |
3.1 |
11.1 |
|
35 to 44 |
37.4 |
3.1 |
12.0 |
|
45 to 54 |
27.4 |
2.2 |
12.3 |
|
55 to 64 |
14.9 |
1.4 |
10.8 |
|
65+ |
4.2 |
0.3 |
12.3 |
|
Overall |
17.7 |
1.7 |
10.7 |
Table 3 shows the overall age-standardized rate of shelter use per 1,000 population among Indigenous Peoples and non-Indigenous people between 2017 and 2021. While the rate of shelter use dropped for both groups over this time, the drop was less among Indigenous Peoples (26.2%) compared to non-Indigenous people (32.2%).
Table 3 also shows the year-over-year changes in relative rate of shelter use for Indigenous vs. non-Indigenous persons. Between 2019 and 2020, there was an increase in disparity between groups with regard to shelter use (+2.13 shelter use rate ratio). This indicates the pandemic may have disproportionately affected Indigenous Peoples.
| Year |
Indigenous age-standardized rate of shelter use per 1,000 |
Non-Indigenous age-standardized rate of shelter use per 1,000 |
Age-standardized rate ratio |
Year-over-year difference in shelter use rate ratio |
|---|---|---|---|---|
|
2017 |
25.1 |
2.7 |
9.3 |
- |
|
2018 |
25.8 |
2.5 |
10.3 |
+1.07 |
|
2019 |
20.7 |
2.4 |
8.6 |
-1.72 |
|
2020 |
17.9 |
1.7 |
10.8 |
+2.13 |
|
2021 |
17.7 |
1.7 |
10.7 |
-0.01 |
Veteran status
In 2021, approximately 1.4% of the shelter-using population were VeteransFootnote 10. This is consistent with the estimated overall proportion of Veterans in Canada (1.7%)Footnote 11, suggesting Veterans are not overrepresented among shelter users.
| Year |
Total estimated number of shelter users |
Estimated proportion of Veterans |
Total estimated number of Veterans |
|---|---|---|---|
|
2015 |
132,511 |
1.9% |
2,490 |
|
2016 |
129,127 |
1.8% |
2,340 |
|
2017 |
129,017 |
1.9% |
2,392 |
|
2018 |
122,914 |
1.8% |
2,179 |
|
2019 |
118,759 |
1.6% |
1,905 |
|
2020 |
88,342 |
1.5% |
1,368 |
|
2021 |
93,529 |
1.4% |
1,286 |
While Table 4 shows a steady downward trend in the number of Veterans accessing shelters between 2015 (2,490) and 2021 (1,286), the difference in proportion from previous years is not statistically significant (Figure 17).
Figure 17: Proportion of veteran shelter users from 2015 to 2021 with 95% confidence intervals included
-
Figure 17 - Text version
Figure 17. Proportion of veteran shelter users from 2015 to 2021 Year
Proportion of shelter users that are Veterans
Lower confidence interval
Upper confidence interval
2015
1.9%
1.6%
2.1%
2016
1.8%
1.6%
2.0%
2017
1.9%
1.6%
2.2%
2018
1.8%
1.5%
2.0%
2019
1.6%
1.4%
1.8%
2020
1.5%
1.3%
1.9%
2021
1.4%
1.2%
1.7%
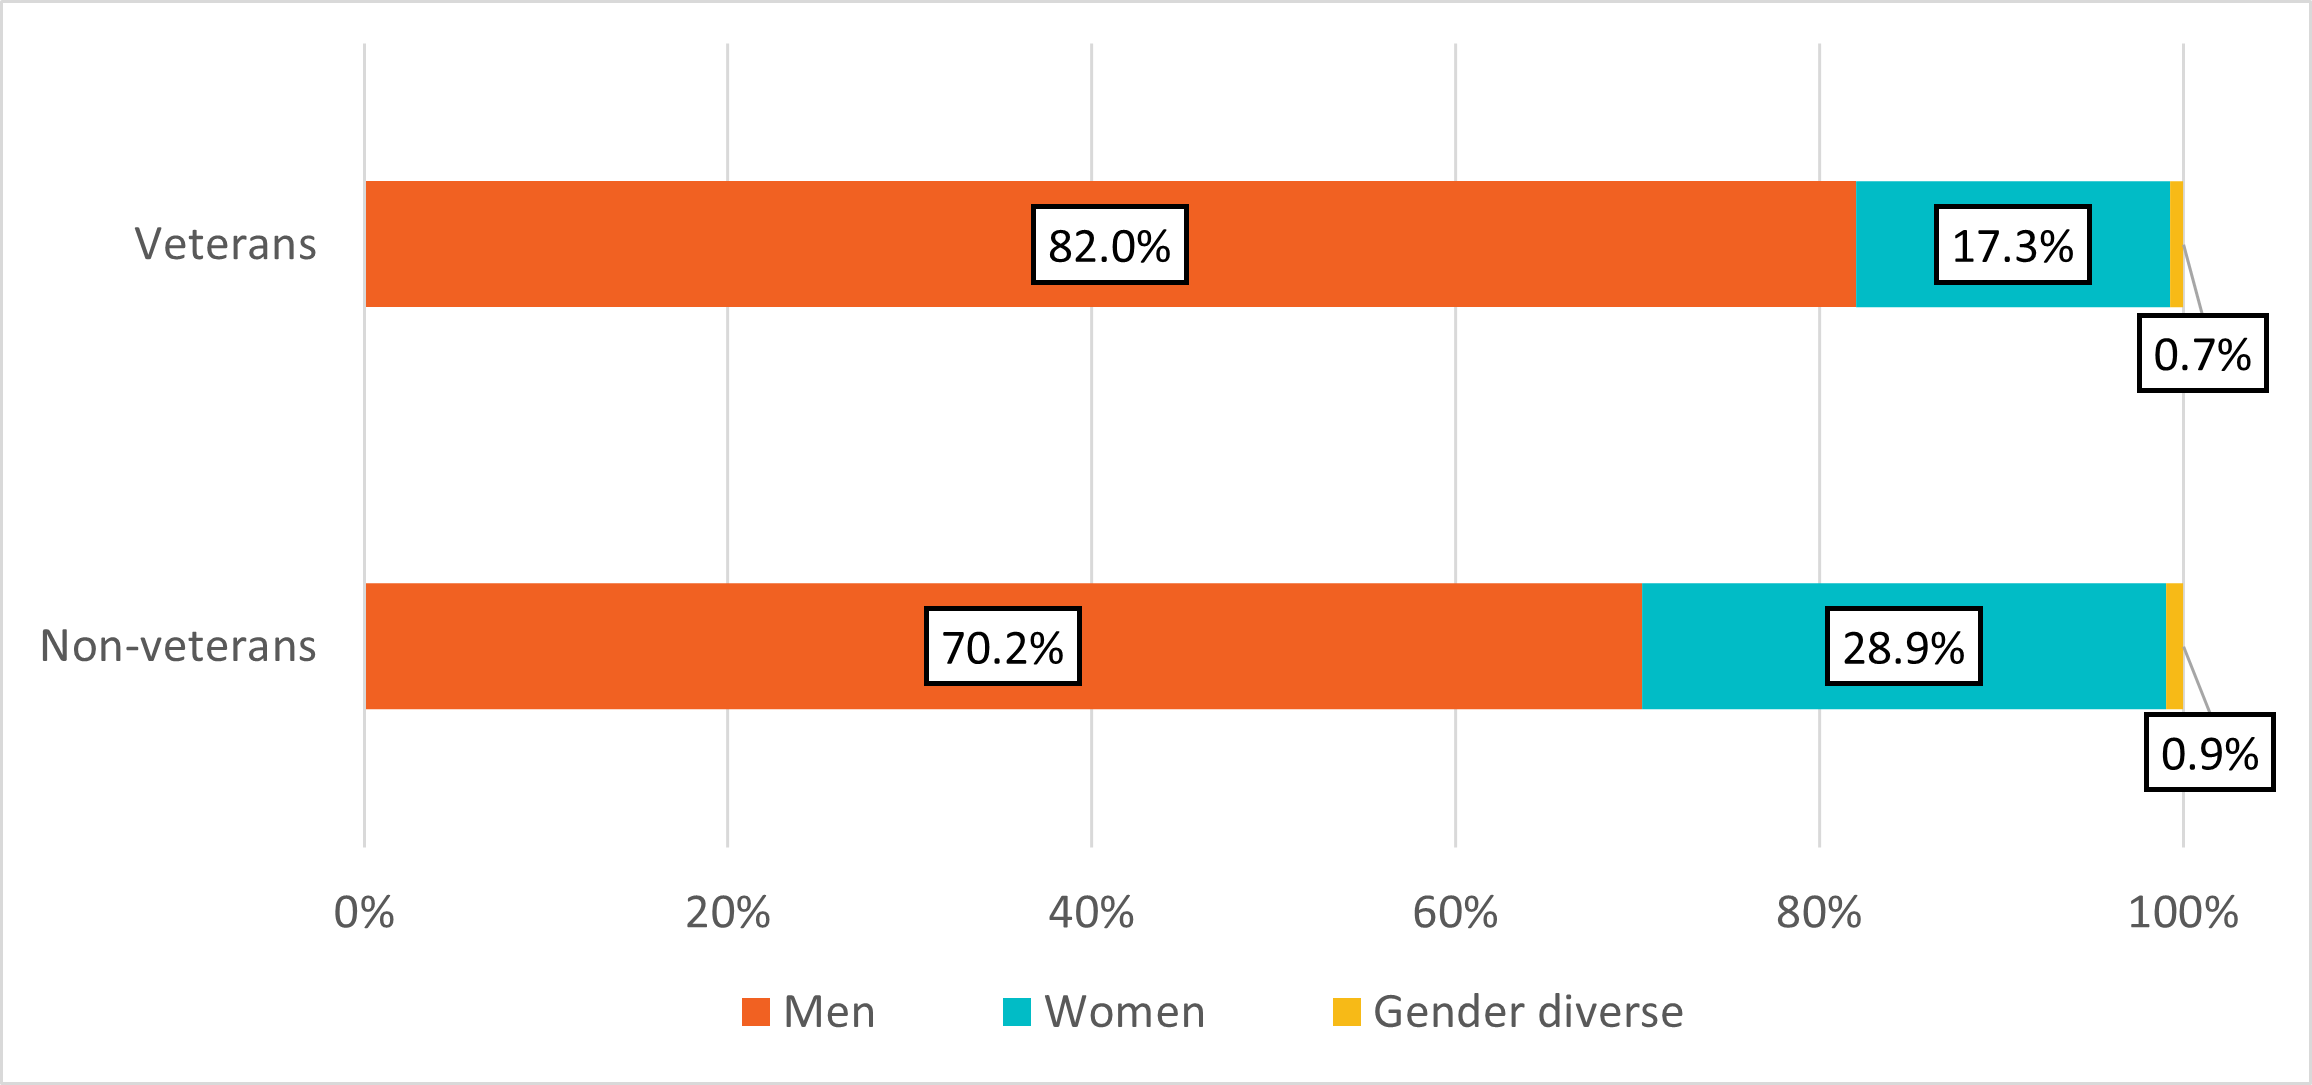
While men were over-represented among the overall shelter population, this was especially pronounced among veteran shelter users (82.0% men, 17.3% women) (Figure 18).
Figure 18: Gender distribution comparing veteran and non-veteran shelter users (2021)
-
Figure 18 - Text version
Figure 18. Gender distribution comparing veteran and non-veteran shelter users (2021) Gender
Non-veterans
Veterans
Men
70.2%
82.0%
Women
28.9%
17.3%
Gender diverse
0.9%
0.7%
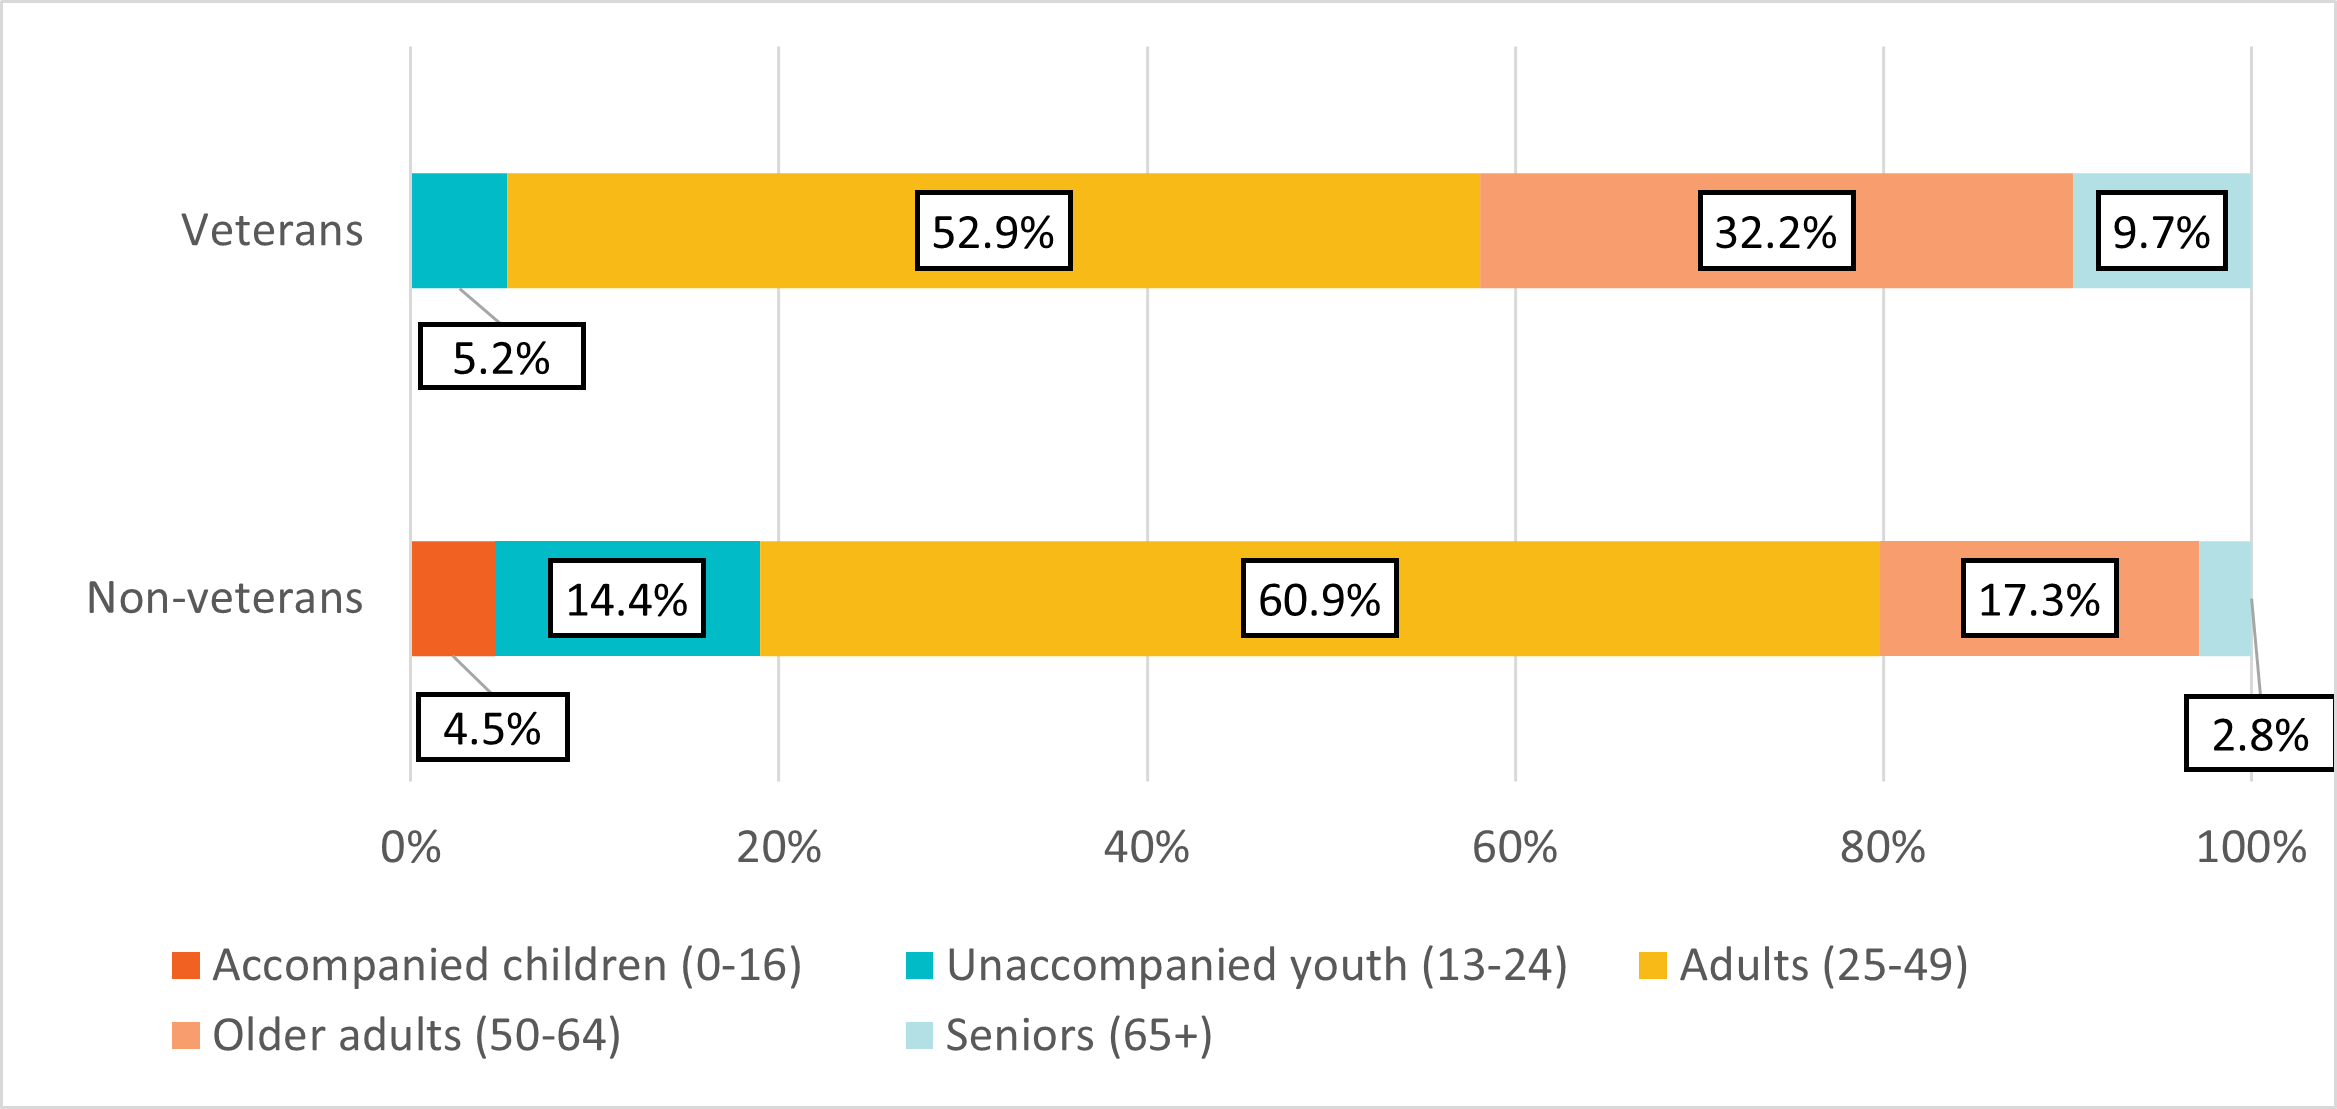
Veteran shelter users tended to be older on average (45.9 years) compared to non-Veterans (37.5 years). The proportion of older adults and seniors among veterans was higher than that of non-veteran shelter users (Figure 19).
Figure 19: Age distribution comparing veterans and non-veterans shelter users (2021)
-
Figure 1 - Text version
Figure 19. Age distribution comparing veterans and non-veteran shelter users (2021) Age Group
Non-veterans
Veterans
Accompanied children (0-16)
4.5%
0.0%
Unaccompanied youth (13-24)
14.4%
5.2%
Adults (25-49)
60.9%
52.9%
Older adults (50-64)
17.3%
32.2%
Seniors (65+)
2.8%
9.7%
Conclusion
The findings in this report provide a comprehensive overview of emergency shelter use trends in Canada between 2005 and 2021, with particular attention paid to the impact of the COVID-19 pandemic in 2020 and 2021. This report offers important insights into the evolving demographics of shelter users in Canada, including changing gender dynamics, shifts in age distribution, variations in citizenship status, a significant overrepresentation of Indigenous Peoples among shelter users, and trends in shelter use among Veterans. Understanding these demographic patterns is crucial for developing targeted policies and interventions to address homelessness in Canada.
Annex A – Detailed Methodology
The National Shelter Study employed a stratified cluster sample design, where the primary sampling units were emergency shelters. The analysis was designed to obtain accurate estimates of gender, age and other demographic characteristics, as well as occupancy rates at the national level to determine the overall pressure on the shelter system.
Sampling frame
Within the homeless shelter system there are several service subtypes, which were identified and defined through the analysis of shelter data including length of stay, turnover rates, number of stays per year, target population, as well as operational period, to classify services into distinct categories. (Table 5)
Shelter subtypes |
Length of stay |
Turnover rate |
Number of stays |
Target population |
Operational period |
Assumed Capacity |
Availability of national-level data |
|---|---|---|---|---|---|---|---|
|
Permanent emergency |
Generally short (<30 days) |
high |
Many clients with multiple stays |
Homeless population |
Year-round |
Previously fixed, but variable in 2020 |
Good |
|
Temporary emergency |
Generally short (<30 days) |
high |
Many clients with multiple stays |
Homeless population |
Operational only during periods of extreme weather and high demand. Also includes locations that were opened temporarily during the COVID-19 pandemic. |
Variable |
Poor |
|
Transitional housing |
Generally long (>30 days) |
medium |
Few clients with multiple stays |
Homeless population |
Year-round |
Fixed |
Poor |
|
Domestic violence |
Generally short (<30 days) |
high |
Few clients with multiple stays |
People fleeing domestic violence |
Year-round |
Fixed |
Poor |
|
Immigrant and refugee shelters |
Generally short (<30 days) |
high |
Few clients with multiple stays |
Immigrants and refugees |
Year-round |
Fixed |
Poor |
The National Shelter Study uses data from permanent emergency homeless shelters due to the good availability of data from these services at a national level. Domestic violence shelters, transitional housing, temporary shelters, and immigrant and refugee shelters were excluded due to lack of data.
Each client stay in the dataset was associated with an emergency shelter. The entries were supplemented by additional information from the National Service Provider List, which is maintained by Infrastructure Canada. This information includes capacity, location, target clientele and gender(s) served. In order to accurately capture demographics and stay patterns, shelters were further divided based on the gender and clientele served. These became the strata for the stratified cluster sample design (Table 6).
| Strata |
Target clientele |
Gender(s) served |
|---|---|---|
|
1 |
Youth |
MenFootnote 12 |
|
2 |
Youth |
WomenFootnote 12 |
|
3 |
Youth |
All genders |
|
4 |
General |
MenFootnote 12 |
|
5 |
General |
WomenFootnote 12 |
|
6 |
General |
All genders |
|
7 |
Women/women with children |
- |
|
8 |
Families |
- |
Calculating capacity
Capacity was a key part of the study design. It affected sampling and weights (explained further in the section on sample design below). The COVID-19 pandemic presented a unique challenge in this regard. Previous iterations of the analysis assumed a fixed capacity for shelters for the year. However, in 2020, there was a sharp decrease in emergency shelter beds. In order to account for this, the dataset was broken down into months for analysis.
The National Service Provider List collects annual information on permanent emergency shelter beds. Data was collected for two time points in 2020 and for one time point in 2021:
- February 2020 (pre-pandemic)
- August 2020 (early pandemic)
- August 2021 (middle pandemic)
Information on August 2020 capacity was not available for all permanent emergency shelters. For those with missing information, a proxy was calculated. First, the average number of emergency shelter users per night in 2020 was calculated for each service that operated in both 2019 and 2020. This was divided by the average number of emergency shelter users per night in 2019 for each service. Outliers were removed and the geometric mean was taken to obtain a COVID-19 capacity adjustment factor (Equation 1).
Equation 1:
COVID-19 capacity adjustment factor = ![]()
- Where xj is equal to an emergency shelter’s average number of users per night in 2020 divided by the service’s average number of users per night in 2019.
- Where n is equal to the total number of services where ln(xj) is not missing.
The bed numbers reported in February 2020 were then multiplied by this adjustment factor to obtain the proxy capacity for August 2020 (Table 7).
| Feb 2020 Capacity |
August 2020 Capacity |
# of services in 2020 |
Beds pre-pandemic |
Beds early pandemic |
|---|---|---|---|---|
|
yes |
yes |
357 |
Beds in Feb 2020 |
Beds in August 2020 |
|
yes |
no |
66 |
Beds in Feb 2020 |
Beds in Feb 2020 x COVID-19 capacity adjustment factor |
Sample Design
A stratified cluster sample design was used to produce national estimates. The sampling frame was built and sampled on a monthly basis to take into account the changes in capacity over the course of the year. Each month’s sampling frame covered all known permanent emergency shelters in Canada, including those without a data provision agreement with Infrastructure Canada.
Analysis was conducted using survey procedures in the statistical software Stata to ensure that the complex design of the sample was taken into account for variance estimation. Eight strata were used in the sample design (Table 3). These strata ensured the results accounted for differences among shelter types and the estimates reflected age and gender proportions in the population.
The primary sampling units (clusters) were shelters which were selected with probability proportional to size (PPS) within each stratum (Equation 2). The measure of size was the number of beds in the shelter (shelter capacity). With PPS sampling, shelters were randomly selected each month, but larger shelters had a greater probability of being selected than smaller shelters. This was necessary because some shelters had many more beds than others, which affected the probability of selecting any individual client at the shelter.
Equation 2:
![]()
After sorting by probability proportional to size, 1 out of every 4 shelters was selected for inclusion in the sample. Sampled shelters were weighted to represent the shelters without data. Shelter size is inversely proportional to shelter weight (Equation 3).
Equation 3:
Shelter weight = ![]() (beds in stratum - beds in stratum with data not sampled)
(beds in stratum - beds in stratum with data not sampled)
The remaining un-sampled shelters that had complete data were included in the analysis as self-representing units, meaning they were not weighted. Including these more than doubled the number of shelters in the analysis, which helped reduce the margin of error. Sampled shelters without complete data were treated as non-response units (missing data). Because the sampling was done without replacement, finite population correction factors were applied for each stratum (Equation 4).
Equation 4:
Finite population correction factor = ![]()
To obtain the final analysis weights, the data was adjusted by a duplication factor to account for clients who used more than one shelter. There were several steps to calculate the duplication factor:
First, the unique client identifiers were used to identify people who used more than one shelter (Equation 5). The client weight is equal to the inverse of the number of shelters used, therefore a person that accessed a single shelter was assigned a weight of 1.
Equation 5:
![]()
Next, unique client identifiers and unique service provider identifiers were used to determine the number of months in which the client and service provider pairing occurred. This became the monthly adjustment factor for the client weights (Equation 6).
Equation 6:
Monthly adjustment factor = ![]()
Client weights were multiplied by the monthly adjustment factor to obtain the monthly client weight. These adjusted client weights were summed each month at each shelter and the total number of clients was summed each month for each shelter.
Finally, duplication factors were calculated at the shelter level and at the stratum level (Equations 7 and 8). Duplication factors reflect the use of multiple shelters.
Equation 7:
Shelter duplication factor = ![]()
Equation 8:
Stratum duplication factor = ![]()
Duplication factors with lower values indicated high rates of duplication and consequently reduced the final analysis weights for shelters in these strata. Table 8 demonstrates the range of results. Stratum level duplication factors ranged from 0.35 for adult male shelters in 2019 (indicating a high rate of duplication) to 0.95 for family shelters in 2018 (indicating a low rate of duplication).
| Stratum |
2017 |
2018 |
2019 |
2020 |
2021 |
|---|---|---|---|---|---|
|
Male youth |
0.64 |
0.59 |
0.41 |
0.69 |
0.48 |
|
Female youth |
0.82 |
0.78 |
0.66 |
0.77 |
0.63 |
|
All genders youth |
0.65 |
0.66 |
0.41 |
0.45 |
0.59 |
|
Male adults |
0.73 |
0.69 |
0.35 |
0.44 |
0.42 |
|
Female adults |
0.81 |
0.78 |
0.57 |
0.50 |
0.44 |
|
All genders adults |
0.88 |
0.83 |
0.37 |
0.36 |
0.45 |
|
Women and children |
0.93 |
0.92 |
0.60 |
0.76 |
0.75 |
|
Families |
0.94 |
0.95 |
0.81 |
0.91 |
0.83 |
Final analysis weights were calculated separately for sampled and self-representing shelters. For sampled shelters, the final analysis weight was obtained by multiplying the shelter weight by the stratum duplication factor. The final weight for self-representing shelters was equal to the shelter duplication factor.
-
Copyright
© 2023 HIS MAJESTY THE KING IN RIGHT OF CANADA as represented by the Minister of Housing, Infrastructure and Communities.
Catalogue No. T94-59/2024E-PDF
ISBN 978-0-660-69754-3
Report a problem on this page
- Date modified:
