
Highlights of the National Shelter Study 2005 to 2016
On this page
- Acknowledgements
- Abstract
- List of figures
- Introduction
- 1. Shelter system use
- 2. Shelter users and bednights
- 3. Shelter use by age groups
- 4. Family shelter use
- 5. Shelter use by age group and by families
- 6. Shelter use by gender
- 7. Shelter use by Indigenous Peoples
- 8. Shelter use by other priority groups
- Conclusion
- Glossary of Terms
Alternate formats

Request other formats online or call 1 800 O-Canada (1-800-622-6232). If you use a teletypewriter (TTY), call 1-800-926-9105. Large print, braille, audio cassette, audio CD, e-text diskette, e-text CD and DAISY are available on demand.
Acknowledgements
This study has been compiled by the Homelessness Policy Directorate, Income Security and Social Development Branch, Employment and Social Development Canada.
We would like to acknowledge the collaboration and efforts of the Province of Alberta, BC Housing, the City of Toronto, the region of Peel and each of the 216 service providers that contributed data used in this report. Through this collaborative effort, we are able to advance our collective understanding of homelessness in Canada and support decision making, and the development of policies and programs to prevent and reduce homelessness.
We also would like to thank shelter staff for collecting the data, as well as shelter users for agreeing to share their information.
Author and principal investigators
Annie Duchesne, Analyst
Dr. Jacqueline Rivier, Analyst
Dr. Patrick Hunter, Senior Analyst
Dr. Ian Cooper, Manager
Abstract
The National Shelter Study is an ongoing analysis homelessness shelter use trends in Canada. It provides the most reliable national-level estimate of homelessness and is vital for understanding changing trends over time. There are just over 15,400 emergency shelter beds distributed in 400 emergency shelters across Canada. The information used in this study was collected from over 200 shelters across Canada, most of which use the Homeless Individuals and Families Information System (HIFIS). This report updates the National Shelter Study 2005-2014 with new data from 2015 and 2016. While the data show an ongoing decrease in the number of individuals and families using shelters per year, the national occupancy rate remains above 90%. The findings also show ongoing overrepresentation in shelters of people who identify as Indigenous.
List of figures
- Figure 1: Bednights used and national shelter occupancy rate (2005 to 2016)
- Figure 2: Estimated number of annual shelter users (2005 to 2016)
- Figure 3: Distribution of shelter users by age group (2016)
- Figure 4: Estimated number of shelter users by age group (2005 to 2016)
- Figure 5: Occupancy rate at family shelters (2005 to 2016)
- Figure 6: Typical number of days in shelter (2010 to 2016)
- Figure 7: Percentage of short, medium and long stays by year (2005 to 2016)
- Figure 8: Shelter use by gender by age group (2016)
Introduction
The National Shelter Study is an ongoing analysis of homelessness shelter use trends in Canada. This report is the third analysis of national emergency shelter data collected over time. The first study was published in 2013 and covered the period from 2005 to 2009. This information was updated in 2016 and extended the timeframe of the analysis from 2005 to 2014. The current report updates and extends findings to include data from 2015 and 2016.
The National Shelter Study is the most comprehensive national-level study of homelessness in Canada and is vital for understanding changing trends over time. It provides a descriptive account of the demographic characteristics of the homeless population using shelters in Canada (for example: families, youth, Indigenous Persons, etc.), and trends in the average shelter occupancy rate, the overall number of Canadians using shelters, shelter bed use and the length of stay by individuals using Canada’s emergency shelter system.
This report is based on data collected through the Homeless Individuals and Families Information System (HIFIS) and data sharing agreements with communities and service providers. It includes anonymous information from nearly 3.1 million shelter stays that occurred at over 200 of the approximately 400 emergency shelters across Canada between 2005 and 2016.
The National Shelter Study is conducted as part of the Reaching Home program, a community-based program aimed at preventing and reducing homelessness by providing direct support and funding to Designated Communities (urban centers), Indigenous communities, territorial communities and rural and remote communities across Canada.
Visit Reaching Home for more information
For questions related to the information included in this report, contact: HPD.RHInfo-infoVCS.DPMI@infc.gc.ca
Systems and methods
The National Shelter Study is based on anonymous information from nearly 3.1 million shelter stays that occurred at over 200 of the approximately 400 emergency shelters across Canada between 2005 and 2016. Only emergency shelters are included in the study as data received from these facilities is the most comprehensive, reliable and represent the best available indicator of large-scale homelessness trends. While the report represents the extent of shelter use, homelessness among populations that are less likely to access shelter, such as Indigenous Peoples and youth, is likely underrepresented.
The study uses a stratified cluster sample of emergency shelters to ensure accurate estimates of the number and characteristics of shelter users. For the 2014 to 2016 portion of the study, the sample included most of the largest shelters in Canada, covering approximately 70% of the total emergency shelter beds in the country. The sample is based on emergency homeless shelters for individuals and families only and does not include Violence Against Women shelters, transitional housing, or refugee shelters. The study’s methodology also considers people who use more than one shelter by adjusting the sampling weights based on the average rate of client duplication within strata.
The study contains administrative shelter data obtained from emergency shelters using HIFIS and similar data provided by partners including the City of Toronto, Peel Region, the Province of Alberta and BC Housing. Only fields that are filled with sufficient consistency are used in the analysis. For shelters, only those with complete annual data are included in the sample.
While this study covers the 2005 to 2016 period, 3 demographic variables were collected for the first time in 2014 to improve the understanding of homelessness in Canada: citizenship status, Indigenous identity, and veteran status.
The Homeless Individuals and Families Information System (HIFIS)
HIFIS was developed by ESDC in consultation with communities and is provided to communities free of charge, in exchange for the provision of anonymous shelter data. HIFIS is a comprehensive data collection and case management system that supports the day-to-day operations of homelessness service providers, the coordination of services and helps clients to access the right programs at the right time. HIFIS is designed to support the implementation of Coordinated Access by allowing multiple service providers from the same community to access real-time homelessness data and refer clients to the appropriate services at the right time. HIFIS allows these service providers to collaborate through a community-wide system that can be accessed from a variety of web-enabled devices, such as laptops, smartphones and tablets.
HIFIS is a leading tool for building homelessness sector intelligence. By adopting HIFIS, communities acquire the capacity to collect and analyze homelessness sector information that can be used to monitor existing trends, identify arising ones and, more generally, support decision-making. ESDC receives non-identifiable data for 38 fields through a Data Provision Agreement with shelters and communities that use HIFIS. By providing their data to ESDC, HIFIS users also contribute to building knowledge and advancing the understanding of homelessness in Canada.
1. Shelter system use
Over 14,000 Canadians slept in an emergency shelter on an average night.
Shelter use in Canada remains high with an occupancy rate of 91% in 2016. On an average night in 2016, over 14,000 Canadians slept in an emergency shelter. Between 2005 and 2011, occupancy was more variable, with a notable spike in 2008 and 2009 following the 2008 financial crisis before dropping back down in 2010 to pre-recession numbers. Between 2012 and 2016, shelter occupancy stabilized, hovering between 91% and 92%.
There are just over 15,400 emergency shelter beds distributed in 400 emergency shelters across CanadaFootnote 1. While the overall number of emergency shelter beds in Canada was similar in 2005 and 2016 (15,774 beds in 2005, 15,413 beds in 2016), demand for shelter beds has increased during the same period. Bednights measure the number of times a shelter bed is used in a year. Compared to 2005 when shelter beds were used 4.76 million times, emergency shelters served more people per night in 2016 (5.1 million).
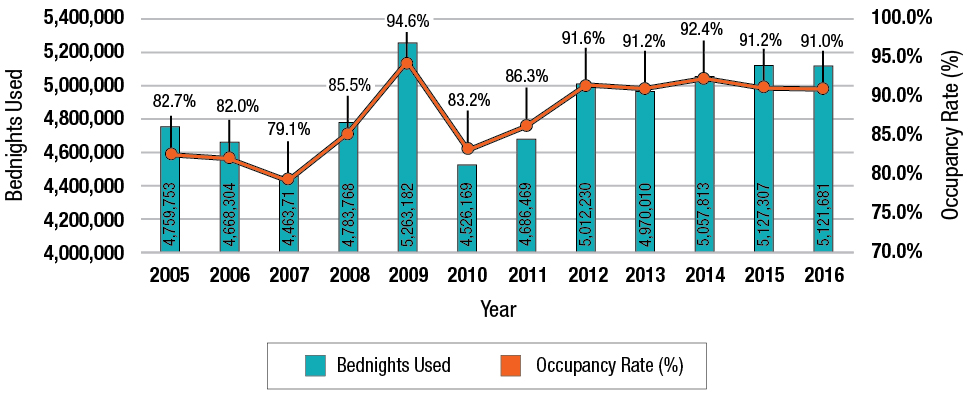
Description of figure 1: The bednights used and the national shelter occupancy rate
| Bednights used and national shelter occupancy rate | 2005 | 2006 | 2007 | 2008 | 2009 | 2010 | 2011 | 2012 | 2013 | 2014 | 2015 | 2016 |
|---|---|---|---|---|---|---|---|---|---|---|---|---|
| Occupancy rate | 82.7% | 82.0% | 79.1% | 85.5% | 94.6% | 83.2% | 86.3% | 91.6% | 91.2% | 92.4% | 91.2% | 91.0% |
| Bednights used | 4,759,753 | 4,668,304 | 4,463,715 | 4,783,768 | 5,263,182 | 4,526,169 | 4,686,469 | 5,012,230 | 4,970,010 | 5,057,813 | 5,0127,307 | 5,121,681 |
Source: Data collected through HIFIS and data sharing agreements
2. Shelter users and bednights
The number of unique people using emergency shelters has declined.
Despite the increasing demand on shelter beds, the annual number of unique shelter users has decreased gradually by nearly 20% from approximately 156,000 in 2005 to 129,000 in 2016.
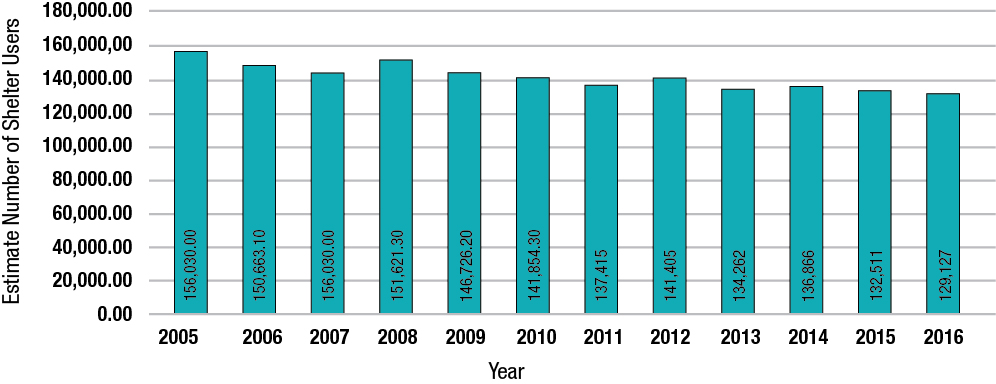
Description of figure 2: The estimated number of shelter users per year (2005 to 2016)
| Estimated number of shelter users per year | 2005 | 2006 | 2007 | 2008 | 2009 | 2010 | 2011 | 2012 | 2013 | 2014 | 2015 | 2016 |
|---|---|---|---|---|---|---|---|---|---|---|---|---|
| Shelter users | 156,030 | 150,663 | 146,884 | 151,621 | 146,726 | 141,854 | 137,415 | 141,405 | 134,262 | 136,866 | 132,511 | 129,127 |
Source: Data collected through HIFIS and data sharing agreements
3. Shelter use by age group
The majority of emergency shelter users are adults (aged 25 to 49).
Adults aged 25 to 49 make up the largest group of emergency shelter users (52.5%), followed by older adults aged 50 to 64 (20.8%). Unaccompanied youthFootnote 2 (aged 13 to 24) also make up a significant proportion of the shelter population (17.3%). ChildrenFootnote 3 (aged 0 to 16) comprise 6.3% of the population. Relatively few seniors aged 65+ use shelters, comprising just 3.1% of all shelter users.

Description of figure 3: The distribution of shelter users by age group (2016)
| Age Group | Children (0 to 16) accompanied | Youth (13 to 24) unaccompanied | Adults (25 to 49) | Older adults (50 to 64) | Seniors (65+) |
|---|---|---|---|---|---|
| 2014 | 6.3% | 17.3% | 52.5% | 20.8% | 3.1% |
Source: Data collected through HIFIS and data sharing agreements
The number of adult shelter users dropped 30% between 2005 and 2016 (from 97,177 to 67,764), which accounts for much of the overall decrease in shelter users over the study period displayed in Figure 2. For unaccompanied youth aged 13 to 24, the number of shelter users decreased almost 25%, from 29,591 in 2005 to 22,398 in 2016. The number of children using shelters increased 35% from 5,998 in 2005 to 8,124 in 2016. By contrast, the number of shelter users aged 50 to 64 has increased by more than 25%, from 21,209 in 2005 to 26,839 in 2016. The number of seniors using emergency shelter services has increased by 50% from 2,680 in 2005 to 4,003 in 2016.
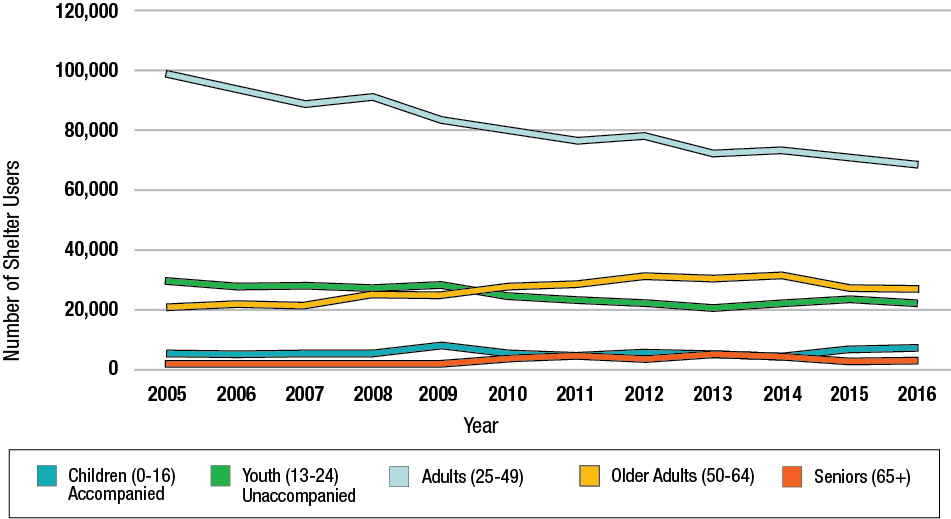
Description of figure 4: The estimated number of shelters users by age group (2005 to 2016)
| Age Group | 2005 | 2006 | 2007 | 2008 | 2009 | 2010 | 2011 | 2012 | 2013 | 2014 | 2015 | 2016 |
|---|---|---|---|---|---|---|---|---|---|---|---|---|
| Children (0 to 16) accompanied | 5,339 | 5,764 | 6,422 | 6,327 | 8,167 | 6,007 | 5,446 | 6,277 | 6,425 | 5,780 | 8,124 | 6,147 |
| Youth (13 to 24) unaccompanied | 32,757 | 31,270 | 31,250 | 30,313 | 31,256 | 27,225 | 26,256 | 25,362 | 23,653 | 25,501 | 22,398 | 18,737 |
| Adults (25 to 49) | 95,820 | 90,931 | 86,824 | 89,304 | 81,463 | 77,836 | 75,245 | 76,449 | 71,113 | 71,824 | 67,764 | 69,121 |
| Older adults (50 to 64) | 18,856 | 19,779 | 19,442 | 22,214 | 22,071 | 25,049 | 25,953 | 28,640 | 28,088 | 28,951 | 26,839 | 27,146 |
| Seniors (65+) | 2,244 | 2,214 | 2,338 | 2,466 | 2,566 | 3,505 | 3,721 | 4,028 | 4,454 | 4,332 | 4,003 | 5,256 |
Source: Data collected through HIFIS and data sharing agreements
4. Family shelter use
The occupancy rate at family shelters was 85.7% in 2016, a 27% increase since 2005.
In 2016, family shelters had an occupancy rate of 85.7%, a 27% increase since 2005. There was a spike in family shelter occupancy (114.2%) in 2009 following the 2008 financial crisis. Family shelter occupancy rates have remained relatively stable since 2011, between 84% and 90%.
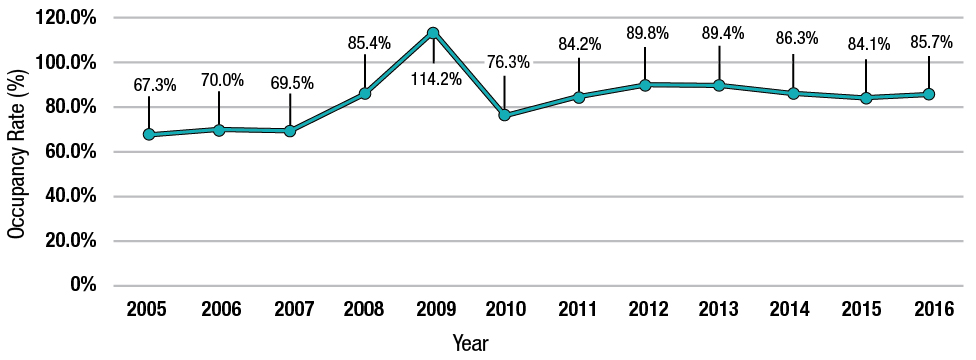
Description of figure 5: The occupancy rate at family shelters (2005 to 2016)
| Occupancy rate at family shelters | 2005 | 2006 | 2007 | 2008 | 2009 | 2010 | 2011 | 2012 | 2013 | 2014 | 2015 | 2016 |
|---|---|---|---|---|---|---|---|---|---|---|---|---|
| Occupancy rate | 67.3% | 70.0% | 69.5% | 85.4% | 114.2% | 76.3% | 84.2% | 89.8% | 89.4% | 86.3% | 0.0% | 0.0% |
Source: Data collected through HIFIS and data sharing agreements
5. Shelter stay duration by age group and by families
The number of days spent in shelter has increased over time.
Since 2010, the duration of time spent in a shelter has increased for all age groups and for families. In a negative truncated binomial regression controlling for gender, age, family status, and multiple stays, the marginal estimate for a typical shelter stay by a family with a single stay was 24.9 days. This is nearly twice as long as the estimated length of stay by an individual (13.2 days). Older adults and seniors were also estimated to have significantly longer shelter stays compared to other age groups. Older adults with a single shelter stay had an estimated length of stay of 22.1 days while seniors had an estimated length of stay of 27.6 days in 2016.

Description of figure 6: The typical number of days spent in shelter (2010 to 2016)
| Age group | 2010 | 2011 | 2012 | 2013 | 2014 | 2015 | 2016 |
|---|---|---|---|---|---|---|---|
| Youth (13 to 24) unaccompanied | 7.0 | 8.1 | 8.2 | 9.8 | 8.6 | 8.7 | 10.5 |
| Adults (25 to 49) | 7.8 | 8.5 | 8.3 | 10.1 | 9.7 | 10.3 | 12.6 |
| Older adults (50 to 64) | 15.3 | 16.6 | 15.8 | 19.2 | 18.1 | 18.4 | 22.1 |
| Seniors (65+) | 21.1 | 21.1 | 20.2 | 23.0 | 23.5 | 24.3 | 27.6 |
| Families | 15.4 | 17.6 | 16.9 | 19.5 | 22.0 | 21.2 | 24.9 |
Source: Data collected through HIFIS and data sharing agreements
The majority (about 50% to 60%) of shelter stays in a given year are short (1 to 4 days), while another 30% to 40% of shelter stays are of medium duration (5 to 30 days). In 2016, 53.6% of all shelter stays were between 1 to 4 days. Short and medium stays have an inverse relationship. Long stays (more than 30 days) have increased slowly and steadily over time, from about 9% in 2005 to about 14% of all stays in 2016. This increase in longer stays contributes to the increase in demand for bednights, displayed in Figure 1.
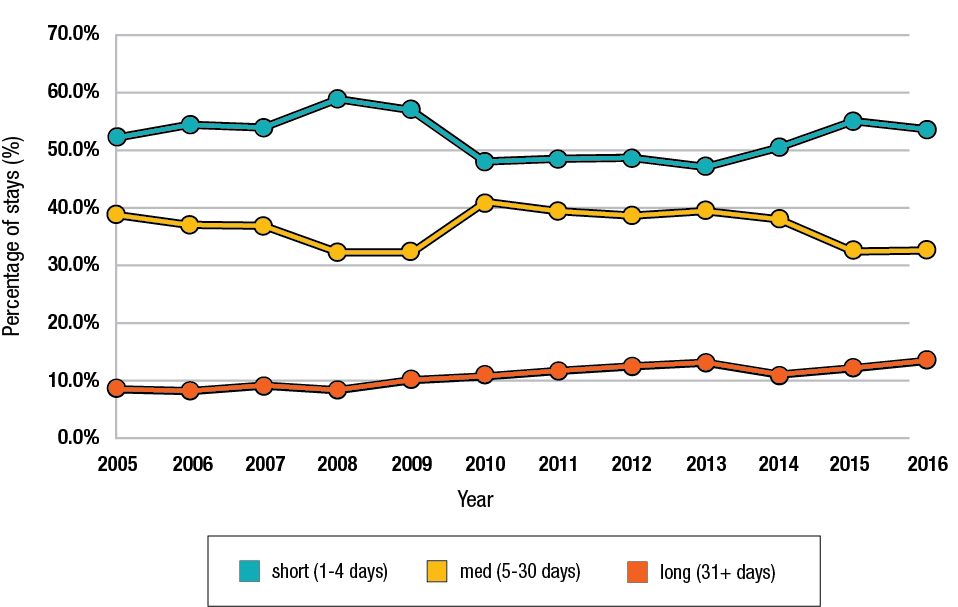
Description of figure 7: The percentage of short, medium and long stays by year (2005 to 2016)
| Length of stay | 2005 | 2006 | 2007 | 2008 | 2009 | 2010 | 2011 | 2012 | 2013 | 2014 | 2015 | 2016 |
|---|---|---|---|---|---|---|---|---|---|---|---|---|
| short (1 to 4 days) | 52.4% | 54.6% | 54.0% | 59.2% | 57.2% | 48.1% | 48.6% | 48.7% | 47.2% | 50.6% | 55.0% | 53.6% |
| med (5 to 30 days) | 38.9% | 37.1% | 36.9% | 32.4% | 32.5% | 40.8% | 39.5% | 38.7% | 39.6% | 38.1% | 32.7% | 32.7% |
| long (31+ days) | 8.7% | 8.3% | 9.2% | 8.4% | 10.3% | 11.0% | 11.9% | 12.6% | 13.2% | 11.3% | 12.3% | 13.7% |
Source: Data collected through HIFIS and data sharing agreements
6. Shelter use by gender
The majority of emergency shelter users are male. This gender gap increases with age.
There has been little change in the proportion of male and female shelter users over the study period (2005 to 2016). In 2016, 69.5% of shelter users were male and 29.7% were female, while 0.8% of people in shelter reported a gender other than male or female. Female shelter users are, on average, younger than male shelter users. The average age for males is 40, compared to 37 for females. Although the proportion of male (49.9%) and female (48.8%) children using shelters is similar, male shelter use increases with age while the reverse is true for female shelter use. For seniors aged 65 and over, 77.8% of all shelter users are male. Note that Violence Against Women shelters are not included in this study, therefore it is likely that the full extent of women’s shelter use is underrepresented in this report.
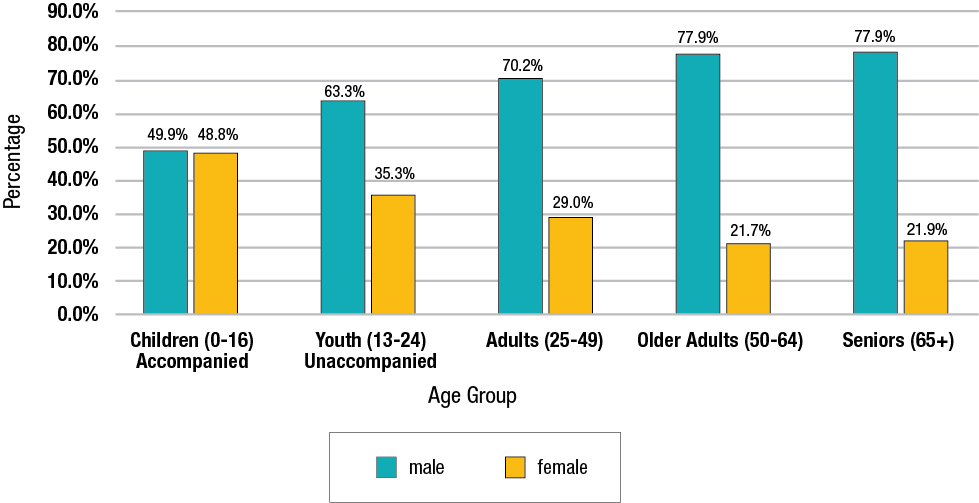
Description of figure 8: Shelter use by gender and by age group (2016)
| Age Group | Children (0 to 16) accompanied | Youth (13 to 24) unaccompanied | Adults (25 to 49) | Older Adults (50 to 64) | Seniors (65+) |
|---|---|---|---|---|---|
| Male | 49.9% | 63.2% | 70.2% | 77.9% | 77.9% |
| Female | 48.8% | 35.3% | 29.0% | 21.7% | 21.9% |
Source: Data collected through HIFIS and data sharing agreements
* Data in Figure 8 only includes male and female responses
7. Shelter use by Indigenous Peoples
Indigenous Peoples remain overrepresented in Canada’s emergency shelters.
While this study covers the 2005 to 2016 period, information on Indigenous identity was collected for the first time in 2014. Indigenous Peoples remain overrepresented in Canada’s emergency shelters. The number of Indigenous shelter users remained relatively stable between 2014 and 2016. It is estimated that between 34,400 and 45,300 {Estimate: 39,700}Footnote 4 Indigenous Peoples used an emergency shelter in 2016, compared to between 38,080 and 45,820 {Estimate 40,519} in 2014. The percentage of shelter users in Canada reporting Indigenous ancestry is approximately 31%, while they represented 5% of the Canadian population in 2016Footnote 5. However, this varies widely by region, from less than 5% in some suburban communities to over 90% in many northern communities. In each of the communities where data are available, Indigenous Peoples are over-represented in homeless shelters compared to the overall population.
8. Shelter use by other population groups
Veterans
The proportion of shelter users reporting military service decreased between 2014 and 2016.
In 2016, 1.8% of shelter users, an estimated 2,400 people, reported having served in the military. This is down from nearly 3,000 (2.2%) in 2014, the first year this information was collected. Shelter users reporting military service were more likely to be male (84.4%). Male shelter users reporting military service tended to be older (48 years old on average) than female veterans (38 years old on average). Nearly half (42.7%) of females reporting military service were under age 30 compared to 13.8% of males.
Immigrants, refugees and temporary residents
The number of refugees using emergency shelters increased between 2014 and 2016.
In 2016 over 7,600, or 5.9%, of shelter users reported that they were not Canadian citizens compared to 4.9% in 2014. This includes 5,067 permanent residents or immigrants, 1,991 refugees and 558 temporary residents (student, work or visitor visa). Compared to 2014, the first year that this data was collected, the number of permanent residents or immigrants using shelters remained stable (5,067 in 2016 vs. 5,036 in 2014) while the number of refugees increased by almost 900 (1,991 in 2016 vs. 1,096 in 2014). Non-citizens were more likely to access the shelter system as part of a family (35%) compared to non-citizens (12%). Data from refugee shelters are not included in this analysis.
Conclusion
In 2016 the estimated number of shelter users was at its lowest in the past 12 years. The annual number of individuals using shelters has fallen from 156,000 in 2005 to 129,000 in 2016.
Despite a decrease in shelter users, occupancy rates have increased since 2005 and have consistently remained above 90% since 2012.
The trend of longer stay lengths continued for all types of shelter users, especially for those over 50 years old. As a result, although the number of shelter users has decreased in 2016, there are still more than 14,000 Canadians using an emergency shelter on an average night.
In 2016, 69.5% of shelter users were male and 29.7% were female. The gender distribution among shelter users has not changed significantly since 2005.
The average age of emergency shelter users was 39.5 years in 2016. Females tended to be slightly younger (37.0 years old) compared to male shelter users (40.5 years old).
Shelter use by families has remained relatively consistent since 2011 with occupancy rates hovering between 84% and 90%. However, there has been a marked increase in stay lengths for families, which continued into 2016. Families typically stay in a shelter almost twice as long as individuals.
Although data from refugee shelters are not included in this study, there was an observable increase in the number of refugees using shelters, from about 1,100 in 2014 to nearly 2,000 in 2016. By contrast, the number of permanent residents or immigrants using shelters remained consistent over this period. Among non-citizens, 35% accessed shelters as part of a family compared to just 12% of Canadian citizens.
Indigenous Peoples remain overrepresented among shelter users, with approximately 31% of shelter users reporting Indigenous ancestry.
A full National Shelter Study 2005 to 2016 is expected to be released in fall 2019. Further analysis will include more in-depth profiles for population and age groups.
Glossary of terms
Adult: Person between the ages of 25 and 49.
Bednights: The number of times a shelter bed is used in a year.
Child: Any person under the age of 13 OR a person between the ages of 13 and 16 that is accompanied by a parent or guardian during their episode of homelessness.
Emergency shelter: Facility that provides temporary, short-term accommodation for homeless individuals and families. This may or may not include other services such as food, clothing or counselling.
Homelessness: The living situation of an individual or family who does not have stable, permanent, appropriate housing, or the immediate prospect, means and ability of acquiring a home.
Family: People who report being in the company of one or more family members during their episode of homelessness.
Family shelter: Facility that provides temporary, short-term accommodation specifically for families.
Immigrant: A landed immigrant/permanent resident is a person who has been granted the right to live in Canada permanently by immigration authorities. This is self-reported at time of shelter-entry.
Indigenous peoples: A person who self-reports as being First Nations, Métis, Inuit, status or non-status person, regardless of residency or membership status.
Indigenous Homelessness: refers to Indigenous Peoples who are in the state of having no home due to colonization, trauma and/or whose social, cultural, economic, and political conditions place them in poverty. Having no home includes: those who alternate between shelter and unsheltered, living on the street, couch surfing, using emergency shelters, living in unaffordable, inadequate, substandard and unsafe accommodations or living without the security of tenure; anyone regardless of age, released from facilities (such as hospitals, mental health and addiction treatment centers, prisons, transition houses), fleeing unsafe homes as a result of abuse in all its definitions, and any youth transitioning from all forms of care.
Individual: Person who is not part of a family with children during an episode of homelessness. Individuals may be homeless as single adults, unaccompanied youth, or in multiple-adult or multiple-child households.
Older adult: Person between the ages of 50 and 64.
Seasonal/Temporary/Emergency weather response shelters: Facilities that open temporarily to provide additional seasonal, emergency shelter spaces during period of extreme weather (winter, storm, heat, etc.).
Senior: People aged 65 and older.
Shelter users: Individuals and families who use the emergency shelter system in Canada.
Transitional housing: Facilities that provide temporary shelter, but can be differentiated from emergency shelters by the longer length of stay and greater intensity of support services offered to clients. Transitional housing is an intermediate step between emergency shelter and permanent housing. Stays are typically between 3 months and 3 years.
Youth: Person between the ages of 13 and 16 who is unaccompanied by a parent or guardian during their episode of homelessness.Footnote 6 People between the ages of 17 and 24 are considered to be youth regardless of accompaniment status.
Veteran: A former member of the Canadian Armed Forces. This is self-reported at time of shelter-entry.
Canadian citizen: Person who was born in Canada or became a citizen through Canada’s naturalization process. This is self-reported at time of shelter-entry.
Refugee: Person who has been offered refugee protection in Canada who fear persecution and who are unwilling or unable to return to their home country. This is self-reported at time of shelter-entry.
Refugee claimant: A person who has claimed refugee protection in Canada. This is self-reported at time of shelter-entry.
Refugee shelter: Facility that provides temporary accommodations specifically to refugees, refugee claimants or immigrants.
Permanent resident: Person who has been given permanent resident status by immigrating to Canada, but is not a Canadian citizen. This is self-reported at time of shelter-entry.
Visa holder: Person who has been granted admission to Canada as a temporary resident (a visitor, student or worker).
Violence against women shelter: Facility that provides temporary shelter to single women or women with children fleeing domestic abuse. They may function in either a crisis capacity or as transitional or second-stage housing.
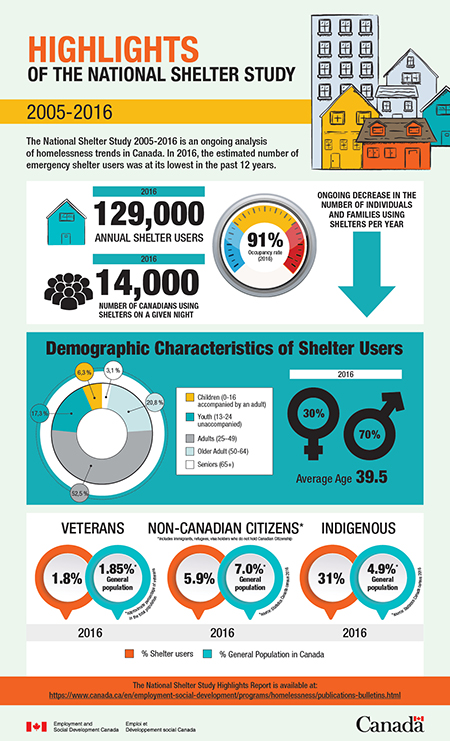
Text description
The National Shelter Study 2005 to 2016 is an ongoing analysis of homelessness trends in Canada. In 2016, the estimated number of emergency shelter users was at its lowest in the past 12 years.
Number of emergency shelter users (2016):
- Annual shelter users: 129,000
- Number of Canadians using shelters on a given night: 14,000
- Occupancy rate: 91%
Ongoing decrease in the number of individuals and families using shelters per year
Demographic characteristics of shelter users (2016):
- 6.3% Children (0 to 16 accompanied by an adult)
- 17.3% Youth (13 to 24 unaccompanied)
- 3.1% Seniors (65+)
- 20.8% Older adult (50 to 64)
- 52.5% Adults (25 to 49)
- 30% Female
- 70% Male
- Average age: 39.5
Veterans:
% Shelter users: 1.8
% General population in Canada: 1.85*
*approximate percentage of veterans in the total population
Non-Canadian citizens (includes immigrants, refugees, visa holders who do not hold Canadian Citizenship):
% Shelter users: 5.9
% General population in Canada: 7.0
Source: Statistic Canada census 2016
Indigenous:
% Shelter users: 31
% General Population in Canada: 4.9
Source: Statistic Canada census 2016
Additional resources
Information on Reaching Home:
Report a problem on this page
- Date modified: