2019-20 Departmental Results Report
Analysis of trends in spending and human resources
2019-20 Departmental Results Report
Analysis of trends in spending and human resources
Actual expenditures
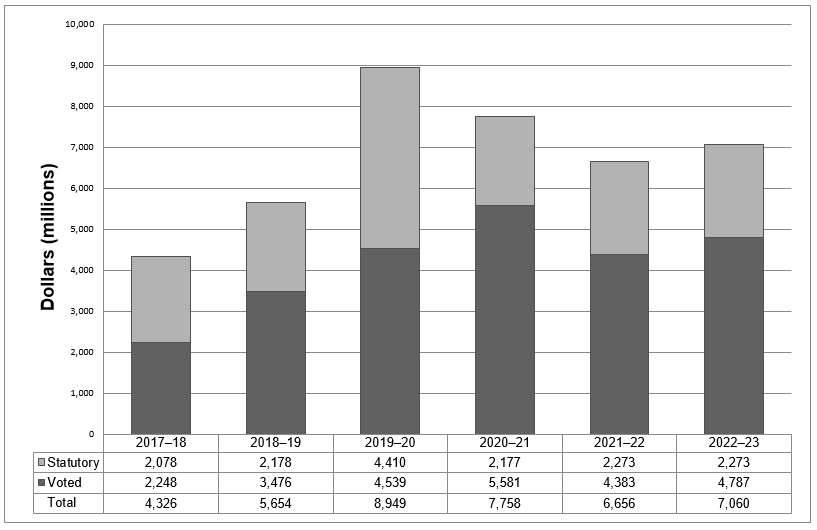
The following graph presents planned (voted and statutory spending) over time.
Departmental spending trend graph
Text description of Figure
| Year | 2017-18 | 2018–19 | 2019–20 | 2020–21 | 2021–22 | 2023–23 |
|---|---|---|---|---|---|---|
| Total | 4,326 | 5,654 | 8,949 | 7,758 | 6,656 | 7,060 |
| Voted | 2,248 | 3,476 | 4,539 | 5,581 | 4,383 | 4,787 |
| Statutory | 2,078 | 2,178 | 4,410 | 2,177 | 2,273 | 2,273 |
Fiscal years 2017-18, 2018-19 and 2019-20 represent actual expenditures as reported in the Public Accounts.
In 2019-20, Infrastructure Canada's total spending was over $8.9 billion. Departmental spending continued to rise, as it has over the previous two years. Expenditures under voted spending, in particular, are more than twice the amount spent two years ago, and considerably higher than what was spent last year.
Voted spending increases are largely due to more infrastructure projects being completed, or reaching construction milestones that triggered payments from Infrastructure Canada, including a large milestone payment for the Samuel De Champlain Bridge Corridor project.
Statutory funding from the federal Gas Tax Fund received a top-up in the amount of $2.1 billion in 2019-20, bringing the total to $4.3 billion for this program.
Budgetary performance summary for Core Responsibilities and Internal Services (dollars)
| Core responsibilities and Internal Services | 2019–20 Main Estimates |
2019–20 Planned spending |
2020–21 Planned spending |
2021–22 Planned spending |
2019–20 Total authorities available for use |
2017–18 Actual spending (authorities used) | 2018–19 Actual spending (authorities used) | 2019–20 Actual spending (authorities used) |
|---|---|---|---|---|---|---|---|---|
| Public Infrastructure | 10,685,305,408 | 10,685,305,408 | 7,802,585,286 | 6,728,755,425 | 11,084,426,555 | 8,891,374,387 | 5,592,897,292 | 8,891,374,387 |
| Program Alignment Architecture Structure | N/A | N/A | N/A | N/A | N/A | 4,269,183,886 | N/A | N/A |
| Subtotal | 10,685,305,408 | 10,685,305,408 | 7,802,585,286 | 6,728,755,425 | 11,084,426,555 | 13,160,558,273 | 5,592,897,292 | 8,891,374,387 |
| Internal Services | 51,359,545 | 51,359,545 | 57,971,907 | 27,932,471 | 62,719,778 | 57,113,123 | 61,354,440 | 57,493,166 |
| Total | 10,736,664,953 | 10,736,664,953 | 7,860,557,193 | 6,756,687,896 | 11,147,146,333 | 13,217,671,396 | 5,654,251,732 | 8,948,867,553 |
Total authorities available for use in 2019-20 ($11.1 billion) were greater than the actual spending in 2019-20 ($8.9 billion). The variance of $2.2 billion is mainly due to large project negotiations taking longer than expected and impacting forecasts, the emergence of COVID having a direct impact on ultimate recipients' operations, delays in project approvals and submissions to INFC than originally planned, and delays in the finalization of the construction of the Samuel De Champlain Bridge Corridor project.
Total actual spending for 2019-20 ($8.9 billion) was greater than 2018-19 ($5.7 billion). This variance is due to Budget 2018 one-time top-up of the Gas Tax Fund of $2.1 billion, in addition to $1.1 billion in payments to the Private Partner responsible for the construction of the Samuel De Champlain Bridge Corridor project for reaching construction milestones.
Finally, the 2019-20 planned spending demonstrates an increase from the 2018-19 planned spending as the Department received new funding originally announced in Budget 2018 and the 2017 Fall Economic Statement.
Actual human resources
Human resources summary for core responsibilities and Internal Services
| Core responsibilities and Internal Services | 2017–18 Actual full-time equivalents | 2018–19 Actual full-time equivalents | 2019–20 Planned full-time equivalents |
2019–20 Actual full-time equivalents | 2020–21 Planned full-time equivalents | 2021–22 Planned full-time equivalents |
|---|---|---|---|---|---|---|
| Public Infrastructure | N/A | 266 | 275 | 275 | 266 | 173 |
| Program Alignment Architecture Structure | 250 | N/A | N/A | N/A | N/A | N/A |
| Subtotal | 250 | 266 | 275 | 275 | 266 | 173 |
| Internal Services | 179 | 261 | 197 | 365 | 190 | 124 |
| Total | 429 | 527 | 472 | 640 | 456 | 297 |
Actual full time equivalents were 36% above planned full time equivalents increasing overall spending in 2019-20. As the Department delivers more programs, full time equivalents also grow to effectively manage and deliver them.
Expenditures by vote
For information on Infrastructure Canada's organizational voted and statutory expenditures, consult the Public Accounts of Canada 2019–20.Endnote ii
Government of Canada spending and activities
Information on the alignment of Infrastructure Canada's spending with the Government of Canada's spending and activities is available in GC InfoBase.Endnote iii
Financial statements and financial statements highlights
Financial statements
The Infrastructure Canada financial statements (unaudited) for the year ended March 31, 2019, are available on the departmental website.
Financial statement highlights
Condensed Statement of Operations (unaudited) for the year ended March 31, 2020 (dollars)
| Financial information | 2019–20 Planned results |
2019–20 Actual results |
2018–19 Actual results |
Difference (2019–20 Actual results minus 2019–20 Planned results) |
Difference (2019–20 Actual results minus 2018–19 Actual results) |
|---|---|---|---|---|---|
| Total expenses | 7,530,125,435 | 5,537,118,546 | 7,783,002,607 | (1,993,006,889) | (2,245,884,061) |
| Total revenues | - | - | - | - | - |
| Net cost of operations before government funding and transfers | 7,530,125,435 | 5,537,118,546 | 7,783,002,607 | (1,993,006,889) | (2,245,884,061) |
Condensed Statement of Financial Position (unaudited) as of March 31, 2020 (dollars)
| Financial information | 2019–20 | 2018–19 | Difference (2019–20 minus 2018–19) |
|
|---|---|---|---|---|
| Total net liabilities | 2,024,468,698 | 5,304,096,449 | (3,279,627,751) | |
| Total net financial assets | 1,132,965,352 | 1,222,637,867 | (89,672,515) | |
| Departmental net debt | 891,503,346 | 4,081,458,582 | (3,189,955,236) | |
| Total non-financial assets | 2,887,430,667 | 2,666,798,514 | 220,632,153 | |
| Departmental net financial position | 1,995,927,321 | (1,414,660,068) | 3,410,587,389 | |
Report a problem on this page
- Date modified:
