2018-19
Departmental Plan - Spending and human resources
Planned spending
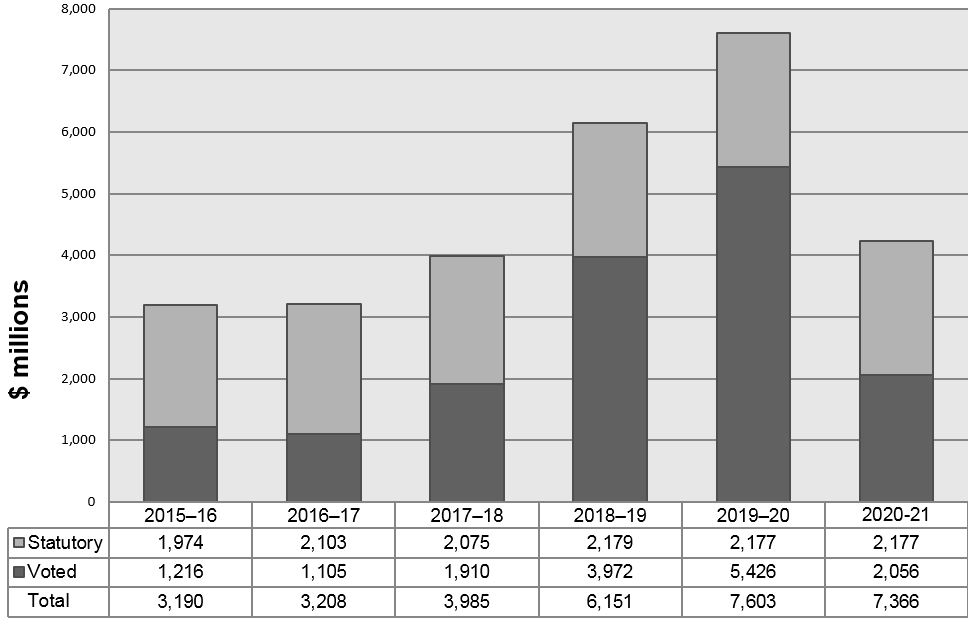
Figure 1: Departmental Spending Trend
*Statutory spending includes some operating expenses, and the federal Gas Tax Fund program which became permanent in 2014–15. In 2016–17, the Statutory amount also includes $30,155,357 in Voted spending flowed to provinces and territories through the federal Gas Tax Fund, as legacy funding was transferred from sunsetting programs to the federal Gas Tax Fund. The transfer of legacy funding (Voted spending) through the federal Gas Tax Fund ensured that funds were directed towards municipal infrastructure priorities in the near term.
Budgetary planning summary for Core Responsibilities and Internal Services (dollars)
Core Responsibilities and Internal Services |
Program Alignment Architecture (PAA) from previous years up to 2017–18, and Internal Services |
2015–16 |
2016–17 |
2017–18 |
2018–19 |
2018–19 |
2019–20 |
2020–21 |
|---|---|---|---|---|---|---|---|---|
Public Infrastructure |
N/A |
N/A |
N/A |
N/A |
6,093,494,958Footnote32 |
6,093,494,958Footnote32b |
7,549,257,795 |
7,307,467,745 |
Internal Services |
N/A |
N/A |
N/A |
N/A |
57,324,059 |
57,324,059 |
53,314,070 |
58,150,505 |
N/A |
Funding for Provincial-Territorial Priorities |
50,036,481 |
3,064,280 |
23,091,112 |
N/A |
N/A |
N/A |
N/A |
N/A |
Permanent and Flexible Infrastructure Funding |
1,974,079,201 |
2,102,832,309 |
2,074,888,463 |
N/A |
N/A |
N/A |
N/A |
N/A |
Investments in National Infrastructure Priorities |
84,854,656 |
164,694,236 |
407,158,756 |
N/A |
N/A |
N/A |
N/A |
N/A |
Large-Scale Infrastructure Investments |
887,432,688 |
703,602,026 |
731,221,999 |
N/A |
N/A |
N/A |
N/A |
N/A |
Infrastructure Investments in Small Communities and Rural Areas |
88,141,483 |
157,116,165 |
212,544,579 |
N/A |
N/A |
N/A |
N/A |
N/A |
New Bridge for the St. Lawrence Corridor project |
66,281,311 |
28,165,895 |
492,521,162 |
N/A |
N/A |
N/A |
N/A |
N/A |
Subtotal |
3,150,825,820 |
3,159,474,911 |
3,941,426,071 |
N/A |
N/A |
N/A |
N/A |
N/A |
Internal Services |
39,615,936 |
48,291,361 |
43,225,222 |
N/A |
N/A |
N/A |
N/A |
N/A |
Total |
3,190,441,756 |
3,207,766,272 |
3,984,651,293 |
6,150,819,017 |
6,150,819,017 |
7,602,571,865 |
7,365,618,250 |
Starting in 2018-19, the Department is transitioning from the Program Alignment Architecture to a new structure, the Departmental Results Framework, as required by the Treasury Board Policy on Results.
Planned human resources
Human resources planning summary for Core Responsibilities and Internal Services (full-time equivalents, or FTEs)
Core Responsibilities and Internal Services |
Program Alignment Architecture (PAA) from previous years up to |
2015–16 |
2016–17 |
2017–18 |
2018–19 |
2019–20 Planned |
2020–21 Planned |
|---|---|---|---|---|---|---|---|
Public Infrastructure |
N/A |
N/A |
N/A |
N/A |
262 |
214 |
206 |
Internal Services |
N/A |
N/A |
N/A |
N/A |
258 |
212 |
204 |
N/A |
Funding for Provincial-Territorial Priorities |
3 |
3 |
2 |
N/A |
N/A |
N/A |
N/A |
Permanent and Flexible Infrastructure Funding |
22 |
15 |
12 |
N/A |
N/A |
N/A |
N/A |
Investments in National Infrastructure Priorities |
27 |
34 |
28 |
N/A |
N/A |
N/A |
N/A |
Large-Scale Infrastructure Investments |
68 |
75 |
71 |
N/A |
N/A |
N/A |
N/A |
Infrastructure Investments in Small Communities and Rural Areas |
32 |
17 |
14 |
N/A |
N/A |
N/A |
N/A |
New Bridge for the St. Lawrence Corridor project |
44 |
47 |
30 |
N/A |
N/A |
N/A |
N/A |
Subtotal |
196 |
191 |
159 |
N/A |
N/A |
N/A |
N/A |
Internal Services |
161 |
194 |
162 |
N/A |
N/A |
N/A |
N/A |
Total |
357 |
385 |
321 |
520 |
426 |
410 |
The planned human resources levels from 2015–16 will continue to increase until 2018–19. A decline is expected in 2019–20 as the funding associated with some sunsetting programs will end (this includes the programs under the New Building Canada Fund and the New Champlain Bridge Corridor project).
Estimates by vote
For information on Infrastructure Canada's organizational appropriations, consult the 2018–19 Main Estimates.Endnote ii
Future-Oriented Condensed Statement of Operations
The Future-Oriented Condensed Statement of Operations provides a general overview of the Infrastructure Canada's operations. The forecast of financial information on expenses and revenues is prepared on an accrual accounting basis to strengthen accountability and to improve transparency and financial management.
Because the Future-Oriented Condensed Statement of Operations is prepared on an accrual accounting basis, and the forecast and planned spending amounts presented in other sections of the Departmental Plan are prepared on an expenditure basis, amounts may differ.
A more detailed Future-Oriented Statement of Operations and associated notes, including a reconciliation of the net cost of operations to the requested authorities, are available on the Infrastructure Canada website.Endnote iii
Future-Oriented Condensed Statement of Operations for the year ended March 31, 2018 (dollars)
Financial information |
2017–18 |
2018–19 |
Difference |
|---|---|---|---|
Total expenses |
3,953,259,981 |
6,081,024,765 |
2,127,764,784 |
Total revenues |
0 |
0 |
0 |
Net cost of operations before government funding and transfers |
3,953,259,981 |
6,081,024,765 |
2,127,764,784 |
Footnotes
- Footnote 32
-
The 2018–19 Main Estimates and 2018–19 Planned Spending do not include funds being transferred to Infrastructure Canada from PPP Canada, a Crown Corporation established in 2008 to support the development of public-private partnerships (P3), which is being dissolved effective March 31, 2018. Funds related to the Crown Corporation being transferred to Infrastructure Canada will be obtained through 2018-19 Supplementary Estimates processes. As well, the 2018–19 Main Estimates and 2018–19 Planned Spending do not include funding for two other programs under the Investing in Canada plan, that are anticipated to start in 2018–19. Funding for these programs will be obtained through 2018–19 Supplementary Estimates processes.
- Date modified:
