Minister of Infrastructure and Communities Transition Book 1 (2021)
Welcome Letter
Minister of Infrastructure and Communities Transition Book 1 (2021)
Welcome Letter
Welcome Letter
Minister of Infrastructure and Communities
The House of Commons
Ottawa, Ontario K1A 0A6
Dear Minister,
Please accept my congratulations on your appointment as Minister of Infrastructure and Communities. On behalf of Infrastructure Canada and its portfolio agencies, I would like to welcome you to the department.
Infrastructure has a profound impact on the daily of life of all Canadians – from access to public transit and broadband connectivity, to climate-resilient energy grids and protected green space. The infrastructure we build today will be used for decades. Building climate-ready infrastructure informed by robust mitigation strategies and the best available science will protect our most vulnerable communities from the impacts of climate change, and provide an invaluable long-term return on investment.
Since the onset of the COVID-19 pandemic, we have adapted existing programs to better respond to the critical needs of Canadians, as well as introduced a number of new tools to build back better. We are keenly aware of the historic opportunity to build world-class infrastructure that will enable us to achieve net-zero emissions by 2050, stimulate growth and prosperity under a green economy, and materially improve quality of life for all Canadians.
Over the past two years, the mandate of Infrastructure Canada has evolved and expanded. Today, we are a nimble department with a staffing complement of 925 dedicated to administering 29 infrastructure programs and initiatives, developing sound policy advice, and delivering two major, transformative bridge projects. There will be considerable scope for action within your purview as Minister of Infrastructure and Communities.
Our team is poised to provide briefings on the Government's tools and operations. We will be working closely with you and your team in the coming days. I look forward to embarking on this journey under your leadership.
Sincerely,
Kelly Gillis
Deputy Minister
Infrastructure Canada
Departmental and Portfolio Overview
Mandate
- Infrastructure Canada was established in 2002 and is the main department responsible for federal efforts to enhance Canada's public infrastructure.
- Infrastructure Canada has a role in supporting the Minister of Rural Economic Development in providing a rural voice throughout the federal family.
- It works closely with all orders of government and other partners to help ensure that Canadians benefit from world-class, modern public infrastructure. To this end, the department makes investments, builds partnerships, develops policies, delivers programs and major projects while also considering alternative models to leverage private investment and participation in the planning and delivery of infrastructure in the public interest.
- Infrastructure Canada has experienced significant growth in response to our evolving and expanding mandate, which includes developing and implementing new programming to support Canada's recovery from COVID-19.
- Infrastructure Canada also manages the Samuel De Champlain Bridge Corridor project and oversees a portfolio that includes three crown corporations and a tri-government agency.
Funding Programs
Infrastructure Canada delivers a wide range of funding programs. The department is presently providing funding to thousands of active infrastructure projects across the country. Current programs with funding available for new infrastructure projects include:
Text description of image
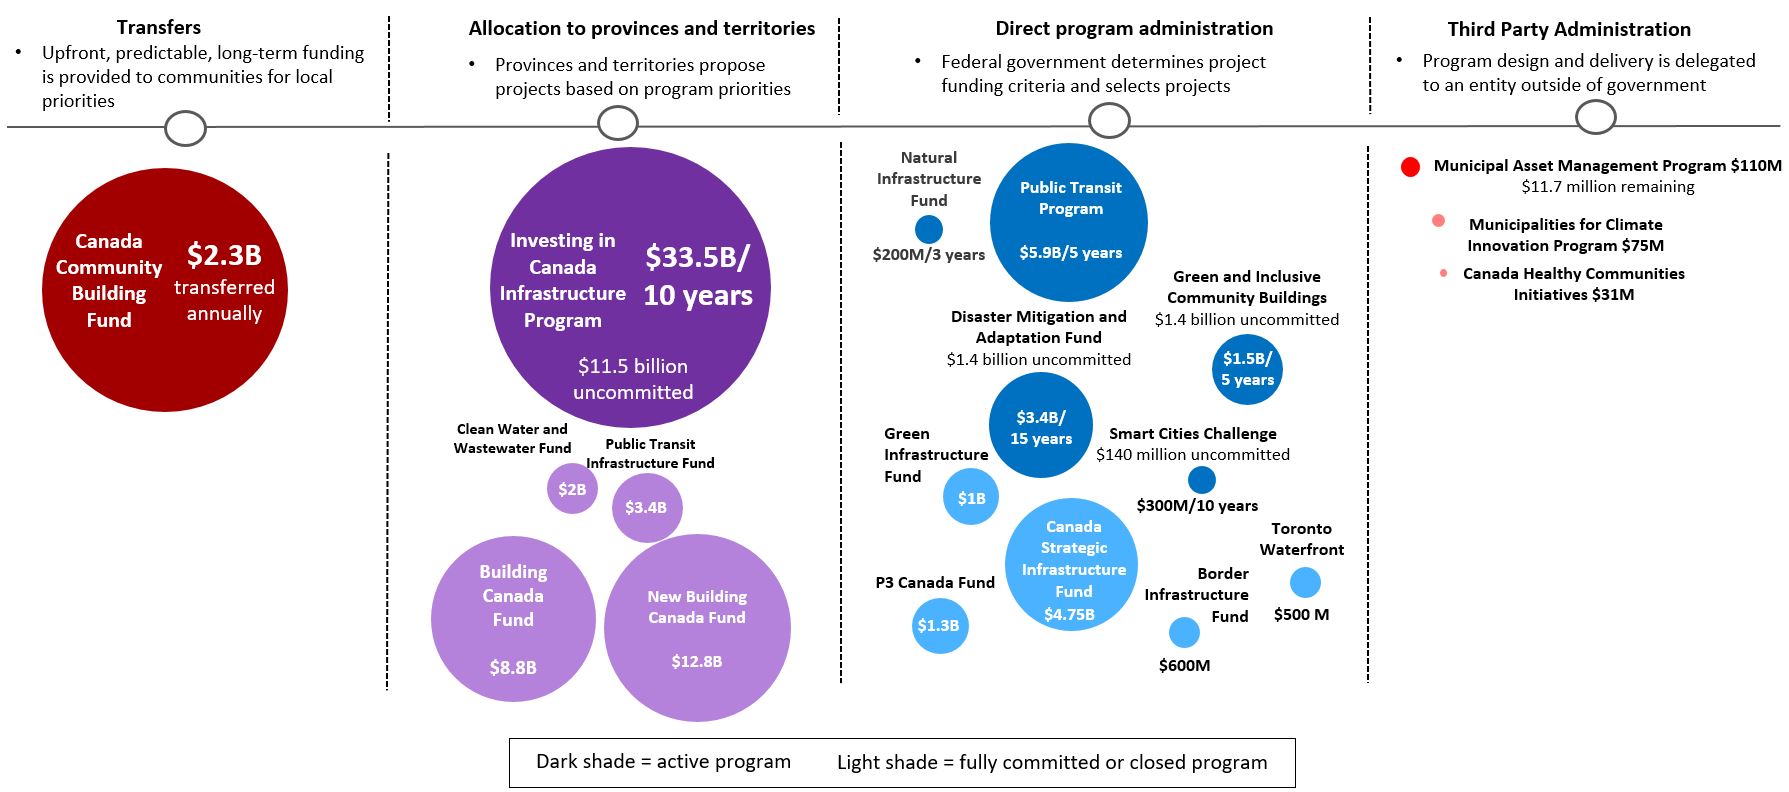
Infrastructure Canada delivers a wide range of funding programs, all of which fall under 1 of 4 broad categories. Each category includes active and closed (or fully committed) programs. Several are active programs, while several others are fully committed or close.
The four categories of funding programs include:
1) Transfer programs, which provide upfront, predictable, long-term funding to communities for local priorities. Active funding programs include:
- Canada Community Building Fund which transfers $2.3 billion annually.
2) Allocation-based programs fund projects proposed by provinces and territories based on program priorities. Active funding programs include:
- Investing in Canada Infrastructure Program which provides $33.5 billion over 10 years. The Investing in Canada Infrastructure Program has $11.5 billion in uncommitted funding.
Fully committed or closed allocation-based programs, include:
- The Building Canada Fund, which provided a total of $8.8 billion.
- The New Building Canada Fund, which provided a total of $12.8 billion.
- The Public Transit Infrastructure Fund, which provided a total of $3.4 billion.
- The Clean Water and Wastewater Fund, which provided a total of $2 billion.
3) Direct administration programs, whereby the federal government determines project funding criteria and selects projects. Active funding programs include:
- The Natural Infrastructure Fund, which provides $200 million over 3 years.
- The Public Transit Program, which provides $5.9 billion over 5 years.
- The Disaster Mitigation and Adaptation Fund, which provides $3.4 billion over 15 years. Currently, the Fund currently has $1.4 billion in uncommitted funding.
- The Green and Inclusive Community Buildings program, which provides $1.5 billion over 5 years. Currently, the program has $1.4 billion in uncommitted funding.
- The Smart Cities Challenge, which provides $300 million over 10 years. Currently, the program has $140 million in uncommitted funding.
Fully committed or closed direct administration programs include:
- The Canada Strategic Infrastructure Fund, which provided a total of $4.75 billion.
- The P3 Canada Fund, which provided a total of $1.3 billion.
- The Green Infrastructure Fund, which provided a total of $1 billion.
- The Border Infrastructure Fund, which provided a total of $600 million.
- Toronto Waterfront, which received a total of $500 million.
4) Third party administration programs, where program design and delivery is delegated to an entity outside of government. Active funding programs include:
- Municipal Asset Management Program, which provides a total of $110 million. The Municipal Assessment Program has $11.7 million in uncommitted funding.
Fully committed or closed third party administration programs include:
- The Municipalities for Climate Innovation Program, which provided a total of $75 million.
- The Canada Healthy Communities Initiative, which provided a total of $31 million.
Organization Overview
Led by the Deputy Minister of Infrastructure and Communities, Infrastructure Canada has seven functional areas:
Communities and Infrastructure Programs
Ensures management and operation of programs and projects, including the application and approval process, compliance, and oversight.
Works via a whole-of-government approach to coordinate research, analyze data, and provide advice regarding rural economic development issues.
Policy and Results
Focuses on policy development and advice, data and research, Cabinet support, program development, reporting on results, and the National Infrastructure Assessment.
Investment, Partnerships, and Innovation
A centre of expertise on innovative approaches to infrastructure delivery including Public Private Partnerships; responsible for liaising with the Canada Infrastructure Bank and for the oversight of the Gordie Howe International Bridge project in Windsor-Detroit and the Samuel De Champlain Bridge project in Montréal.
Corporate Services
Provides services and support to the department in the areas of administration, corporate planning, financial management, human resources, and information management and technology.
Corporate Secretariat
Provides specialized advice and services in parliamentary/portfolio affairs, access to information/ privacy, correspondence, governance, ministerial travel, and corporate services liaison for Ministers' offices.
Audit and Evaluation
Ensures independent, evidence-based analysis and insight to senior management on departmental risks and operations to support the effective and efficient achievement of results for Canadians, fostering continuous improvement.
Communications
Plans and delivers communications activities and products that support the department's mandate and inform Canadians on progress and results of federal infrastructure investments.
Portfolio Overview
As Minister of Infrastructure and Communities, you are also responsible for four arm’s length organizations, three of which report to Parliament through you:
Canada Infrastructure Bank
The Crown corporation is a tool that provincial, territorial, municipal and Indigenous partners can use to build infrastructure across Canada. The Bank was established to invest, and to attract investment from private sector and institutions, in revenue-generating infrastructure projects that are in the public interest.
Windsor-Detroit Bridge Authority
The Crown corporation is responsible for the construction and eventual operation of the Gordie Howe International Bridge between Windsor, Ontario and Detroit, Michigan, which is being delivered through a Public Private Partnership.
Jacques Cartier and Champlain Bridges Incorporated
The Crown corporation manages, operates and maintains the Jacques Cartier Bridge, the Bonaventure Expressway, the federal section of the Honoré Mercier Bridge, the Melocheville Tunnel, and the Champlain Bridge Ice Control Structure. It is also responsible for the deconstruction of the old Champlain Bridge.
Waterfront Toronto
The tri-government (federal, provincial, municipal) corporation was established in 2002 under provincial legislation as a not-for-profit entity mandated with implementing the Toronto Waterfront Revitalization Initiative. The program is designed to enhance the economic, social and cultural value of waterfront lands and create an accessible and active waterfront for living, working and recreation.
Infrastructure Canada Offices
Infrastructure Canada has a staffing complement of 925, with main offices in Ottawa and Montreal.
Your office is located on [redacted] 427 Laurier Avenue in Ottawa.
Ottawa
427 Laurier Avenue and 180 Kent Street
Montreal
800 René-Lévesque Boulevard West
Contact Card
Key Contacts
Office Address
Infrastructure Canada
427 Laurier Avenue West, [redacted], Ottawa (ON) K1R 1B9
Minister's Office Reception
613-941-0724
Emergency Contact for Building Security (after hours)
[redacted]
Driver*
Filippo Urbisci
C : [redacted] | E : [redacted]
*It is assumed that if you were a previous Minister that you will have your own driver and car. Please reach out to minoadmin@infc.gc.ca to make any necessary arrangements for a driver and discuss options for your vehicle as required.
Deputy Minister
Kelly Gillis
W/T : 613-960-5661 | C : [redacted] | E : kelly.gillis@infc.gc.ca
DM Chief of Staff
Jennifer Eyre
W/T : 613-960-9666 | C : 343-550-8978 | E : jennifer.eyre@infc.gc.ca
Departmental Liaison
Justine Reynolds
C : 343-573-7945 | E : justine.reynolds@infc.gc.ca
Corporate Secretariat
Karl El-Koura
C : 613-355-9681 | E : karl.el-koura@infc.gc.ca
IT Services for Minister's Office
[redacted]
Security Key Contacts
Privy Council Office (PCO) Ministerial Safety & Security
Emergency Crisis Management: 613-960-4000
House of Commons
Non-urgent: [redacted]
Emergency Parliamentary Protective Service: 613-992-7000
Canadian Centre for Cyber Security
T : 1-833-292-3788 | E : contact@cyber.gc.ca
State of Infrastructure in Canada - Fall 2021
What is infrastructure?
- Infrastructure is a set of tangible assets that support the production, delivery and consumption of goods and services by governments, organizations and individuals. Examples of these assets include schools and hospitals; roads, rails and ports; potable water and water treatment facilities; and cultural and recreational facilities.
- Governments generally support public infrastructure, which is subset of total infrastructure and refers to assets that provide a service to the public, such as public transit, broadband connectivity, electricity and libraries.
- The construction of infrastructure involves a broad range of industries – ranging from natural resources (e.g., mining) and manufacturing (e.g., cement), to engineering and construction.
Does Canada have the right kind of infrastructure to meet current and future needs?
- To answer this question, it is important to understand Canada's current state of infrastructure, which can be assessed in a number of ways:
- Stock: Accumulation of an inventory of tangible infrastructure assets over time.
- Investment: Infrastructure spending for the purposes of construction of tangible assets.
- Condition: Standardized scale used to define the current state of an infrastructure asset (i.e., very good, good, fair, poor, or very poor).
- Given the changing nature of Canadian society – demographic change, the growth of cities, climate change – understanding current assets cannot tell us whether what we have is what we will need in future.
- All asset owners and governments need to be considering how future challenges will impact their need for infrastructure. This can be achieved through asset management practices, and efforts like the National Infrastructure Assessment*, which is intended to provide a long-term perspective on Canada's infrastructure needs.
* - Building Pathways to 2050: Moving Forward on the National Infrastructure Assessment.
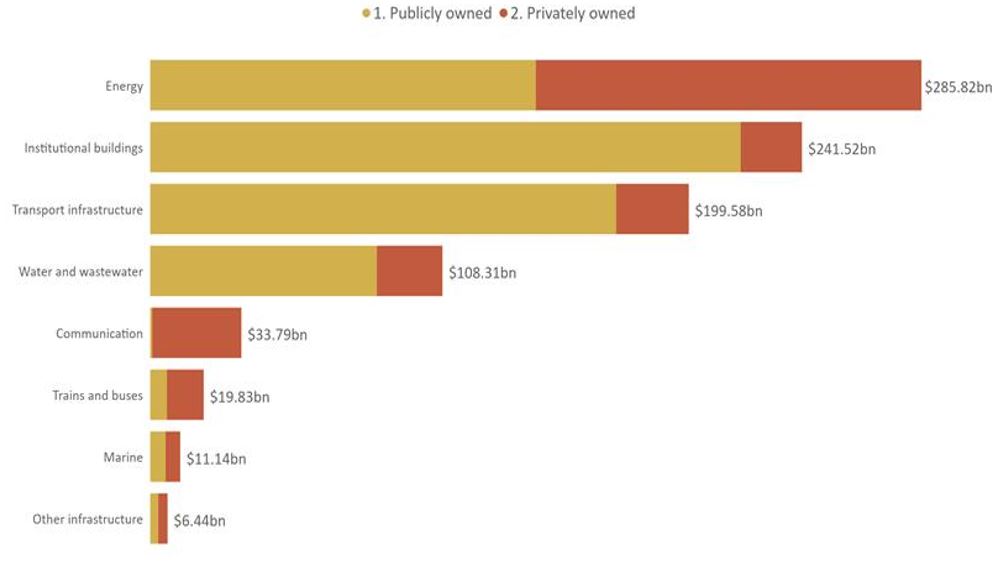
The public sector owns more than two-thirds of over $900 billion in infrastructure assets in Canada – most of which is owned by provinces, territories and municipalities
Breakdown of stock value by infrastructure type and by ownership
Text description of image
|
Asset Group |
Private |
Public |
Total |
|---|---|---|---|
|
Energy |
$142,921,000,000 |
$142,897,000,000 |
$285,818,000,000 |
|
Institutional Buildings |
$22,706,000,000 |
$218,816,000,000 |
$241,522,000,000 |
|
Transportation |
$26,876,000,000 |
$172,700,000,000 |
$199,576,000,000 |
|
Water and Wastewater |
$24,356,000,000 |
$83,954,000,000 |
$108,310,000,000 |
|
Communication |
$33,004,000,000 |
$786,000,000 |
$33,790,000,000 |
|
Trains and Buses |
$13,654,000,000 |
$6,177,000,000 |
$19,831,000,000 |
|
Marine |
$5,452,000,000 |
$5,689,000,000 |
$11,141,000,000 |
|
Other |
$3,459,000,000 |
$2,983,000,000 |
$6,442,000,000 |
- 70% of infrastructure is publicly-owned
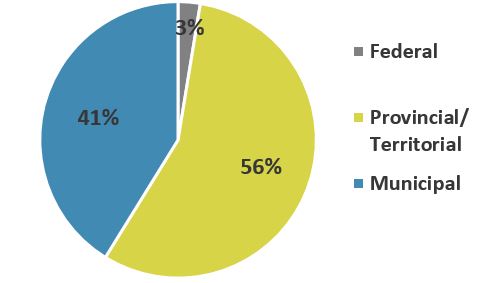
- Of the 70%, the federal government owns approximately 3% of publicly-owned infrastructure
Ownership of Publicly-owned Infrastructure by Order of Government (2020)
Text description of image.
|
Ownership |
Net Stock (Percentage) |
|---|---|
|
Federal |
3% |
|
Provincial/Territorial |
56% |
|
Municipal |
41% |
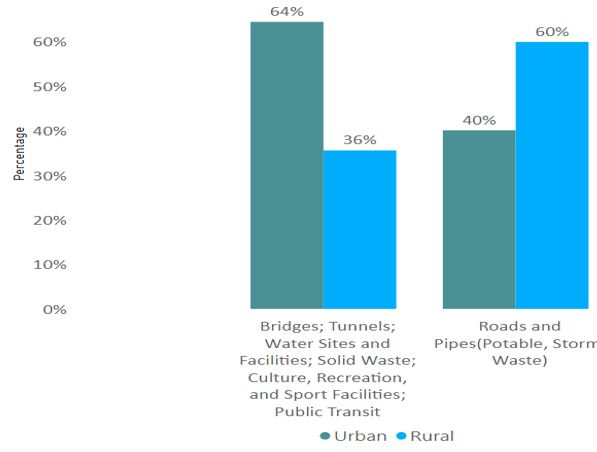
Breakdown of Asset ownership by Urban/Rural split
Text description of image.
|
Asset |
Urban |
Rural |
|---|---|---|
|
Bridges; Tunnels; Water Sites and Facilities; Solid Waste; Culture, Recreation, and Sport Facilities; Public Transit |
64.43% |
35.57% |
|
Roads and Pipes (Potable, Storm, Waste) |
40.07% |
59.93% |
The federal government must work with others, as a funder and influencer, to support infrastructure.
Source: Infrastructure Economic Account (Statistics Canada, July 2021 data).
Note: The net stock held has been used as a proxy for ownership and is calculated with Federal includes Defense Services; Provincial/Territorial includes Hospitals, Nursing and residential care facilities; Educational services. Other industries categories: Indigenous (Aboriginal) and Government Business Enterprises are excluded from this analysis.
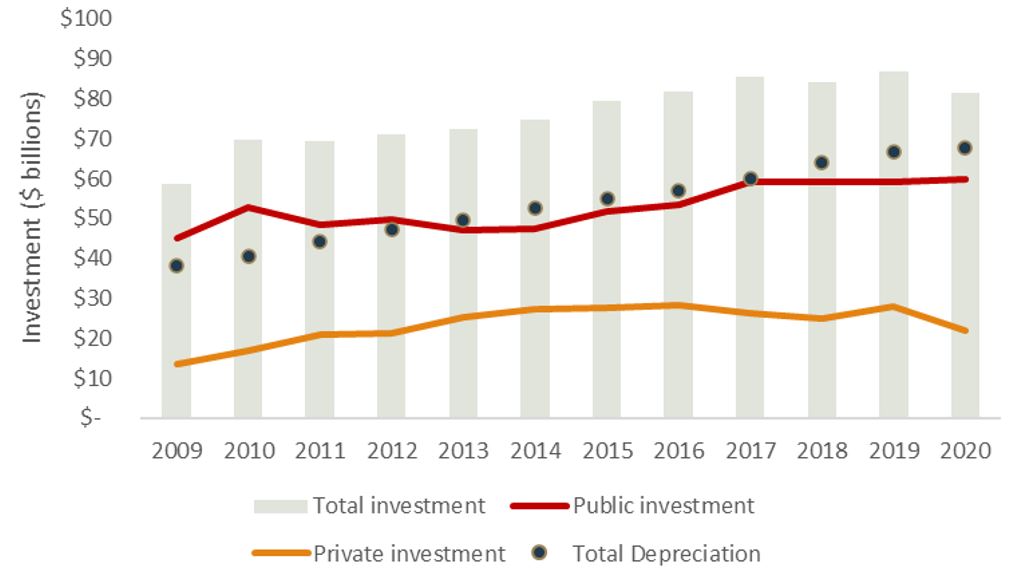
Investment in infrastructure has grown in recent years, which has increased the stock and its depreciation
- Public infrastructure investment has increased some 33% since 2009 and remained stable in 2020, while private investment declined due to the economic downturn.
- In 2020, total depreciation ($69 billion) was just below total investment levels ($82 billion) providing an understanding of investment levels required to keep infrastructure stock in good working condition.
Infrastructure investment, current dollars
Text description of image.
|
Years |
Total investment |
Private investment |
Public investment |
Total Depreciation |
|---|---|---|---|---|
|
2009 |
59,121 |
12,960 |
46,161 |
38,772 |
|
2010 |
71,146 |
17,058 |
54,088 |
41,341 |
|
2011 |
70,873 |
20,919 |
49,954 |
45,001 |
|
2012 |
72,192 |
20,853 |
51,338 |
48,158 |
|
2013 |
73,289 |
23,711 |
49,578 |
50,460 |
|
2014 |
77,429 |
26,908 |
50,521 |
53,453 |
|
2015 |
77,608 |
24,315 |
53,293 |
56,017 |
|
2016 |
77,149 |
23,574 |
53,575 |
57,959 |
|
2017 |
82,229 |
21,294 |
60,935 |
60,412 |
|
2018 |
83,656 |
20,912 |
62,744 |
63,881 |
|
2019 |
82,204 |
22,741 |
59,463 |
66,770 |
|
2020 |
82,513 |
21,259 |
61,254 |
67,936 |
Source: Infrastructure Economic Account (Statistics Canada, July 2021 data);
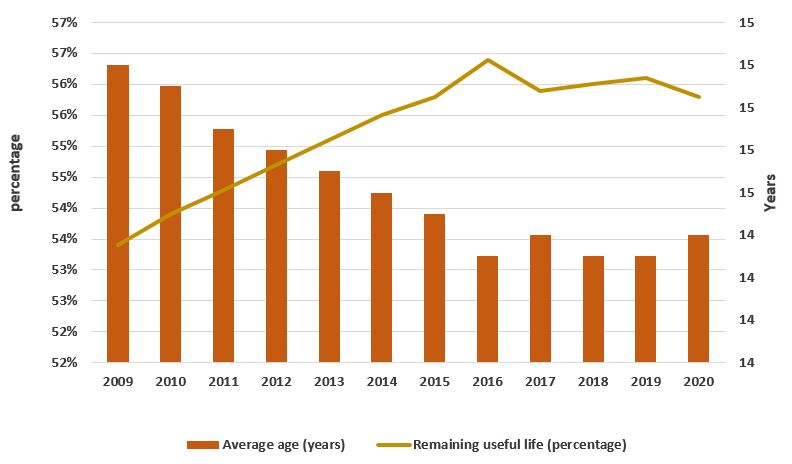
Having an understanding of infrastructure average age and remaining service life helps asset owners to inform early planning and management
- The average age and remaining useful service life of infrastructure assets have improved since 2009 and have remained stable since 2017.
- According to the Canadian Infrastructure Report Card, early investment in maintenance and repair, while an asset's service life remains high, can eliminate or delay more costly rehabilitation or reconstruction spending in the future.
Average age and Remaining Useful Service Life of total infrastructure assets
Text description of image.
|
Years |
Average age |
Remaining useful life |
|---|---|---|
|
2009 |
15 |
54 |
|
2010 |
14.7 |
55 |
|
2011 |
14.4 |
55.8 |
|
2012 |
14.2 |
56.5 |
|
2013 |
14 |
57.1 |
|
2014 |
13.9 |
57.6 |
|
2015 |
13.8 |
58 |
|
2016 |
13.7 |
58.2 |
|
2017 |
13.6 |
58.5 |
|
2018 |
13.5 |
58.7 |
|
2019 |
13.5 |
58.7 |
|
2020 |
13.5 |
58.6 |
Source: Infrastructure Economic Account (Statistics Canada, July 2021 data); Roads example: http://canadianinfrastructure.ca/downloads/canadian-infrastructure-report-card-2019.pdf
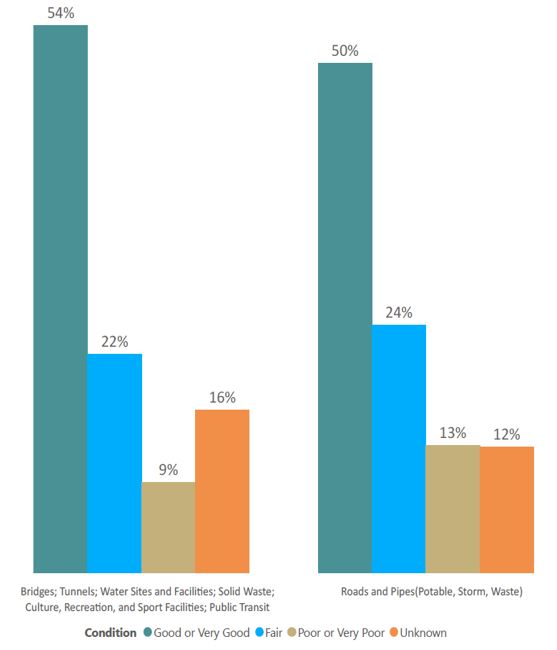
Municipal asset owners report that an estimated 50% of their infrastructure assets are in good or very good condition
- Statistics Canada's biennial survey of Canada's Core Public Infrastructure* provides condition ratings of assets from municipalities across Canada.
- Some 12-16% of municipal asset owners reported their condition as Unknown, suggesting a data gap for informed infrastructure planning.
- In the future, communities should consider how they can better leverage real-time data (e.g., sensors) to assess the condition of their existing assets.
Municipal Asset Condition
Text description of image.
|
Asset |
Percentage |
Condition |
|---|---|---|
|
Bridges; Tunnels; Water Sites and Facilities; Solid Waste; Culture, Recreation, and Sport Facilities; Public Transit |
54.15% |
Good or Very Good |
|
Bridges; Tunnels; Water Sites and Facilities; Solid Waste; Culture, Recreation, and Sport Facilities; Public Transit |
21.63% |
Fair |
|
Bridges; Tunnels; Water Sites and Facilities; Solid Waste; Culture, Recreation, and Sport Facilities; Public Transit |
8.97% |
Poor or Very Poor |
|
Bridges; Tunnels; Water Sites and Facilities; Solid Waste; Culture, Recreation, and Sport Facilities; Public Transit |
16.14% |
Unknown |
|
Roads and Pipes(Potable, Storm, Waste) |
50.39% |
Good or Very Good |
|
Roads and Pipes(Potable, Storm, Waste) |
24.49% |
Fair |
|
Roads and Pipes(Potable, Storm, Waste) |
12.62% |
Poor or Very Poor |
|
Roads and Pipes(Potable, Storm, Waste) |
12.50% |
Unknown |
*Note: Canada's Core Public Infrastructure Survey (CCPI). CCPI primarily samples units at the municipal level, with a census of municipalities with at least 1,000 residents, and a sample of rural municipalities with at least 500 residents.
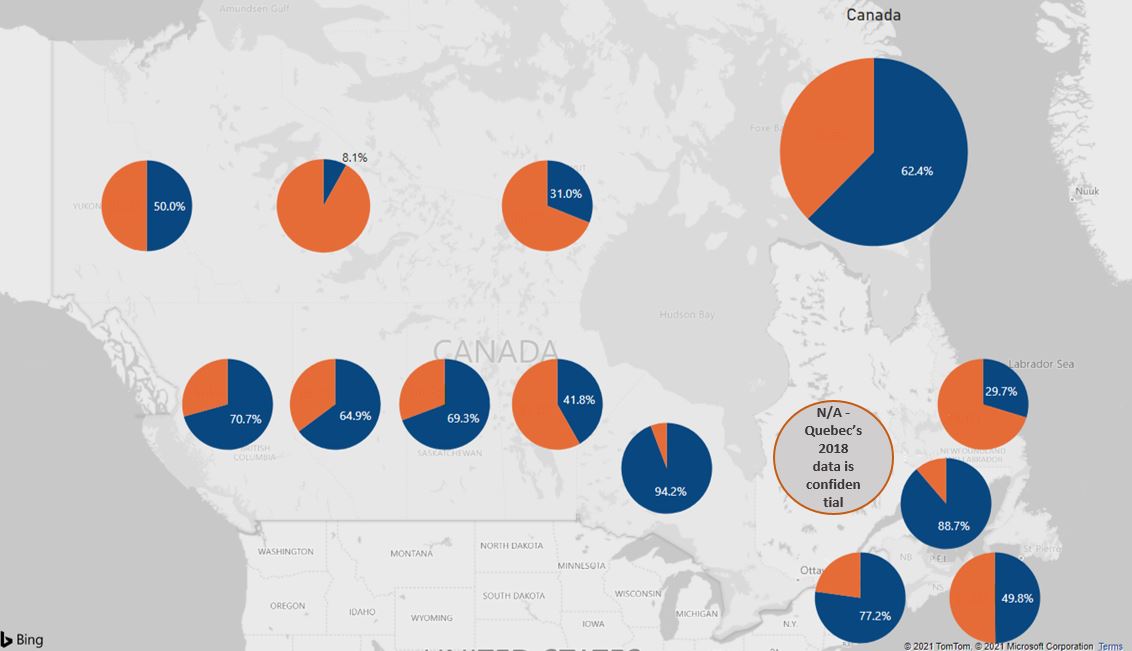
Asset management capacity is lower in smaller municipalities, and varies significantly among provinces and territories
There is notable variation in municipalities having a documented asset management plan, depending on their size:
- Only 29% of rural/small municipalities (i.e., less than 5,000 people) reported a documented plan.
- Of medium-sized municipalities (i.e., 5,000-30,000 people) 56% reported a documented plan; and
- 70% of large municipalities (i.e., 30,000 people or more) reported a documented plan.
Percentage of municipalities with an asset management plan in 2018
Text description of image.
A map of Canada depicts pie charts for each province and territory indicating the percentage of municipalities with asset management plans.
Province |
Percent Asset Management Plan |
Percent No Asset Management Plan |
|---|---|---|
|
Newfoundland and Labrador |
29.7% |
70.3% |
|
Prince Edward Island |
88.7% |
11.3% |
|
Nova Scotia |
49.8% |
50.2% |
|
New Brunswick |
77.2% |
22.8% |
|
Quebec |
N/A - Quebec's 2018 data is confidential |
N/A - Quebec's 2018 data is confidential |
|
Ontario |
94.2% |
5.8% |
|
Manitoba |
41.8% |
58.2% |
|
Saskatchewan |
69.3% |
30.7% |
|
Alberta |
64.9% |
35.1% |
|
British Columbia |
70.7% |
29.3% |
|
Yukon |
50.0% |
50.0% |
|
Northwest Territory |
8.1% |
91.9% |
|
Nunavut |
31.0% |
69.0% |
|
Canada |
62.4% |
37.6% |
Note: An average of 62% of municipalities have an asset management plan. Ontario is the only jurisdiction with asset management planning legislation. Quebec's 2018 data is confidential.
- An average of 62% of municipalities have an asset management plan
- Ontario is the only jurisdiction with asset management planning legislation.
- Quebec's 2018 data is confidential
Beyond the current state of infrastructure, Canada’s future infrastructure needs are tied to changing circumstances
- Several factors will influence the choices governments make about where to invest their next dollar on infrastructure:
- Demographic change: Canada's population is aging, and our cities are getting larger.
- Connectivity: The need for greater access to broadband was made very clear during COVID.
- Climate: Infrastructure must be resilient to the changing climate, and support mitigation goals.
- Indigenous Communities: Building an understanding and improving infrastructure is an essential component of reconciliation.
- Understanding these factors, especially in a constrained fiscal environment post-COVID, is necessary to ensure that every dollar is contributing to meeting future needs.
Cross-sectoral impacts of infrastructure
1. The economy
Infrastructure investment supports broad macroeconomic growth and Canada’s investment has been within the recommended range
- Infrastructure plays a critical component in the Canadian economy. Businesses and their employees rely on infrastructure to create the goods and services that drive the economic growth.
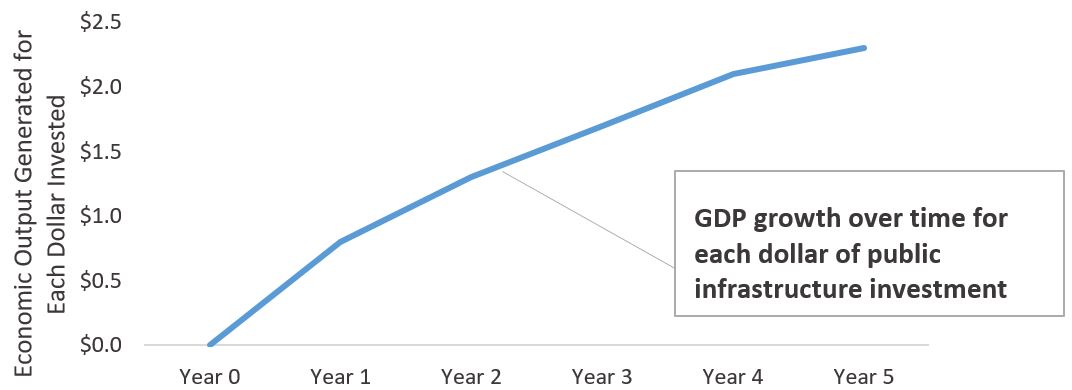
- While these benefits can be difficult to precisely measure, there is strong evidence that public infrastructure investment boosts overall economic output. According to the IMF, in advanced economies, every $1 of public infrastructure investment can boost total economic output by $2.3 after 5 years.
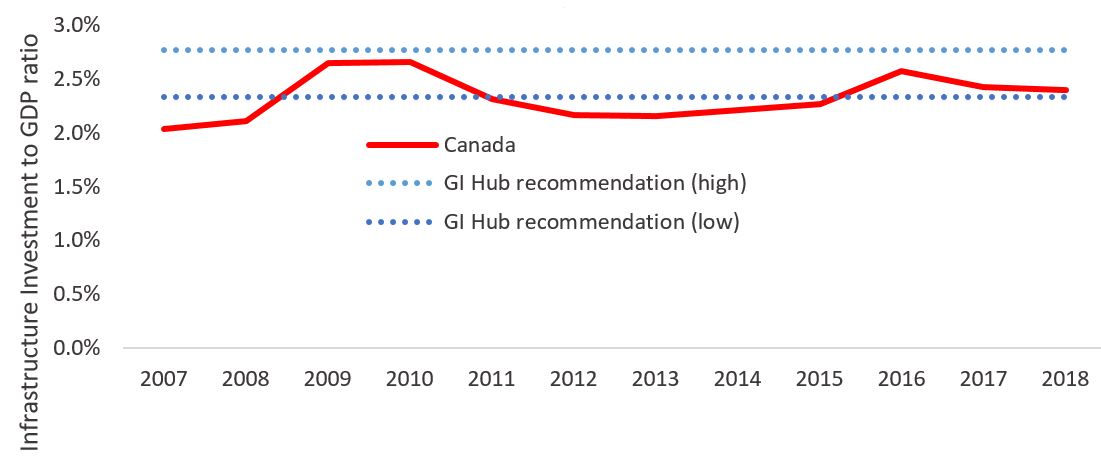
- Based on analysis from the Global Infrastructure Hub (a G20 infrastructure research body), Canada's average investment from 2007 to 2018 of 2.33% of GDP has been within the range of its recommended investment level (2.3% to 2.8%).
The Benefit of Public Infrastructure Investment
Text description of image.
|
Year |
Economic Output Generated for Each Dollar Invested |
|---|---|
|
Year 0 |
$0.00 |
|
Year 1 |
$0.80 |
|
Year 2 |
$1.30 |
|
Year 3 |
$1.70 |
|
Year 4 |
$2.10 |
|
Year 5 |
$2.30 |
- GDP growth over time for each dollar of public infrastructure investment
Canada's level of infrastructure investment has been within the recommended range of 2.3%-2.8%
Text description of image.
A line graph depicts Canada's level of infrastructure investment compared to the GI Hubs recommended range of 2.3% to 2.8% of GDP.
Years |
Infrastructure Investment to GDP ratio |
|---|---|
|
2007 |
2.04% |
|
2008 |
2.10% |
|
2009 |
2.64% |
|
2010 |
2.66% |
|
2011 |
2.31% |
|
2012 |
2.16% |
|
2013 |
2.16% |
|
2014 |
2.21% |
|
2015 |
2.26% |
|
2016 |
2.57% |
|
2017 |
2.42% |
|
2018 |
2.40% |
Sources: International Monetary Fund (IMF) and Global Infrastructure Hub - A G20 INITIATIVE (gihub.org)
A highly productive construction sector is critical to the continued growth of Canada’s infrastructure
As Canada recovers from the COVID-19 pandemic, a healthy construction sector will be integral to building back a stronger and more resilient country
- From connecting the country through advanced transit systems to providing roads, green buildings and wastewater facilities, Canadians rely on the construction sector for essential infrastructure.
- An emerging opportunity is the retrofit market, which will rely on the sector's labour and technological capabilities to transform and build new energy and ventilation systems.
- Canada's infrastructure needs will continue to evolve, and the construction sector must be innovative and resilient in order to meet changing demands. This includes being well-equipped to embrace digitization and having the financial resources to invest in cleaner technologies and processes.
- Governmental support and favourable regulatory frameworks are necessary to create confidence, leverage private sector co-investment, and ensure the continued success of the sector.
Two key challenges facing the construction sector are:
1) Volatile Commodity Prices
- Fluctuating commodity prices have forced the construction sector to grapple with elevated project costs, risking building delays, quality reductions and project abandonment.
2) Labour Shortages
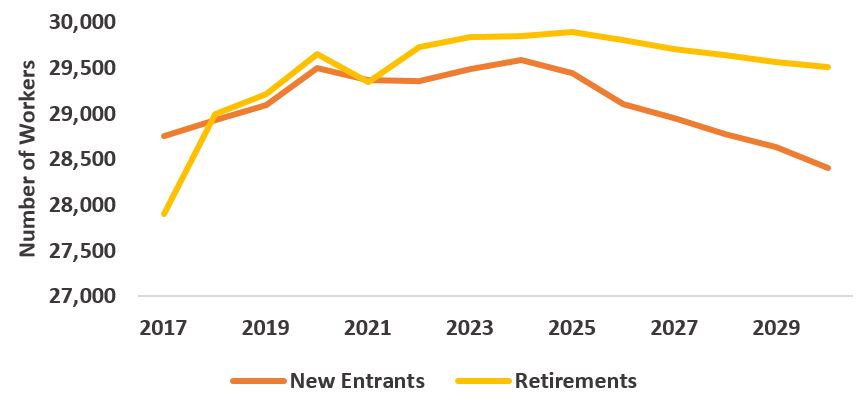
- By 2030, 22% of the current construction labour force is expected to retire, highlighting labour shortages as an emerging risk.
- Construction sector job vacancies are at record highs and positions are becoming increasingly difficult to fill. Meeting Canada's current and future labour force needs will require ongoing commitments to training and apprentice programs.
Canada Labour Force Change Forecast
Text description of image.
Data Type |
New Entrants |
Retirements |
|---|---|---|
|
2017 |
28,752 |
27,906 |
|
2018 |
28,929 |
28,998 |
|
2019 |
29,090 |
29,217 |
|
2020 |
29,495 |
29,651 |
|
2021 |
29,366 |
29,347 |
|
2022 |
29,353 |
29,722 |
|
2023 |
29,482 |
29,841 |
|
2024 |
29,587 |
29,851 |
|
2025 |
29,445 |
29,894 |
|
2026 |
29,105 |
29,799 |
|
2027 |
28,950 |
29,700 |
|
2028 |
28,779 |
29,635 |
|
2029 |
28,637 |
29,568 |
|
2030 |
28,402 |
29,511 |
Source: BuildForce Canada (2021)
Infrastructure is home to high paying jobs yet equality remains a concern
Construction industry accounts for 50% of production, but other industries play big roles
- Among the construction industry, the vast majority of enterprises are small- and medium-sized.
- In the tech industry, firms are innovating in areas such as traffic management, efficient streetlights and mapping.
Infrastructure jobs and related demographics
In 2020, there were some 540,000 jobs related to infrastructure in Canada (direct and indirect employment):
- 1.17 billion hours worked in total with an average hourly wage of $32.04 (compared to a Canadian average of $29.61)
- Females had a lower average hourly wage than males nationally over time.
Infrastructure jobs by industry in 2019 (thousands)
Text description of image.
Industry |
Number of Jobs (thousands) |
Percent of Jobs |
|---|---|---|
|
Professional services |
131 |
22% |
|
Construction |
313 |
51% |
|
Trade and Transportation |
66 |
11% |
|
Manufacturing |
57 |
9% |
|
Other industries |
41 |
7% |
How does that average hourly wage vary over time and by sex?
Text description of image.
|
Years |
Male |
Female |
|---|---|---|
|
2009 |
28.93 |
24.33 |
|
2010 |
29.28 |
24.13 |
|
2011 |
30 |
25.07 |
|
2012 |
31.07 |
26.13 |
|
2013 |
30.54 |
26.34 |
|
2014 |
31.18 |
26.93 |
|
2015 |
32.48 |
27.86 |
|
2016 |
33.38 |
28.02 |
|
2017 |
33.41 |
28.14 |
|
2018 |
33.23 |
27.96 |
|
2019 |
33.11 |
28.48 |
Immigrants represented 25.4% of all workers in infrastructure, with female immigrant workers having a larger share than non-immigrant workers.
Text description of image.
|
Type of Worker |
Female |
Male |
|---|---|---|
|
Immigrant |
29.40% |
70.60% |
|
Non-immigrant |
25.70% |
74.30% |
Sources: Infrastructure Economic Account (Statistics Canada); Table 14-10-0023-01 (Statistics Canada), National Summary 2019-2028 (BuildForce).
2. The environment
Infrastructure is crucial to mitigating and adapting to climate change
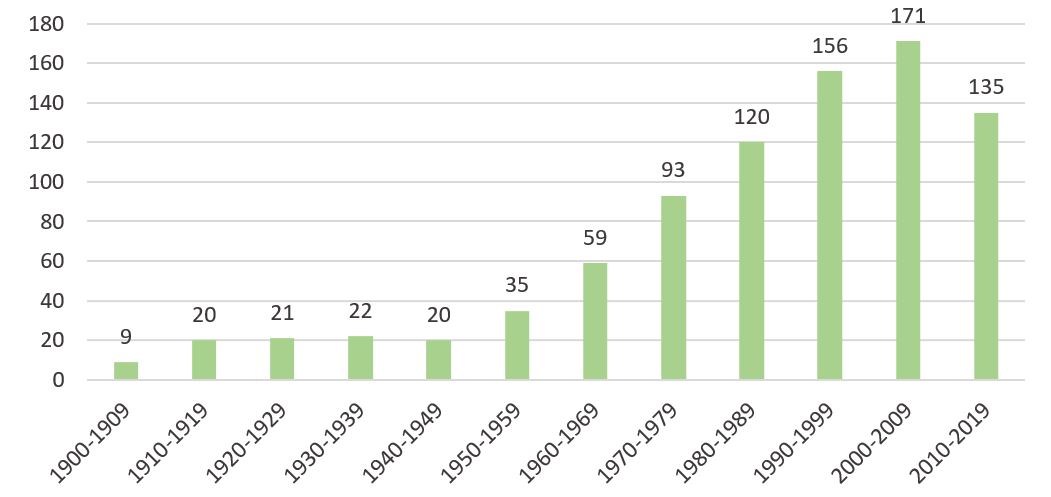
Infrastructure is highly affected by climate change – natural disasters are more frequent and severe
- Resilient infrastructure can better withstand and protect communities from impacts of climate change.
Use of climate-resilient infrastructure offers much potential to reduce risk
- Data, guidance, standards and codes can help inform how infrastructure is located, designed, built and operated – to adapt to a changing climate.
Number of Natural Disasters in Canada by Decade
Text description of image.
|
Decades |
Natural Disasters |
|---|---|
|
1900-1909 |
9 |
|
1910-1919 |
20 |
|
1920-1929 |
21 |
|
1930-1939 |
22 |
|
1940-1949 |
20 |
|
1950-1959 |
35 |
|
1960-1969 |
59 |
|
1970-1979 |
93 |
|
1980-1989 |
120 |
|
1990-1999 |
156 |
|
2000-2009 |
171 |
|
2010-2019 |
135 |
Text description of image
This figure demonstrates the proportion of damages by category that can be avoided through adaptation measures. Nearly 40% of geopolitical dynamics and fisheries damages can be avoided through adaptation. Over 40% of ecosystems damages can be avoided through adaptation. Nearly 60% of forestry and water damages can be avoided through adaptation. Approximately 70% of coastal communities, northern communities and agriculture and food damages can be avoided through adaptation. About 80% of human health and wellness, physical infrastructure and governance and capacity damages can be avoided through adaptation.
Sources: Canadian Disasters Database (Public Safety Canada, 2020); Canada's Top Climate Change Risks (Council of Canadian Academies, 2019).
Resilient infrastructure requires efficient designs and planning
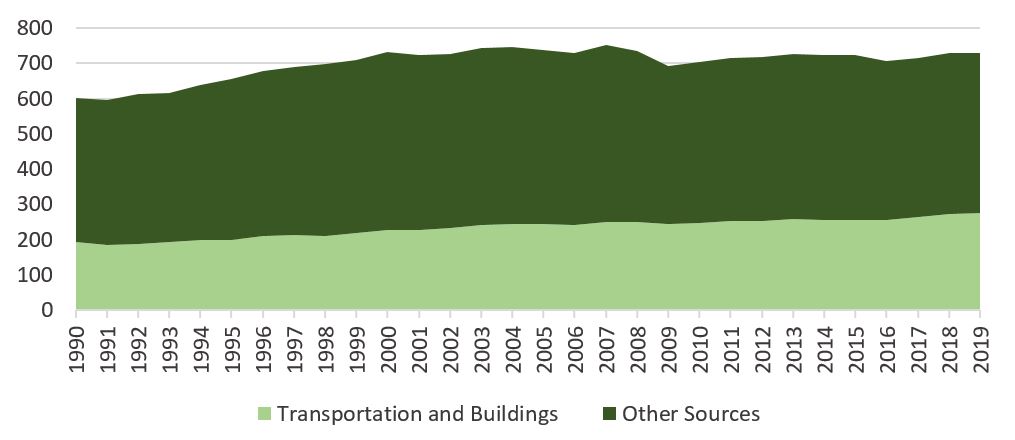
In 2019, transportation and buildings account for approximately 38% of all greenhouse gas emissions
- What is built defines the range of options available to individuals and companies (e.g., transit vs. roads).
- How infrastructure is built defines the baseline emissions level, as inefficient designs become “locked in”. More efficient future designs are expected to reduce the operational emissions intensity of infrastructure. Current estimates suggest that future efficient designs will reduce operation emissions to 50% from the current level of 89%.
- Overall, the percent of municipal owners of infrastructure in Canada that consider climate change mitigation and adaptation in their decision-making process remains low, at less than half of owners for most asset categories.
Megatonnes of CO2-equivalent emissions by source
Text description of image.
|
Year |
Transportation and Buildings |
Other Sources |
|---|---|---|
|
1990 |
191.8 |
409.8 |
|
1991 |
184.9 |
410.9 |
|
1992 |
187.6 |
425.9 |
|
1993 |
192.7 |
424.1 |
|
1994 |
197.6 |
440.3 |
|
1995 |
199.1 |
457.2 |
|
1996 |
209 |
469.6 |
|
1997 |
212.3 |
478.9 |
|
1998 |
209.7 |
487.2 |
|
1999 |
219.4 |
490.2 |
|
2000 |
227.9 |
505.5 |
|
2001 |
226.3 |
496.6 |
|
2002 |
231.8 |
494.7 |
|
2003 |
241.2 |
503.6 |
|
2004 |
244.2 |
501.8 |
|
2005 |
244.3 |
494.5 |
|
2006 |
240.2 |
489.9 |
|
2007 |
249.7 |
502 |
|
2008 |
249.4 |
486.4 |
|
2009 |
244.4 |
449 |
|
2010 |
247 |
455.7 |
|
2011 |
253.4 |
460.7 |
|
2012 |
253.8 |
463.4 |
|
2013 |
258 |
467.4 |
|
2014 |
256.2 |
466.5 |
|
2015 |
255.3 |
467.7 |
|
2016 |
255.1 |
452 |
|
2017 |
264.7 |
451.3 |
|
2018 |
273.9 |
454.6 |
|
2019 |
276.5 |
453.8 |
Percent of Municipal Owners in Canada that Consider Climate Change Mitigation and Adaptation in their Decision-Making Process by Asset Category, 2018
Text description of image.
|
Assets |
Considers |
Does not consider |
|---|---|---|
|
Stormwater |
50.20% |
49.80% |
|
Wastewater |
43.90% |
56.10% |
|
Potable water |
42.50% |
57.50% |
|
Roads |
41.80% |
58.20% |
|
Bridges and tunnels |
39.50% |
60.50% |
|
Culture, recreation, and sports facilities |
35.10% |
64.90% |
|
Solid waste |
30.20% |
69.80% |
|
Public transit |
27.50% |
72.50% |
Sources: Greenhouse Gas Emissions (Environment and Climate Change Canada, 2019); GHG Emissions from Building Construction (Green Construction Board, 2014); Canada's Core Public Infrastructure Survey (CCPI)
Environmental improvements are being made during the construction of infrastructure assets
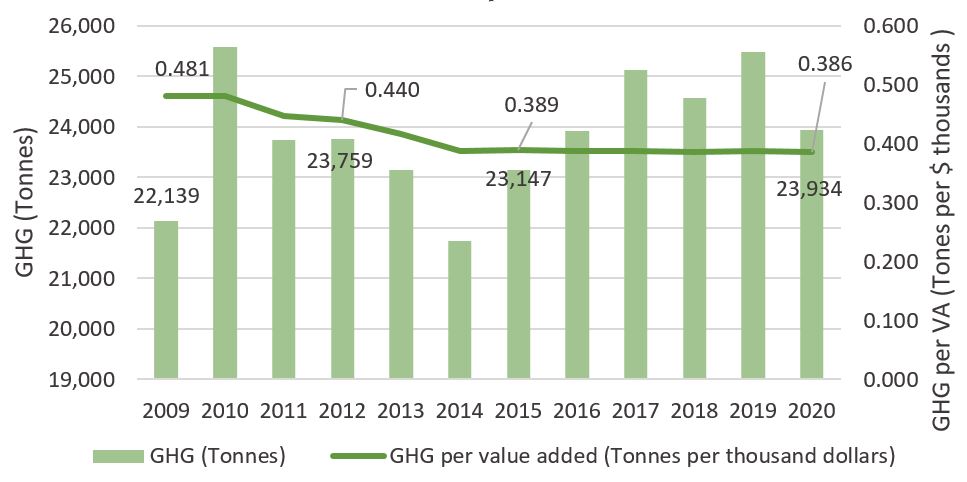
As investment increases, so do the levels of GHG emissions
- However, greenhouse gas emissions per value added to the Canadian economy has decreased since 2012 and remained stable from 2015 to 2020, suggesting that environmental improvements are being made during the construction of these assets.
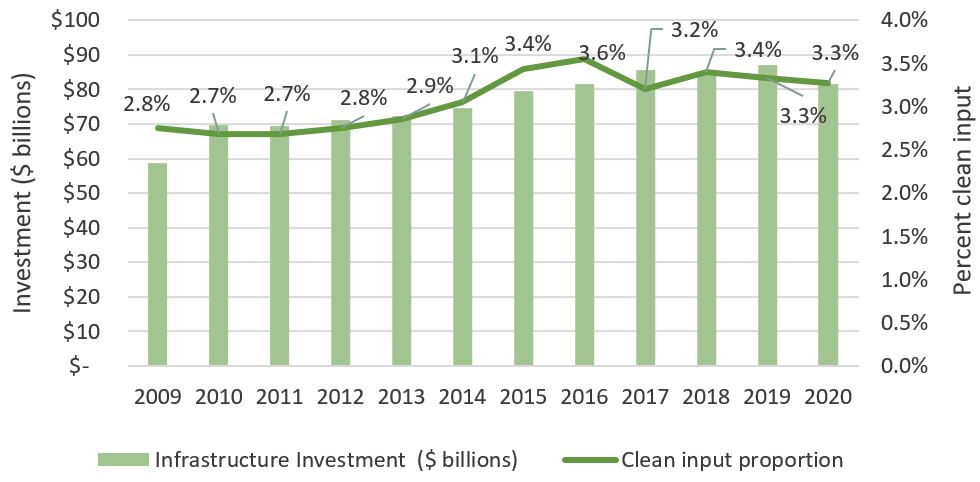
- Since 2010, the proportion of infrastructure industries' clean inputs have increased. Environmental and clean technology inputs have increased from $1.87 billion in 2010 to $2.67 billion in 2020.
- The proportion of clean input assesses whether an infrastructure asset was constructed using environmental and clean technology inputs (a process/product/service that reduces environmental impacts).
- The proportion of transportation engineering clean inputs (Highway and road structures and networks, bridges, tunnels, railway lines, runways) has more than doubled over the last decade.
- The growth in infrastructure investment by clean technology inputs contributes to 3% of GDP overall for all clean technology products sector.
GHG and GHG per value added
Text description of image.
|
Years |
GHG (Tonnes) |
GHG per value added (Tonnes per thousand dollars) |
|---|---|---|
|
2009 |
22,139 |
0.481 |
|
2010 |
25,585 |
0.481 |
|
2011 |
23,732 |
0.447 |
|
2012 |
23,759 |
0.44 |
|
2013 |
23,141 |
0.417 |
|
2014 |
21,747 |
0.388 |
|
2015 |
23,147 |
0.389 |
|
2016 |
23,920 |
0.387 |
|
2017 |
25,125 |
0.388 |
|
2018 |
24,571 |
0.386 |
|
2019 |
25,492 |
0.387 |
|
2020 |
23,934 |
0.386 |
Infrastructure investments and proportion of clean inputs
Text description of image.
Years |
Infrastructure Investment ($ billions) |
Clean input proportion |
|---|---|---|
|
2009 |
59 |
2.8% |
|
2010 |
70 |
2.7% |
|
2011 |
70 |
2.7% |
|
2012 |
71 |
2.8% |
|
2013 |
72 |
2.9% |
|
2014 |
75 |
3.1% |
|
2015 |
79 |
3.4% |
|
2016 |
82 |
3.6% |
|
2017 |
86 |
3.2% |
|
2018 |
84 |
3.4% |
|
2019 |
87 |
3.3% |
|
2020 |
82 |
3.3% |
Source: Infrastructure Economic Accounts (July, 2020)
3. Our communities
Infrastructure impacts a community’s ability to participate in the digital economy and provides opportunities to underserved populations
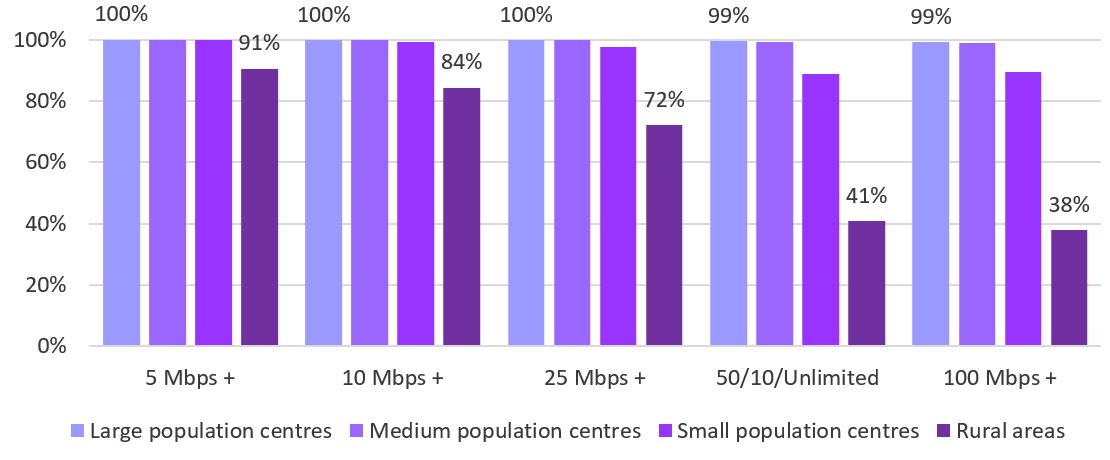
Connectivity is an essential service and a prerequisite to participate in the digital economy:
- There is still a large gap between urban and rural access to high-speed broadband internet connections.
- In all three territories, broadband internet access is even lower.
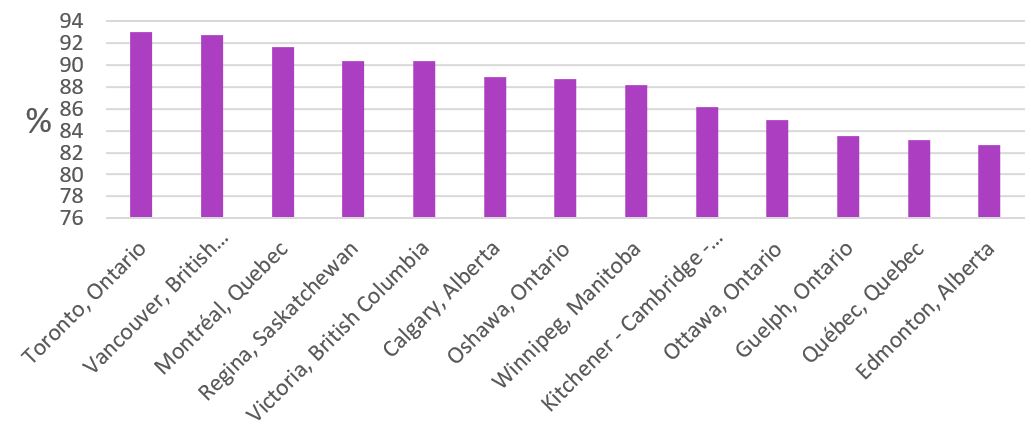
Strong communities requires easy access to social and health services, including high levels of proximity to public transportation in canada's metropolitan areas:
- Canada's three largest metropolitan areas have the most convenient proximity to public transportation.
- Convenient access to public transport is generally lower in smaller metropolitan areas.
Fixed Broadband Speed by Population Centres and Rural Areas, 2018
Text description of image.
|
|
5 Mbps + |
10 Mbps + |
25 Mbps + |
50/10/Unlimited |
100 Mbps + |
|---|---|---|---|---|---|
|
Large population centres |
100% |
100% |
100% |
99% |
99% |
|
Medium population centres |
100% |
100% |
100% |
99% |
99% |
|
Small population centres |
100% |
99% |
98% |
89% |
89% |
|
Rural areas |
91% |
84% |
72% |
41% |
38% |
Percentage of population less than 500m from public transit access point
Text description of image.
City |
Percentage |
|---|---|
|
Toronto, Ontario |
93 |
|
Vancouver, British Columbia |
92.7 |
|
Montréal, Quebec |
91.6 |
|
Regina, Saskatchewan |
90.4 |
|
Victoria, British Columbia |
90.4 |
|
Calgary, Alberta |
88.9 |
|
Oshawa, Ontario |
88.7 |
|
Winnipeg, Manitoba |
88.2 |
|
Kitchener - Cambridge - Waterloo, Ontario |
86.2 |
|
Ottawa, Ontario |
85 |
|
Guelph, Ontario |
83.5 |
|
Québec, Quebec |
83.1 |
|
Edmonton, Alberta |
82.7 |
The state of infrastructure – a summary
- Canada's infrastructure stock has grown to over $900 billion over the last decade, equivalent to almost 40 per cent of GDP. Ongoing investment is needed to offset the effects of depreciation.
- To address climate change, improve social inclusion, and support a higher standard of living for Canadians, ongoing partnerships with other levels of government, academia and the private sector are necessary.
- Further strengthening infrastructure data and evidence, through partnerships with various data owners including provinces, territories, municipalities, will serve infrastructure decision-makers now and into the future.
Report a problem on this page
- Date modified:
