Evaluation of Canada Community-Building Fund (formerly Gas Tax Fund)
Evaluation of Canada Community-Building Fund (formerly Gas Tax Fund)
Table of Contents
- 1.0 Program Overview
- 2.0 Evaluation Objective and Scope
- 3.0 Findings, Conclusions and Recommendations
- Annex A: Detailed Findings
- Annex B: Management Action Plan
- Annex C: Methodology
- Annex D: Program Funding
1.0 Program Overview
CCBF Description
The Gas Tax Fund (GTF) was launched in 2005 to provide predictable funding to municipalities to support environmentally sustainable municipal infrastructure. Budget 2011 announced that the Gas Tax funding would be permanent, and was legislated at $2 billion per year starting in 2014-15. In 2013, the fund was indexed at 2% per year.
In 2016, the Investing in Canada Plan (IICP), a horizontal federal initiative spanning multiple government departments and agencies, was announced. At this time funding for the GTF began to be reported on as a part of the IICP horizontal initiative, along with unspent funds from 2005-2016.
On June 29, 2021 the GTF was renamed the Canada Community-Building Fund (CCBF) to better reflect the program’s evolution over time to a flexible and permanent source of federal infrastructure funding to support community infrastructure projects.
The CCBF funding is managed through agreements between Infrastructure Canada (INFC) and 15 signatories: 12 provinces and territories, 2 municipal associations, and the City of Toronto. It provides a permanent source of funding provided up front twice a year to signatories, who in turn flow this funding to their municipalities to support local infrastructure priorities.
First Nation Infrastructure Fund
CCBF funding for First Nations is delivered by Indigenous Services Canada as part of the First Nation Infrastructure Fund (FNIF). The fund helps improve and increase public infrastructure for First Nations located on reserves, on Crown land and on land set aside for the use and benefit of a First Nation. The FNIF pools funding from multiple sources to address First Nations' infrastructure needs, including from CCBF. Indigenous Services Canada accesses allocations directly through the consolidated revenue fund. The FNIF is not included in the scope for the CCBF evaluation, as it is delivered through and evaluated by Indigenous Services Canada.
CCBF Flexibility
Communities select how to best direct the funds, with the flexibility to fund across 18 project categoriesFootnote1 that support CCBF’s three national objectives (see Table 1 below). They can also choose to pool, bank and borrow against the funding, providing significant financial flexibility.
In recent years, the funding has supported approximately 4,000 projects each year, across over 3,900 communities.
CCBF Funding Allocation Formulas
The CCBF is allocated on a per-capita basis for provinces and territories based on Statistics Canada data. Prince Edward Island and each of the three territories also receive an additional base funding amount of 0.75% of total annual CCBF funding. Additional program funding information can be found in Annex D.
Some provinces and territories transfer all funding directly to communities while others reserve a portion for specific services or organisations (i.e. transit authorities, priority areas). For allocations directly to communities, certain provinces and territories provide base funding amounts (in some cases targeted specifically to communities under a threshold population size) in addition to per capita allocations, while others distribute funds solely on a per capita basis.
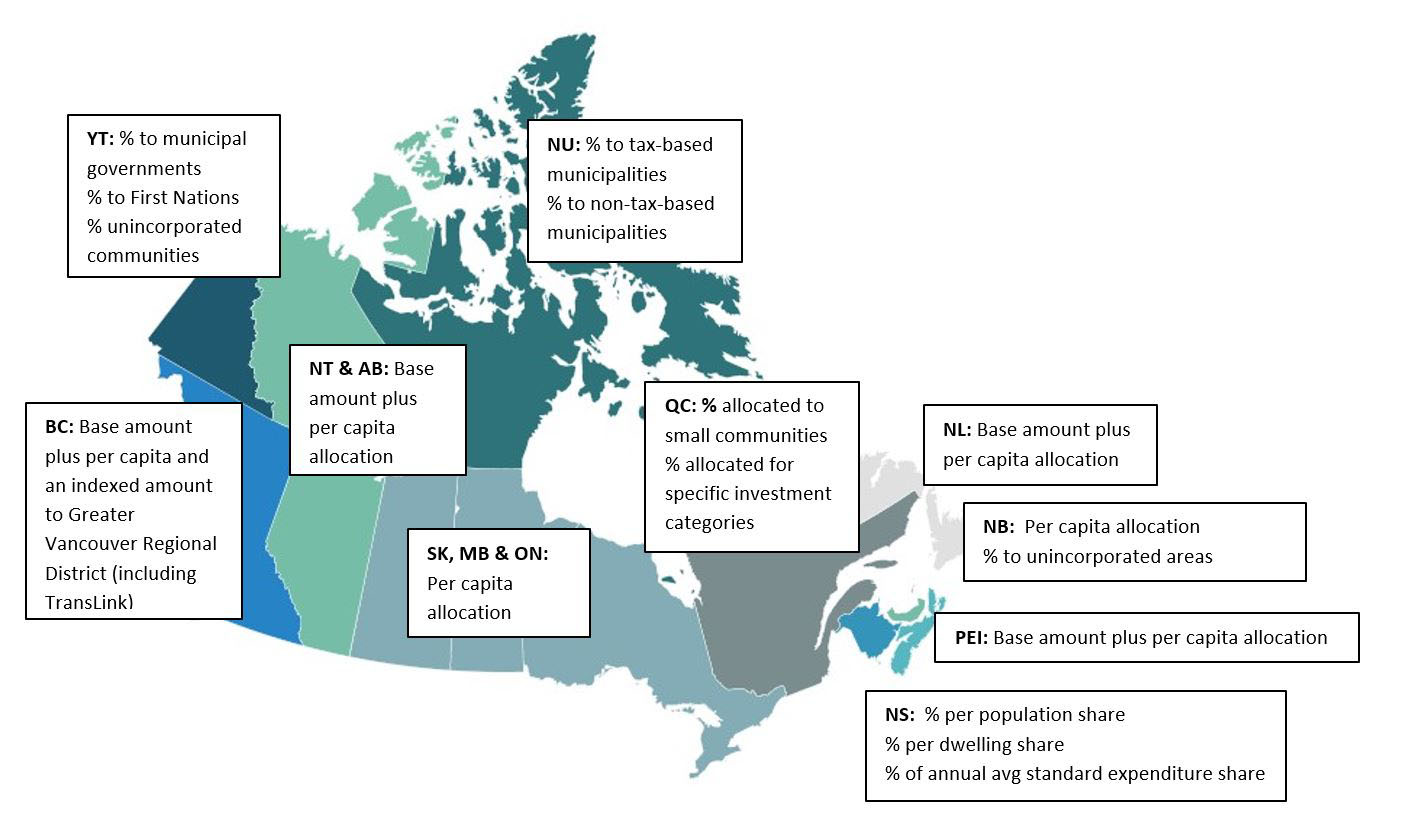
Figure 1. Provincial and territorial allocation formulas directed to ultimate recipients.
Text description of image 1
This figure represents the funding allocation formula within each province and territory. The formulas are as follows:
YT: % to municipal governments ; % to First Nations; % unincorporated communities
NT & AB: Base amount plus per capita allocation
NU: % to tax-based municipalities ; % to non-tax-based municipalities
BC: Base amount plus per capita and an indexed amount to Greater Vancouver Regional District (including TransLink)
SK, MB & ON: Per capita allocation
QC: % allocated to small communities; % allocated for specific investment categories
NL: Base amount plus per capita allocation
NB: Per capita allocation; % to unincorporated areas
PEI: Base amount plus per capita allocation
NS: % per population share; % per dwelling share; % of annual avg standard expenditure share
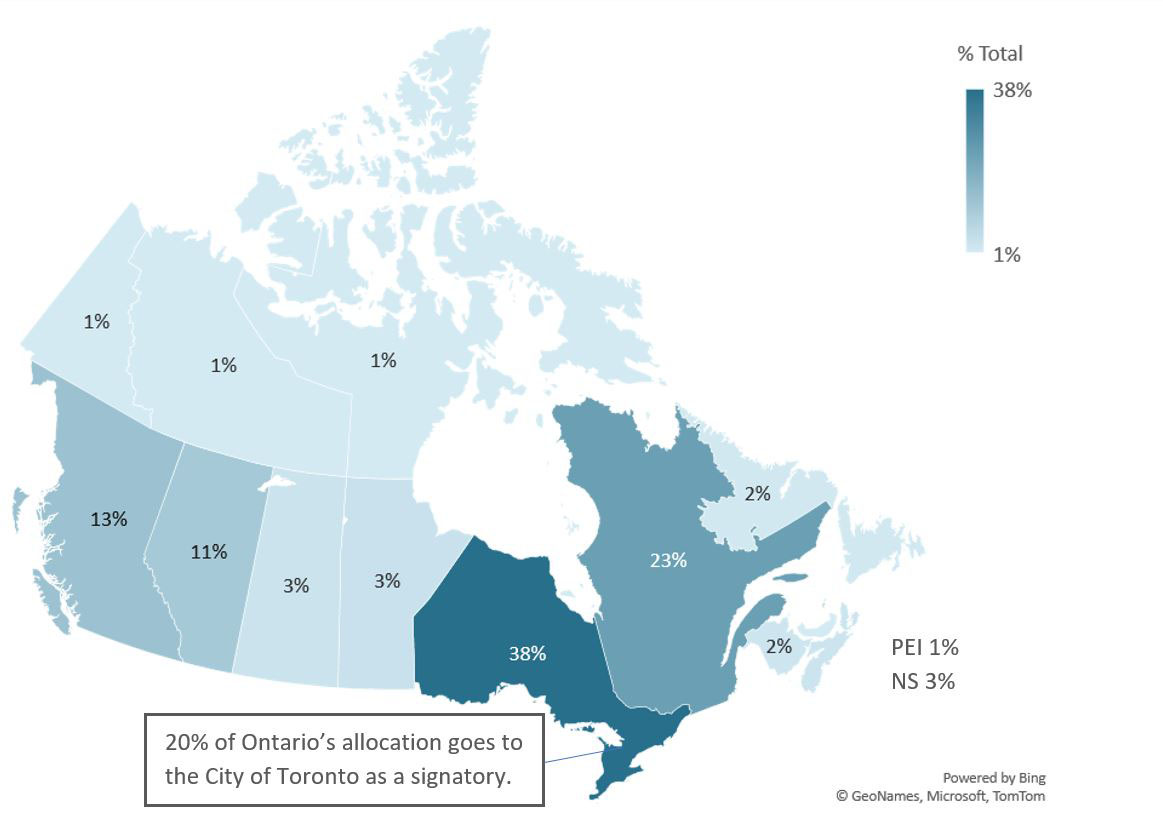
Figure 2. The figure represents the proportion of funding allocated to provinces and territories:
Text description of image 2
The figure represents the proportion of funding allocated to provinces and territories:
YT: 1%
NT: 1%
NU: 1%
BC: 13%
AB: 11%
SK: 3%
MB: 3%
ON: 38%
20% of Ontario’s allocation
goes to the City of Toronto as
a signatory.
QC: 23%
NL: 2%
NB: 2%
PEI: 1%
NS: 2%
CCBF Governance
Oversight Committees
Each province and territory has an independent oversight committee that is co-chaired with INFC. Membership includes provincial and territorial government representatives and signatories (in cases where the signatory is not a government), and in some cases also include representatives from regional municipal associations. The committees are used for monitoring, information sharing and decision making on issues relating to CCBF and its implementation. Meeting frequency varies by province and territory.
CCBF Workshop
The CCBF workshop is an annual event that includes representatives from all provinces and territories, as well as signatories in cases where the signatory is not a provincial or territorial government.
The objective of these workshops include:
- Highlighting past successes and outlining key information
- Networking, exchanging information, sharing best practices and strengthening collaboration with key partners
- Discussing information requirements (reporting, communications), performance measurement, improved outcomes reporting, and eligible categories
- Communicating key programs issues to strengthen delivery and share federal expectations
CCBF Reporting
Under the CCBF agreements, the signatories are accountable for reporting to Infrastructure Canada on the projects that were funded and the benefits that were achieved. This is done through Outcomes Reports and Annual Expenditure Reports (AERs).
Signatories report financial information annually through AERs. These reports contain information on money that was transferred, banked, or spent, and an annual project list showing the projects advanced in that year.
Outcomes Reports provide information on results achieved on projects funded through CCBF, with a focus on the three CCBF outcomes and the three national objectives. They are completed every five years, with the most recent reports including outcomes achieved up to 2018. Under the flexible CCBF model, signatories are using indicators that align with their local realities and priorities and present the information in a way that is relevant to their regional communities, so long as the indicators demonstrate the degree to which CCBF outcomes are supported or achieved.
CCBF Purpose
CCBF aims to support the following outcomes through their funding to ultimate recipients:
CCBF Outcomes
In addition to the national objectives, CCBF has three main outcomes:
- providing municipalities with access to a predictable source of funding
- investing in community infrastructure and
- supporting and encouraging long-term municipal planning and asset management practices.
Communities select how best to direct the funds with the flexibility to make strategic investments across the different project categories. The eligible project categories broadly support CCBF’s national objectives:
Table 1. Eligible project categories alignment with CCBF’s three national objectives:
| CCBF National Objective | Productivity and Economic Growth | Clean Environment |
Strong Cities and Communities |
|---|---|---|---|
| CCBF Project Category |
|
|
|
2.0 Evaluation objective and scope
Objective
The objective of the evaluation is to assess the effectiveness of the CCBF, as well as to assess progress made towards recommendations from a variety of internal and external reports related to the CCBF, including: the 2015 Evaluation of the Gas Tax Fund; the 2016 Office of the Auditor General’s (OAG ) report Federal Support for Sustainable Municipal Infrastructure, the 2019 Office of the Parliamentary Budget Officer’s (PBO) Infrastructure Update: Investments in Provinces and Municipalities and the 2020 PBO’s Update on the Investing in Canada Plan.
This evaluation also includes the government-wide commitment to include Gender-Based Analysis Plus (GBA+) in all evaluations as outlined in the Directive on Results. This analysis is reflected in question 7 and findings 10 and 11.
Scope
The period covered by this evaluation was between 2014-15 and 2020-21. The evaluation examined progress made towards national CCBF outcomes and objectives. The evaluation also looked at asset management practices and linkages to long-term planning, as well as progress made on performance measurement and collaboration with signatories. It has also included a review of data from the 2018 Outcome Reports. Finally, it considered the AERs, available up to 2019-20, which allowed for a better understanding of the impacts of CCBF funding.
Methodology
This evaluation reviewed program documents, conducted a literature review, analyzed program data and external data, conducted key informant interviews, and issued a survey to signatories and ultimate recipients. A detailed methodology can be found in Annex C.
Evaluation Questions
Questions for the CCBF evaluation were targeted to consider previous reviews and evaluations conducted since 2015, while ensuring the evaluation still covered core issues around effectiveness and GBA+.
- Is the collaborative approach with CCBF signatories, and associated roles and responsibilities, effective in improving performance measurement? (Key Finding #1/ Key Finding #3)
- To what extent is the design and implementation of CCBF outcomes reporting & AERs efficient & effective? (Key Finding #2/ Key Finding #4)
- To what extent can CCBF outcomes be integrated into IICP horizontal reporting requirements? (Key Finding #4)
- To what extent have the CCBF infrastructure investments aligned with infrastructure needs and priorities across Canada? (Key Finding #5/ Key Finding #6)
- To what extent has CCBF made progress towards its intended outcomes? (Key Finding #7/ Key Finding #8)
- To what extent is CCBF an appropriate mechanism for the provision of improved asset management practices? (Key Finding #9)
- To what extent is CCBF benefitting diverse populations equitably, in current situation and for the future? (Key Finding #10/ Key Finding #11)
3.0 Findings, Conclusions and Recommendations
Conclusion #1: Collaborative efforts on performance measurement and reporting have been helpful.
CCBF reporting consistency and quality appears to be improving since the 2015 Evaluation (Key Finding #4); both signatories and ultimate recipients indicated that their roles and responsibilities with respect to reporting were mostly clear (Key Finding #2). Signatories noted that federal support has been important to improve performance measurement (Key Finding #1). Challenges with consistency for reporting and performance measurement remain and impede the ability to support national level reporting and progress monitoring over time. Addressing this issue will require recognition of the desired flexibility of CCBF, while also encouraging data consistency that can demonstrate progress towards results. An important consideration should be reporting burden, especially for smaller communities.
Signatories are generally aware of key resources provided by INFC (Key Finding #3). With respect to reporting, interviewees and survey respondents emphasized the importance of the regular utilization of the Federal/Provincial/Territorial (FPT) working group, the regular updating and distribution of instructional resources, and the continued clarification of roles and responsibilities at all levels of CCBF governance.
Recommendation #1: It is recommended that INFC ensure that resources are made available and kept up to date in support of both signatories and ultimate recipients. These resources could include clear and consistent reporting guidelines established and communicated in advance of a reporting cycle; a regularly updated list of key contacts within INFC and at the signatory level and with participating CCBF ultimate recipients; key roles & responsibilities for all parties; documents/tools that provide information on eligibility.
Recommendation #2: In future negotiations, it is recommended that INFC strengthen the reporting framework and requirements to move towards the establishment and use of common indicators for outcomes reporting. These indicators should be clearly aligned with the desired outcomes and objectives of CCBF, as well as INFC. It would be worth examining the indicators already in place for other programs to determine if they can be applied towards CCBF.
Conclusion #2: The predictable funding and flexibility of CCBF allows signatories and ultimate recipients to direct funds towards their highest priorities as needed, while supporting long term national objectives of productivity and economic growth, clean environment, and strong cities and communities.
CCBF has contributed to outcome a) providing municipalities with access to a predictable source of funding, and outcome b) investing in community infrastructure (Key Finding #5). Signatories and ultimate recipients allocate CCBF funding to their highest priorities, which signatories and ultimate recipients indicated are expected to remain fairly consistent over the next five years (Key Finding #6).
CCBF spending contributes to the National Objectives of productivity and economic growth, clean environment, and strong cities and communities (Key Finding #8). While projects often hold relevancy to multiple national objectives, expenditure in productivity and economic growth prevail significantly over expenditure in project categories supporting clean environment and strong cities and communities. This is noted through increased infrastructure service levels, increased asset net value, capital renewal and replacement needs being addressed, increased public safety, as well as improved urban mobility, job creation and contribution to the GDP.
Conclusion #3: CCBF is an important source of capacity building and asset management support.
CCBF has contributed to outcome c) supporting and encouraging long-term municipal planning and asset management practices (Key Finding #7 / Key Finding #9). Evidence indicates that 72% of ultimate recipients who responded to the survey have asset management plans and that available funding through CCBF is used to support asset management practices as needed.
Conclusion #4: There is interest in exploring how CCBF can be more inclusive. Further research is needed to determine the impact of CCBF on diverse populations and community sizes to determine if there are barriers to community benefit.
At the federal and provincial and territorial levels, the context has evolved since the last agreements. This includes new federal requirements to consider GBA+ in program design, implementation and evaluation, as well as the evolving needs and changing social context of Canadians with a focus on addressing inequities (i.e., reduce gaps between urban and rural areas) and governments commitments towards United Nations Sustainable Development Goals. It is possible further research would identify whether CCBF could play a larger role in supporting these priorities.
Signatories and ultimate recipients have expressed an interest in exploring how CCBF can better address the diverse needs of Canadians (Key Finding #10). Evidence from literature indicates that actions to address inclusivity need to be purposeful and built into program design. However, this could impact the flexibility for which CCBF is appreciated. Further consultation would be required in order to explore options for future agreements.
There is an opportunity to review equity considerations with respect to funding for smaller and remote communities in the provinces. Reported expenditure indicates that a lesser proportion of small and remote communities are spending CCBF funds annually and are likely opting to bank over multiple years to fund projects instead, based on their allocation. Meanwhile, despite experiencing similar infrastructure challenges, remote communities in the territories are often able to spend more CCBF funding per capita than their remote provincial counterparts (Key Finding #11).
Recommendation #3: To better align to evolving inclusiveness priorities, it is recommended that INFC conduct a GBA+ analysis for the upcoming renewal of CCBF. This could include exploring the specific needs and geographic contexts of small/rural/remote and Northern communities, as well as how these communities, Indigenous persons and persons with disabilities are impacted by the CCBF.
Annex A: Detailed Findings
Design and Delivery
Key finding #1: Collaboration on performance measurement between INFC, signatories, and ultimate recipients is well received and helpful. Signatories considered CCBF Annual Workshops and FPT Outcomes Working Groups more useful than Oversight Committee Meetings.
Table A-1. Collaboration mechanisms:
| CCBF Annual Workshops | FPT Outcomes Working Group | Oversight Committee Meetings |
|---|---|---|
Interviewees indicated that CCBF workshops have done well to improve performance measurement by building uniform indicators for workshop participants to employ in their performance reporting. 53% of signatories reported that the CCBF workshops supported their work on outcomes reporting. Interviewees note that due to the voluntary design of the workshops, results of any discussions on performance measurement may only be implemented by those who attended the sessions where they were developed. |
The working group was established in 2019 to discuss performance outcomes and measures. Program documents show that some groundwork was done by the working group but progress towards the development of consistent indicators is still outstanding. The working group paused in August 2020 and began meeting again in November 2021. 52% of signatories and some interviewees reported that the working group supported work on outcomes reporting. |
Each province and territory has their own oversight committee with INFC which they co-chair. These committees are responsible for reviewing asset management as well as performance measurement methodology, among other activities necessary for the implementation of the agreements. Program documents indicate that the Oversight Committee has sometimes tackled issues of performance measurement. The CCBF Oversight Committee has seen varied levels of effectiveness over the course of CCBF's operation and was identified to be the least useful mechanism in supporting performance measurement initiatives. 37% of signatories felt that the OC supported their work on outcomes reporting. Program documents show that certain provinces and territories are meeting more frequently and are discussing performance measurement more regularly than others. |
Perspectives on collaboration between signatories and INFC
- With respect to collaboration with INFC, 64% felt that discussions on performance measures have been helpful. INFC used three main mechanisms (CCBF Workshops, the FPT Outcomes Working Group, and the Oversight Committee) to facilitate collaboration with signatories on performance measurement between 2014-15 and 2018-2019.
- Evidence suggests that while these mechanisms are generally effective to support ongoing collaborative efforts, room for improvement exists. Timeliness and consistency of CCBF collaboration mechanisms were mentioned by signatories as areas needing improvement, with only 26% indicating that information given by INFC was consistent or timely. With respect to consistency on the part of INFC, interview participants highlighted that these collaborative mechanisms could be better used, including ensuring that those mechanisms are reviewing topics relevant to CCBF performance measurement.
- Interview participants also noted that performance measurement has improved since CCBF's last evaluation and attribute some of that improvement to the collaborative nature of the program. 42% of signatories agreed with the statement that the performance measurement has been more collaborative under the 2014-24 agreement.
- Signatories (63%) also stated that jurisdictional needs are generally being met and 42% noted that discussion and engagement forums with INFC have positively impacted their jurisdiction's ability to collect data meaningful for measuring outcomes.
- Interviewees noted that when CCBF collaboration mechanisms are operating as intended and at regular intervals, performance measurement has reportedly improved and CCBF has seen increased levels of 'buy-in' from ultimate recipients.
Collaboration with ultimate recipients
- With respect to reporting, ultimate recipients typically interacted with their province or territorial government (27%), followed by INFC (19%), municipal associations (14%) and provincial/territorial associations (2%). 37% of ultimate recipients noted other key points of contact. Ultimate recipients indicated these interactions were mostly positive.
- Literature identifies that collaboration, effective communication and aligning values are important when diverse actors are developing common tools or approaches, including data practices.
- One in five ultimate recipients indicated that they did not know of, or did not have, a key point of contact related to performance measurement.
- Frequency of communication varied, with annual as the most common response.
- The frequency of communication was not a significant determinant of satisfaction with these interactions.
74% of signatories noted that engagement with ultimate recipients has supported their work on reporting outcomes
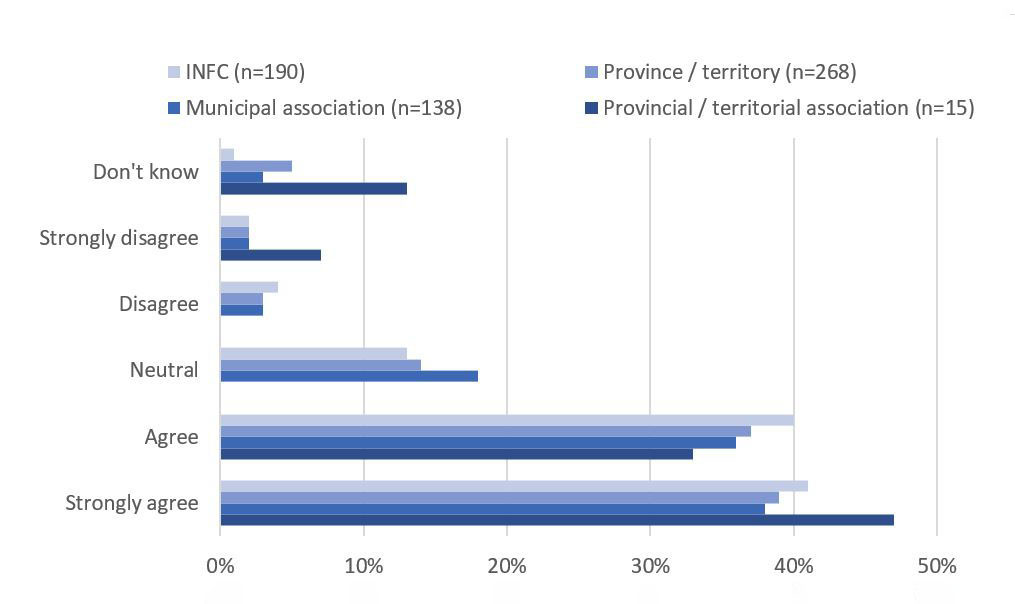
Figure A-1. Ultimate recipient responses: Information on performance measurement from the following points of contact is consistent in terms of data, indicators, and outcomes information.
Text description of Figure A-1
This figure shows the percentage of signatories who responded “don’t know”, “strongly disagree”, “disagree”, “neutral”, “agree”, and “strongly agree” for the following statement: “Information on performance measurement from the following points of contact is consistent in terms of data, indicators, and outcomes information” for each point of contact:
Point of contact 1) INFC - 41% strongly agree; 40% agree; 13% neutral; 4% disagree; 2% strongly disagree; 1% don’t know.
Point of contact 2) Municipal Association – 38% strongly agree; 36% agree; 18% neutral; 3% disagree; 2% strongly disagree; 3% don’t know.
Point of contact 3) Province/Territory – 39% strongly agree; 37% agree; 14% neutral; 3% disagree; 2% strongly disagree; 5% don’t know.
Point of contact 4) Provincial/Territorial Association - 47% strongly agree; 33% agree; 0% neutral; 0% disagree; 7% strongly disagree; 13% don’t know.
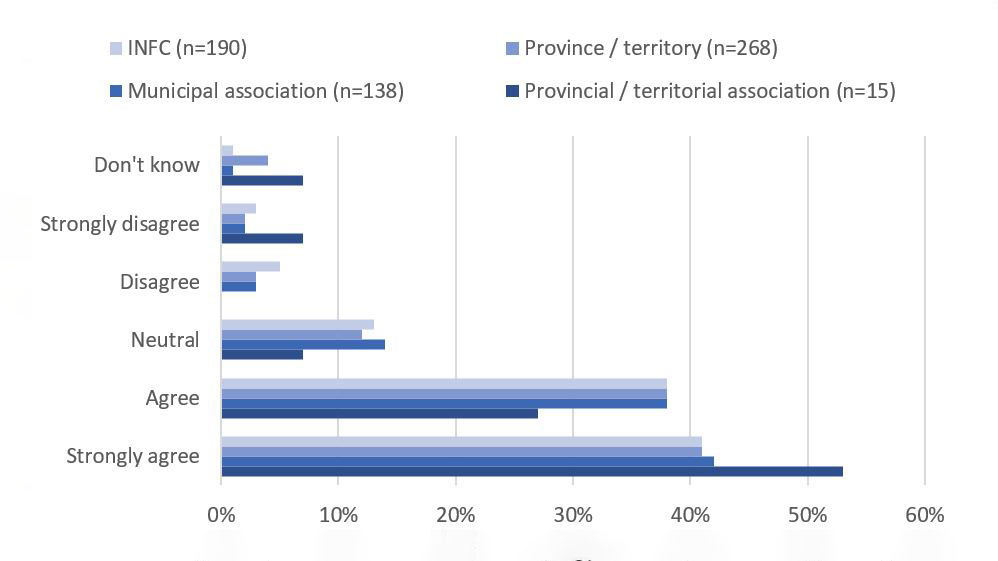
Figure A-2. Ultimate recipient responses: Communication (email, phone, discussions) with the following points of contact regarding performance measurement was effective over the past five years.
Text description of Figure A-2
This figure shows the percentage of signatories who responded “don’t know”, “strongly disagree”, “disagree”, “neutral”, “agree”, and “strongly agree” for the following statement: “Communication (email, phone, discussions) with the following points of contact regarding performance measurement was effective over the past five years ” for each point of contact:
Point of contact 1) INFC - 41% strongly agree; 38% agree; 13% neutral; 5% disagree; 3% strongly disagree; 1% don’t know.
Point of contact 2) Municipal Association – 42% strongly agree; 38% agree; 14% neutral; 3% disagree; 2% strongly disagree; 1% don’t know.
Point of contact 3) Province/Territory – 41% strongly agree; 38% agree; 12% neutral; 3% disagree; 2% strongly disagree; 4% don’t know.
Point of contact 4) Provincial/Territorial Association - 53% strongly agree; 27% agree; 7% neutral; 0% disagree; 7% strongly disagree; 7% don’t know.
Figure A-3. Ultimate recipient responses: Discussions on performance measures with the following points of contact have been helpful.
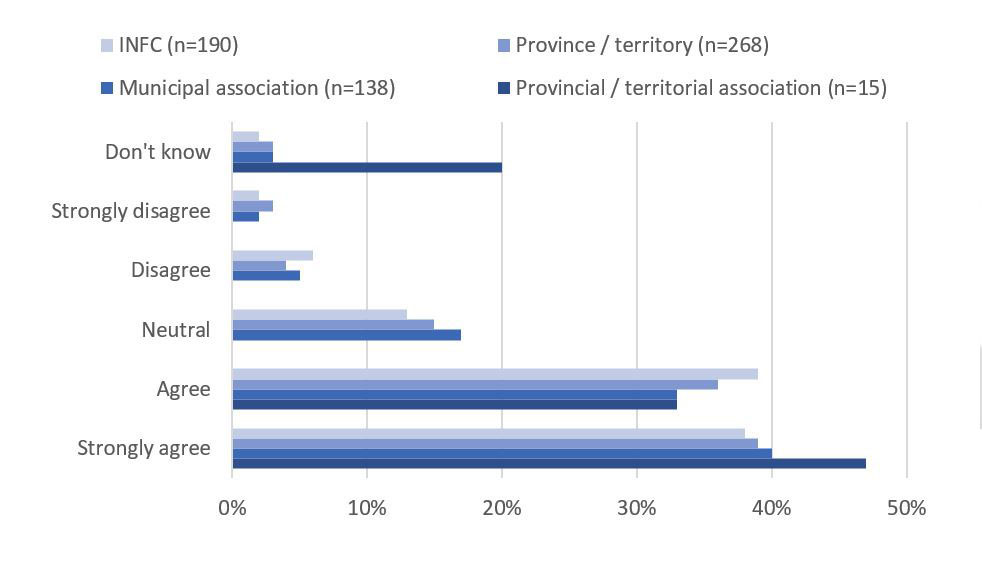
Text description of Figure A-3
This figure shows the percentage of signatories who responded “don’t know”, “strongly disagree”, “disagree”, “neutral”, “agree”, and “strongly agree” for the following statement: “Discussions on performance measures with the following points of contact have been helpful” for each point of contact:
Point of contact 1) INFC - 38% strongly agree; 39% agree; 13% neutral; 6% disagree; 2% strongly disagree; 2% don’t know.
Point of contact 2) Municipal Association – 40% strongly agree; 33% agree; 17% neutral; 5% disagree; 2% strongly disagree; 3% don’t know.
Point of contact 3) Province/Territory – 39% strongly agree; 36% agree; 15% neutral; 4% disagree; 3% strongly disagree; 3% don’t know.
Point of contact 4) Provincial/Territorial Association - 40% strongly agree; 33% agree; 17% neutral; 5% disagree; 2% strongly disagree; 3% don’t know.
Key finding #2: Signatories and ultimate recipients indicated that their roles and responsibilities with respect to reporting were mostly clear.
- The overarching roles and responsibilities for INFC and signatories are clearly set out in the CCBF Agreements and Terms of Reference for the Oversight Committee for each province and territory.
- Signatories are generally more aware of the roles and responsibilities of all parties compared to ultimate recipients, who were more likely to suggest that they did not know if roles and responsibilities were clear.
- With respect to reporting requirements, signatories generally agreed (78%) that their roles and responsibilities are clear. 78% of ultimate recipients also stated their specific roles and responsibilities are clear.
- In comparison, a larger percentage (90%) of signatories felt that the roles and responsibilities for ultimate recipients with respect to reporting were clear.
- This reflects the structure of the program, as program documents show that the bilateral agreements exist between INFC and signatories at the provincial/territorial level. Signatories are then responsible for the relationship with ultimate recipients. For that reason, roles and responsibilities of ultimate recipients were not detailed in INFC documentation.
- Signatories indicated that INFC’s roles and responsibilities with respect to reporting were the least clear.
- As there is no direct link between CCBF ultimate recipients and INFC, the clarity of INFC’s roles and responsibilities from the ultimate recipient perspective is not relevant
Figure A-4. CCBF signatory awareness of roles and responsibilities.
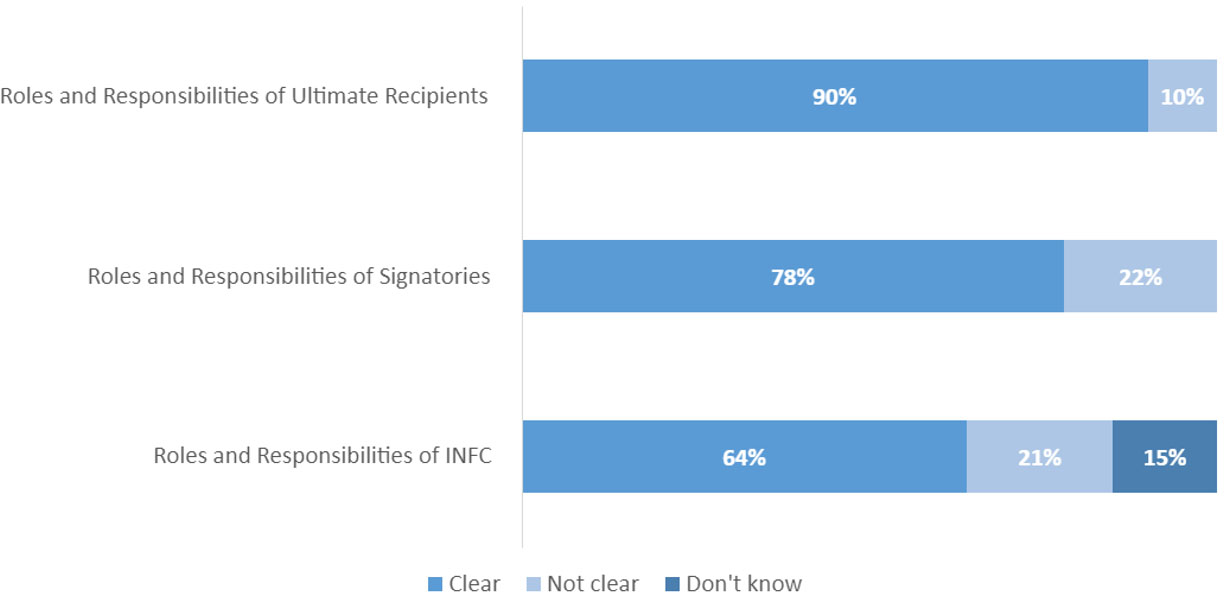
Text description of Figure A-4
This figure shows the percentage of signatories who responded “clear”, “not clear”, and “don’t know” to the clarity of the roles of and responsibilities for the following:
Roles and responsibilities of ultimate recipients: clear 90% ; not clear 10% ; don’t know 0%
Roles and responsibilities of signatories: clear 78% ; not clear 22% ; don’t know 0%
Roles and responsibilities of INFC: clear 64% ; not clear 21% ; don’t know 15%
Figure A-5. CCBF ultimate recipient awareness of roles and responsibilities.
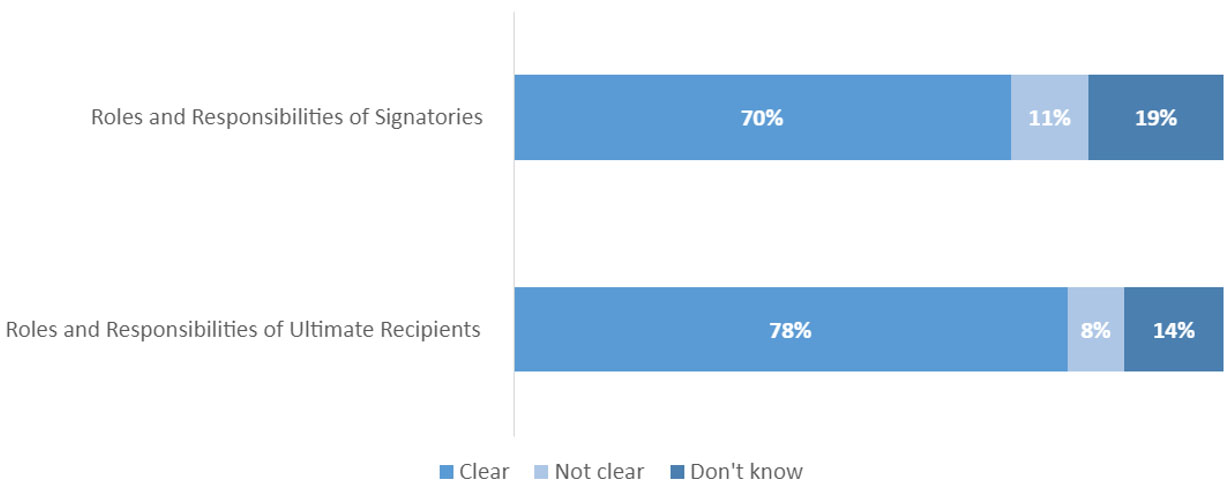
Text description of Figure A-5
This figure shows the percentage of ultimate recipients who responded “clear”, “not clear”, and “don’t know” to the clarity of the roles of and responsibilities for the following:
Roles and responsibilities of signatories: clear 70% ; not clear 11% ; don’t know 19%
Roles and responsibilities of ultimate recipients: clear 78% ; not clear 8% ; don’t know 14%
Key Finding #3: Signatories are generally aware of key resources provided by INFC. At the same time, accessibility and usefulness could be improved.
With the exception of the asset management guidelines, most signatories indicated they are aware of the resources available to them.
Figure A-6. Awareness of guidelines and tools.
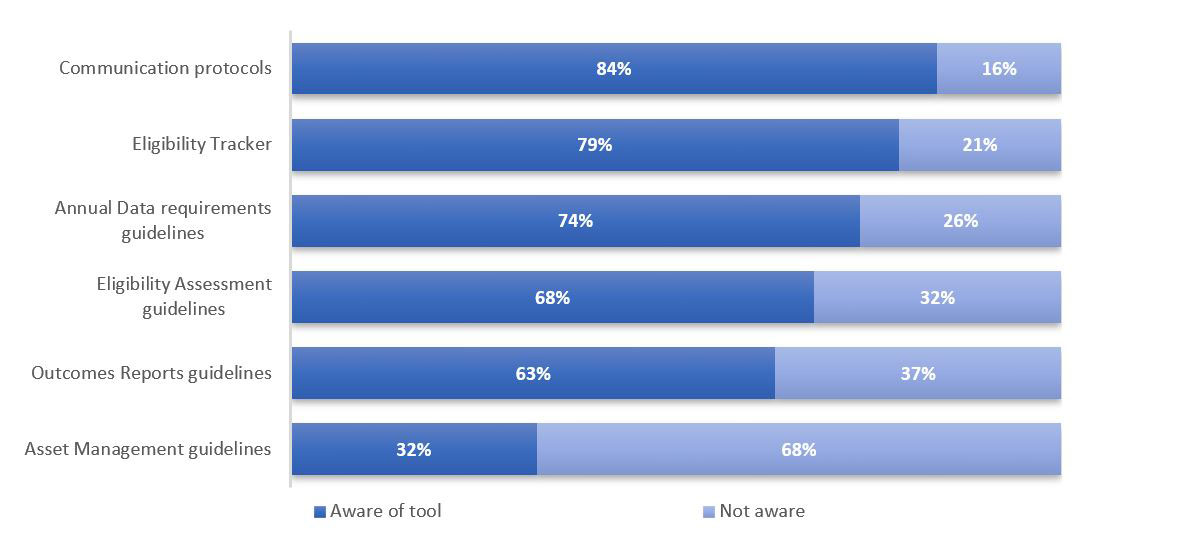
Text description of Figure A-6
This figure shows the following guidelines and tools and the percentage of signatories that were “aware of the tool” and those that were “not aware”:
Communication protocols – 84% aware ; 16% not aware
Eligibility Tracker – 79% aware ; 21% not aware
Annual Data requirements guidelines – 74% aware ; 26% not aware
Eligibility Assessment guidelines – 68% aware ; 32% not aware
Outcomes reports guidelines – 63% aware ; 37% not aware
Asset Management guidelines – 32% aware ; 68% not aware
Some guidelines and protocols for communications, reporting, and eligibility are available in the agreements signed by signatories, which are also publicly available on the INFC website.
Other guidance and tools are typically shared through annual CCBF Workshops or directly between INFC staff and their signatory counterparts as needed or requested.
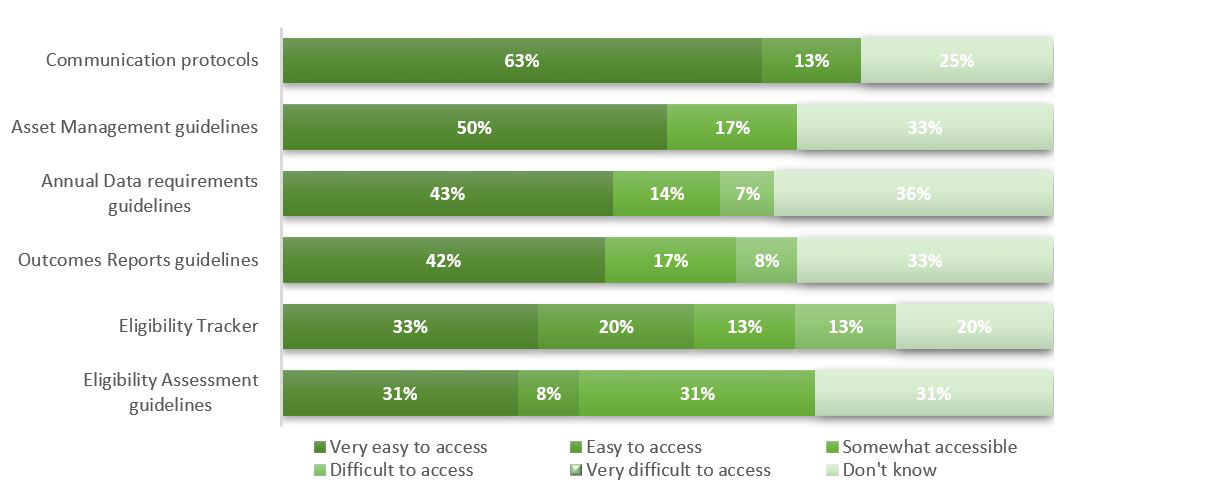
Figure A-7. Access to guidelines and tools.
Text description of Figure A-7
This figure shows the following guidelines and tools and their accessibility according to signatories, with percentages indicating the percentage of signatories with that response.
Asset Management guidelines – 63% very easy to access ; 13% easy to access ; 25% don’t know
Annual Data requirements guidelines – 50% very easy to access ; 17% somewhat accessible ; 33% don’t know
Outcomes reports guidelines – 43% very easy to access ; 14% somewhat accessible ; 7% difficult to access ; 36% don’t know
Eligibility Tracker – 33% very easy to access ; 20% easy to access ; 13% somewhat accessible ; 13% difficult to access ; 20% don’t know
Eligibility Assessment guidelines – 31% very easy to access ; 8% easy to access ; 31% somewhat accessible ; 31% don’t know
Of those that were aware of the resources, respondents indicated they were mostly easy to access, with the communications protocols and eligibility tracker being the most accessible.
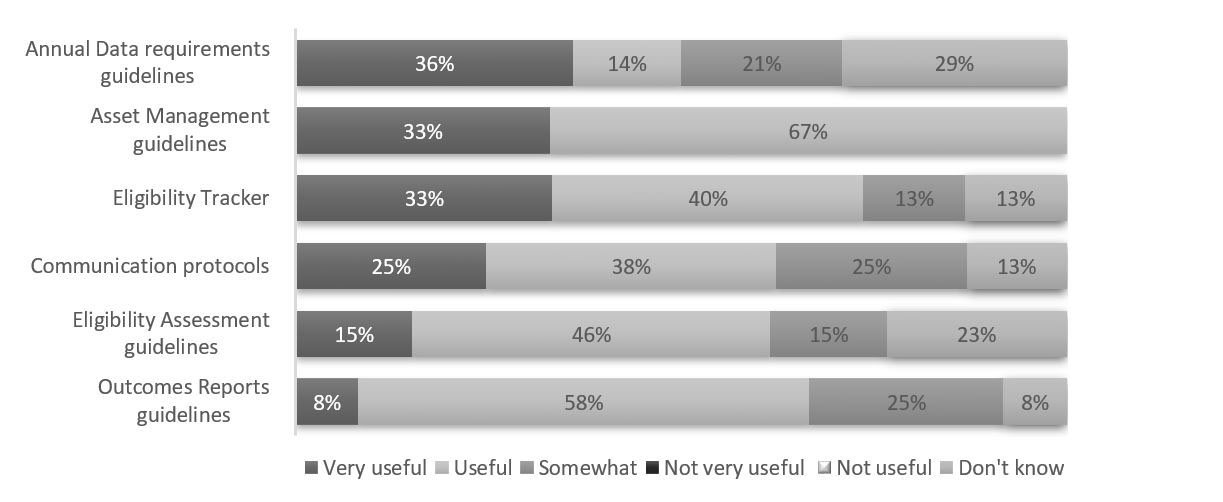
Figure A-8. Usefulness of guidelines and tools.
Text description of Figure A-8
This figure shows the following guidelines and tools and their usefulness according to signatories, with percentages indicating the percentage of signatories with that response.
Annual data requirements guidelines – 36% very useful ; 14% useful ; 21% somewhat ; 29% don’t know
Asset Management guidelines – 33% very useful ; 67% useful
Eligibility Tracker – 33% very useful ; 40% useful ; 13% somewhat ; 13% don’t know
Communication protocols – 25% very useful ; 38% useful ; 25% somewhat ; 13% don’t know
Eligibility Assessment guidelines – 15% very useful ; 46% useful ; 15% somewhat ; 23% don’t know
Outcomes Reports guidelines – 8% very useful ; 58% useful ; 25% somewhat ; 8% don’t know
Those that did access and use the resources indicated that they are generally helpful. The asset management guidelines were rated as the most useful but were also the least used due to low levels of awareness of this resource.
Some signatories suggested that CCBF resources should be regularly updated, consolidated, and redistributed to guarantee their usage and effectiveness.
Key finding #4: CCBF reporting has improved relative to the previous 2015 CCBF evaluation. Data reliability, consistency, and uniformity remain central issues.
Outcomes Reports and Annual Expenditure Reports
Overall, program documents indicate that CCBF has seen improved reporting practices from 2014 to 2019 for both Outcomes Reports and AERs. Survey respondents generally agreed that CCBF reporting practices are efficient and effective. Challenges with respect to reporting and performance measurement consistency remain and impede the ability to support national level reporting.
Survey respondents and interviewees highlighted the importance of ensuring that all stakeholders understand what INFC is seeking to obtain from Outcomes Reports and AERs so that relevant indicators can be developed, implemented, and and provide useful information. Increased clarity would contribute to improving data quality, reliability, and consistency. This includes the timely communication of changes for reporting practices in order to ensure adequate time for signatories and ultimate recipients to adapt to new reporting requirements, as well as consideration for investments made by provinces and territories with respect to their tracking systems for performance reporting.
It was also noted that the flexibility of CCBF is important and there needs to be a balance between consistency in reporting requirements and administrative burden, including considerations for reporting requirements that are in line with the scale of the project.
Table A-2. Perspectives on annual expenditure reviews and outcomes reports.
| Annual Expenditure Reviews | Outcomes Reports |
|---|---|
|
|
Literature highlights that a particular challenge for many small/rural/Northern communities is their reporting capacity due to limited human resource and data collection capacity and expertise, as well as reporting burdens. Survey respondents and interviewees suggested that this needs to be considered when developing reporting standards. One proposed consideration was to allow data collection and reporting expenses as eligible expenses under CCBF funding when need can be demonstrated. Others noted that reporting transparency needs to be improved and requirements should be easier to follow. Ultimate recipients expressed that if reporting burden is increased, they would want to understand how those requirements support the CCBF and benefit Canadians.
CCBF does not fully integrate into IICP reporting
When the IICP was announced in 2016, pre-existing infrastructure programs became legacy programs under the IICP umbrella. Reporting requirements for legacy programs were established prior to the development of the IICP and preserved when IICP was put in place. Since they represent considerable ongoing infrastructure spending, they were included as is and integrated into horizontal reporting for IICP to the extent possible. As a legacy program, the CCBF’s reporting framework remained unchanged when the plan was approved. Due to existing bilateral agreements, delays in project funding would be caused if these were renegotiated. CCBF top-up funding provided since 2016 is not considered to be part of IICP.
Although CCBF predated IICP, the CCBF long-term objectives and final outcomes are similar to those of IICP. Program documents show that CCBF eligible asset categories, including but not limited to public transit, wastewater, solid waste, community energy systems, amongst others, generally align with the four IICP priority investment streams: public transit; green infrastructure; community, culture, and recreation; and rural and northern community infrastructure.
Since the scoping of this evaluation, the 2021 Reports of the Auditor General of Canada to the Parliament of Canada: Report 9—Investing in Canada Plan identified that INFC legacy programs did not report against IICP’s expected results, indicators, and targets. The recommendation made to INFC based on this report was to work collaboratively with federal partner organizations to determine which legacy programs are meant to contribute to the plan’s objectives and how to report on them.
Aspects of CCBF currently integrated into IICP reporting include the number of completed infrastructure projects under CCBF and CCBF expenditures to date (excluding non-IICP top ups). INFC has been exploring additional ways in which legacy programs can better contribute to national reporting under IICP.
Relevance
Key finding #5: CCBF’s flexible funding model has supported signatories and ultimate recipients in meeting their local needs and priorities.
- Survey respondents were asked to identify infrastructure priorities holistically, not exclusively within a CCBF context. An indication of high priority does not necessarily correlate with increased CCBF expenditure.
- While the survey did gauge current priority level across CCBF categories, it did not inquire as to why priority levels increased or decreased.
- Asset categories were ranked independently of one another, and prioritization of any given category should not be considered relative to other priority levels.
- CCBF asset categories ranked most frequently as a high priority through the signatory and ultimate recipient surveys have received the largest portions of CCBF expenditures; these categories include local roads and bridges, drinking water, wastewater, and recreation.
- Refer to the table Table A-3 and Figure A-9 below. Note the top four expenditure categories (identified by program data) align with the top four asset categories indicated to be a high priority as identified by survey responses. CCBF funding is generally being spent in accordance with signatory and ultimate recipient self-identified needs and priorities.
- Differences between spending and priority rating can be explained by:
- The existence of other infrastructure funding mechanisms (i.e., Universal Broadband Fund, Municipal Asset Management Program (MAMP) delivered via Federation of Canadian Municipalities (FCM)) targeting various asset categories.
- The need to prioritize critical infrastructure areas.
- While signatories and ultimate recipients identified the same asset categories to be of high priority, signatories indicated a higher priority level across almost all CCBF categories more frequently than ultimate recipients. The evaluation did not explore why this variability exists.
- Local and regional airports, short-line rail, and short-sea shipping were ranked as a high priority more often by ultimate recipients than signatories.
- Ultimate recipient spending of CCBF funds across eligible asset categories is consistent with expenditure trends in other comparable public infrastructure programs.
This analysis was based on the data presented in table A-3 and figure A-9 below.
Table A-3. Proportion of CCBF funding spent per standardized project category.
| Standardized CategoryFootnote2 | % of Funding Spent per Category |
|---|---|
| Highways and Roads | 46.72% |
| Public Transit | 28.55% |
| Drinking Water & Wastewater | 13.36% |
| Recreation | 3.23% |
| Solid Waste Management | 3.13% |
| Green Energy | 2.20% |
| Capacity Building | 1.19% |
| Sport | 0.48% |
| Culture | 0.35% |
| Disaster Mitigation | 0.21% |
| Tourism | 0.19% |
| Regional and Local Airports | 0.17% |
| Brownfield Remediation and Redevelopment | 0.10% |
| Broadband and Connectivity | 0.07% |
| OtherFootnote3 | 0.04% |
*CCBF expenditures are reported using standardized categories to allow for comparability with Infrastructure Economic Accounts (INFEA) data
*’Other’ includes projects that did not align with standardized categories
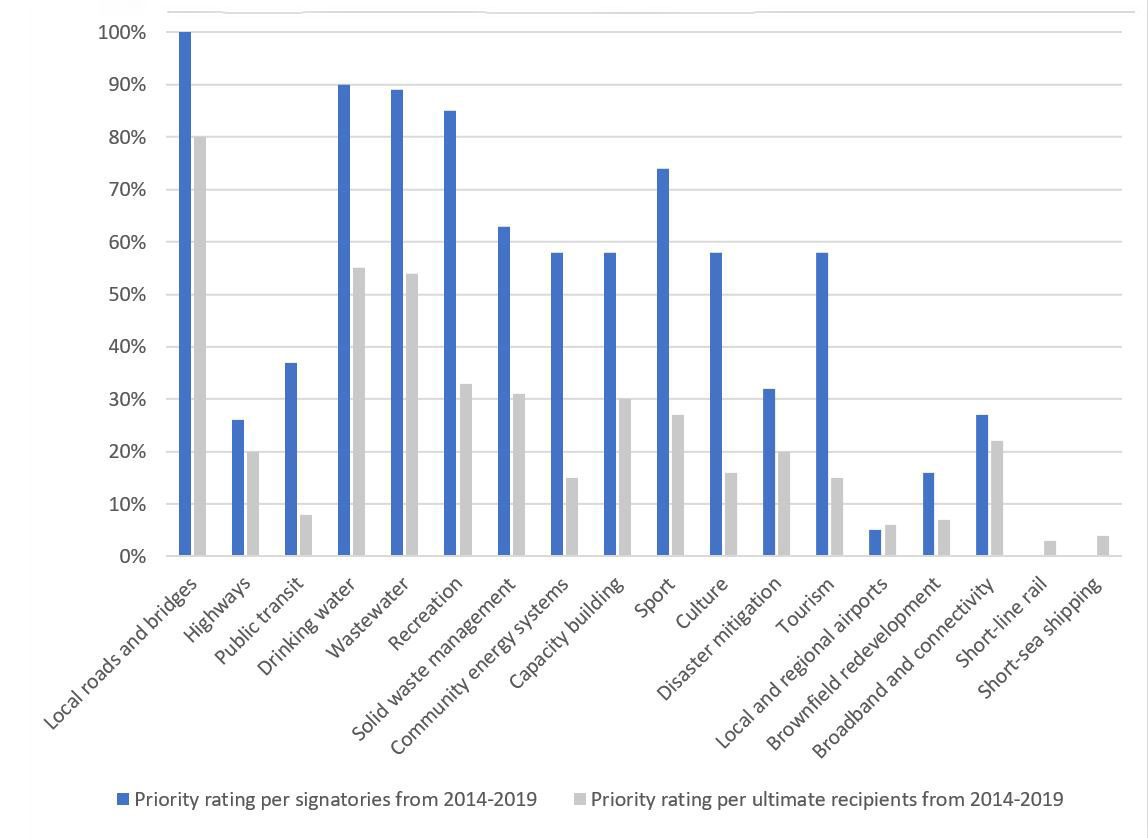
Figure A-9. 2014-2019 priority rating (high or very high) of CCBF categories based on a survey of signatories and ultimate recipients.
Text description of Figure A-9
2014-2019 priority rating (high or very high) of CCBF categories based on a survey of signatories and ultimate recipients
This figure shows the percentage of signatories and the percentage of ultimate recipients who rated “high” or “very high” for the following CCBF categories in a priority rating from 2014-2019:
Local roads and bridges – signatories 100% ; ultimate recipients 80%
Highways – signatories 26%; ultimate recipients 20%
Public transit – signatories 37%; ultimate recipients 8%
Drinking water – signatories 90% ; ultimate recipients 55%
Wastewater – signatories 89%; ultimate recipients 54%
Recreation – signatories 85% ; ultimate recipients 33%
Solid waste management – signatories 63%; ultimate recipients 31%
Community energy systems – signatories 58%; ultimate recipients 15%
Capacity building – signatories 58%; ultimate recipients 30%
Sport – signatories 74%; ultimate recipients 27%
Culture – signatories 58%; ultimate recipients 16%
Disaster management – signatories 32% ; ultimate recipients 20%
Tourism – signatories 58% ; ultimate recipients 15%
Local and regional airports – signatories 5% ; ultimate recipients 6%
Brownfield remediation – signatories 16% ; ultimate recipients 7%
Broadband and connectivity – signatories 27% ; ultimate recipients 22%
Short-line rail – signatories 0% ; ultimate recipients 3%
Short-sea shipping – signatories 0% ; ultimate recipients 4%
Key finding #6: Infrastructure needs and priorities are generally expected to remain consistent for the next five years.
Top priorities
Ultimate recipients and signatories prioritized the same top four asset categories as both past and future priorities: local roads and bridges, drinking water, wastewater, and recreation.
Table A-4. Changes in priority.
| Changes in priority identified by ultimate recipients | Changes in priority identified by signatories |
|---|---|
|
|
Asset categories that remained of similar priority for ultimate recipients but saw notable increases in priority by program signatories include highways, community energy systems, public transit, tourism, and disaster mitigation.
Using INFEA data to predict future infrastructure needs
The Infrastructure Economic Account (INFEA) is a set of statistical products that quantify the role and impact of infrastructure on Canadians.
Analysis of INFEA data, specifically comparing national investment and depreciation per asset category, can anticipate evolving infrastructure needs across Canada.
While considering that a multitude of variables can impact funding opportunities for any given asset category, based on current national investment and depreciation trends, important funding opportunities for drinking water, wastewater, and stormwater exist relative to other asset categories.
More on INFEA
INFEA provides data that quantifies the economic contribution of the construction of public and private infrastructure in the Canadian economy. It measures the impact of infrastructure investment on the economy, environment and society to provide comparable national and sub-national infrastructure statistics.
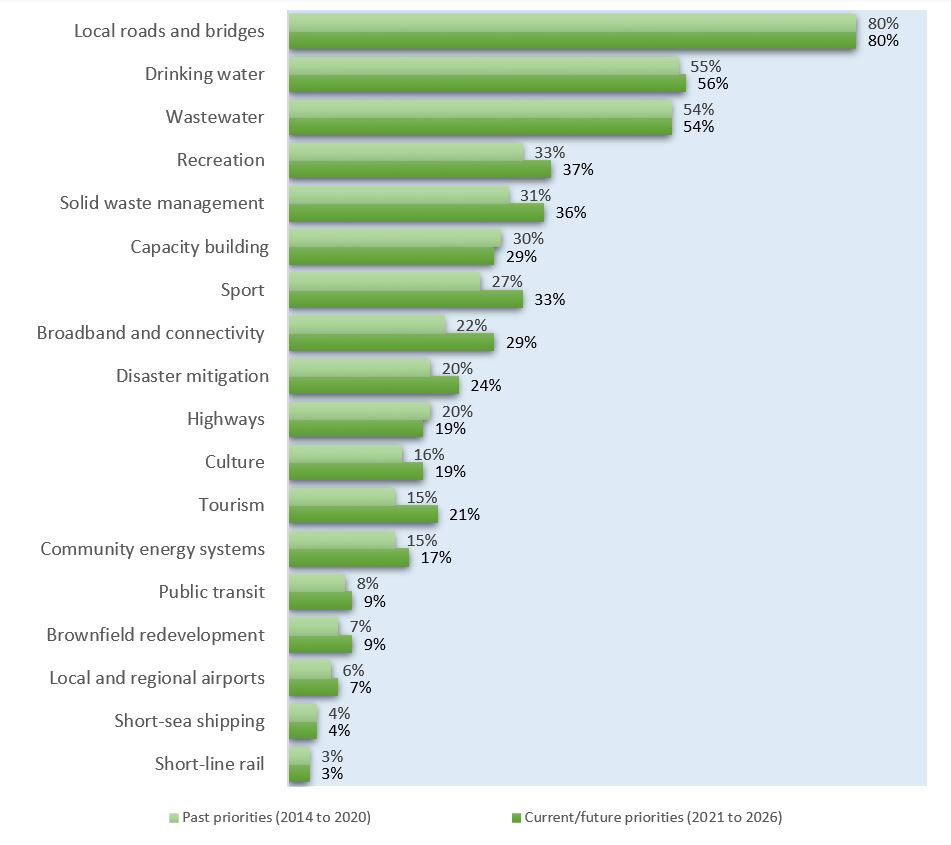
Figure A-10. Past and future CCBF infrastructure priorities as identified by a survey of ultimate recipients.
Very important and important (n=923).
Text description of Figure A-10
Past and future CCBF infrastructure priorities as identified by a survey of ultimate recipients
Very important and important (n=923)
This figure shows the percentage of ultimate recipients who rated the following CCBF categories as “very important” or “important” in a priority rating, as a past priority (2014 to 2020) and as a current/ future priority (2021 to 2026):
Local roads and bridges – past 80% ; current/future 80%
Drinking water – past 55% ; current/future 56%
Wastewater – past 54% ; current/future 54%
Recreation – past 33% ; current/future 37%
Solid waste management – past 31% ; current/future 36%
Capacity building – past 30% ; current/future 29%
Sport – past 27% ; current/future 33%
Broadband and connectivity – past 22% ; current/future 29%
Disaster mitigation – past 20% ; current/future 24%
Highways – past 20% ; current/future 19%
Culture – past 16% ; current/future 19%
Tourism – past 15% ; current/future 21%
Community energy systems - past 15% ; current/future 17%
Public transit – past 8% ; current/future 9%
Brownfield redevelopment – past 7% ; current/future 9%
Local and regional airports – past 6% ; current/future 7%
Short-sea shipping – past 4% ; current/future 4%
Short-line rail – past 3% ; current/future 3%
Figure A-11. Past and future CCBF infrastructure priorities as identified by a survey of signatories.
Very important and important (n=19).
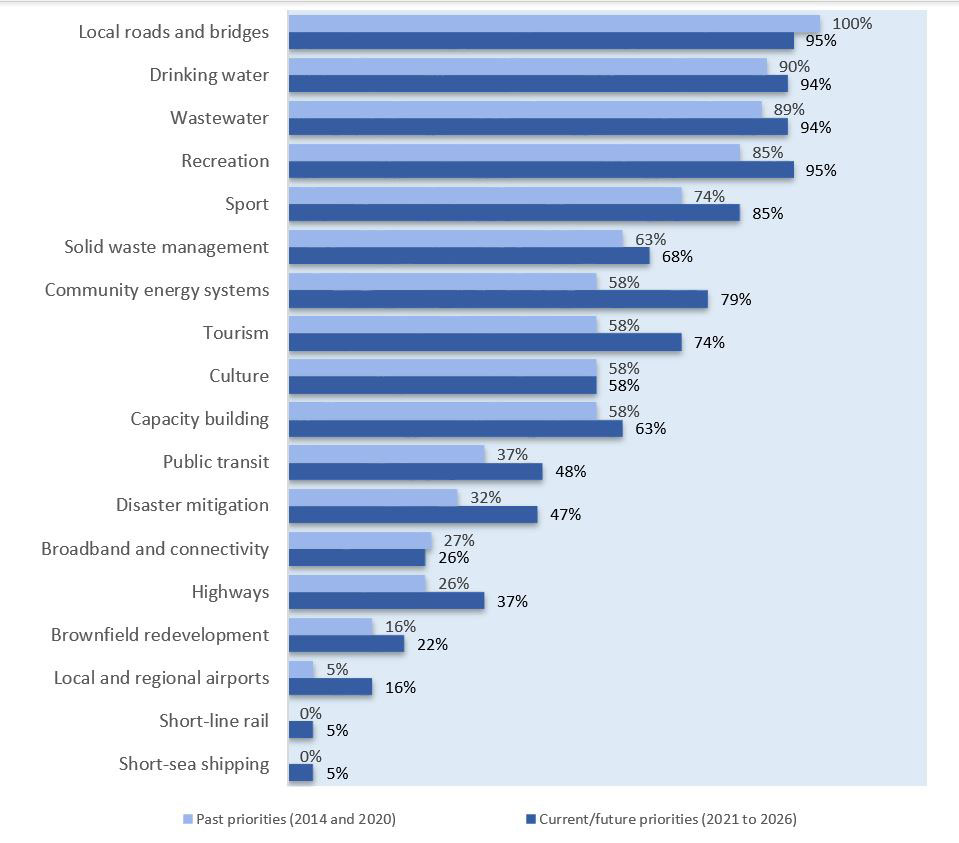
Text description of Figure A-11
Past and future CCBF infrastructure priorities as identified by a survey of signatories
Very important and important (n=19)
This figure shows the percentage of signatories that rated the following CCBF categories as “very important” or “important” in a priority rating, as a past priority (2014 to 2020) and as a current/ future priority (2021 to 2026):
Local roads and bridges – past 100% ; current/future 95%
Drinking water – past 90% ; current/future 94%
Wastewater – past 89% ; current/future 94%
Recreation – past 85% ; current/future 95%
Sport – past 74% ; current/future 85%
Solid waste management – past 63% ; current/future 68%
Community energy systems - past 58% ; current/future 79%
Tourism – past 58% ; current/future 74%
Culture – past 58% ; current/future 58%
Capacity building – past 58% ; current/future 63%
Public transit – past 37% ; current/future 48%
Disaster mitigation – past 32% ; current/future 47%
Broadband and connectivity – past 27% ; current/future 26%
Highways – past 26% ; current/future 37%
Brownfield redevelopment – past 16% ; current/future 22%
Local and regional airports – past 5% ; current/future 16%
Short-line rail – past 0% ; current/future 5%
Short-sea shipping – past 0% ; current/future 5%
Progress toward achievement of outcomes
Key finding #7: CCBF has provided municipalities with access to a predictable source of funding. The current flexibility of CCBF allows ultimate recipients to target spending to local needs and priorities or to bank funding for future infrastructure projects.
CCBF provides a consistent amount of annual funding to program signatories, who in turn provide a consistent amount of funding to ultimate recipients. This provides a predictable source of funding for infrastructure spending.
Communities are also able to bank funding in order to afford future projects.
Most of the funding is spent on immediate infrastructure priorities; however, the flexibility to bank CCBF funding is also being leveraged by ultimate recipients.
The majority of CCBF funds are being spent on projects rather than being banked. Ultimate recipients indicated that the ability to bank and earn interest in support of future projects is an important benefit.
From 2014-15 to 2018-19, ultimate recipients:
- Received $9.8 billion from signatories - approximately $1.8 billion annually.
- Spent $9.3 billion on eligible projects - an average of $1.7 billion on eligible projects each year.
- Were able to carry over and bank unspent CCBF funds.
- Generated $137 million of interest on funds banked.
Figure A-12. Ultimate recipient survey responses on banking CCBF funds.
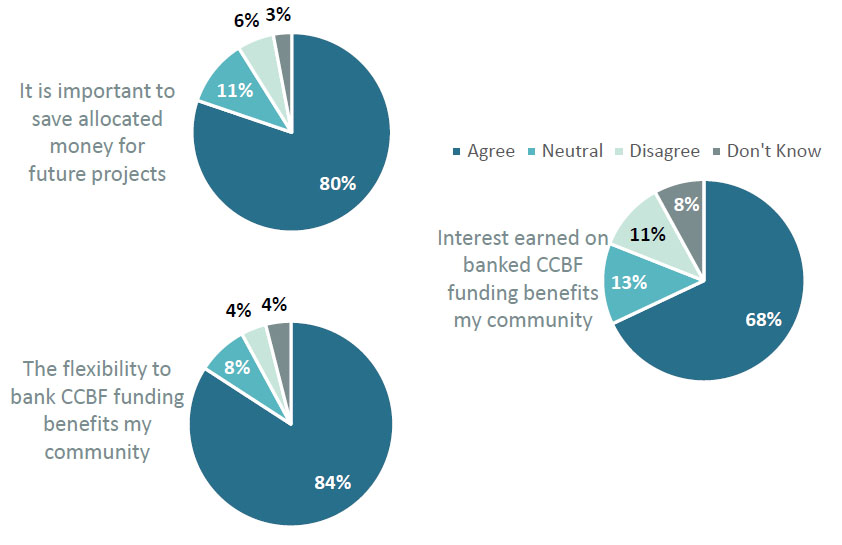
Text description of Figure A-12
Ultimate Recipient survey responses on banking CCBF funds
This figure shows the percentage of ultimate recipients who selected “agree”, “neutral”, “disagree” or “don’t know” for the following statements:
It is important to save allocated money for future projects – 80% agree ; 11% neutral ; 6% disagree ; 3% don’t know
The flexibility to bank CCBF funding benefits my community – 84% agree ; 8% neutral ; 4% disagree ; 4% don’t know
Interest earned on banked CCBF funding benefits my community – 68% agree ; 13% neutral ; 11% disagree ; 8% don’t know
Table A-5. Percentage of Unique Census Subdivisions (CSDs) Banking CCBF Funding.
| Fiscal Year | 2014-15 | 2015-16 | 2016-17 | 2017-18 | 2018-19 | |||||
|---|---|---|---|---|---|---|---|---|---|---|
| Received Allocation | Reported Expenditure | Received Allocation | Reported Expenditure | Received Allocation | Reported Expenditure | Received Allocation | Reported Expenditure | Received Allocation | Reported Expenditure | |
| Number of census subdivisions | 3,630 | 2,955 | 3,566 | 2,982 | 3,563 | 2,996 | 3,562 | 2,996 | 3,560 | 2,986 |
| Percentage of CSDs receiving but not spending CCBF funding | 18.59% | 16.38% | 16.76% | 15.89% | 16.12% | |||||
A further analysis of expenditure and banking of CCBF funds by community size is included in Finding #11 in Inclusivity.
Key finding #8: CCBF funding contributed to community infrastructure projects in support of the program’s long term national objectives of productivity and economic growth, clean environment, and strong cities and communities.
CCBF comprised 3.6% of the total public infrastructure investment in Canada from 2014-15 to 2018-19.
CCBF funding supported the productivity and growth national objective to a greater extent than the clean environment and strong cities and communities’ national objectives. Projects often have relevancy to several national objectives despite only being reported under one. For example, public transit is under the national objective of productivity and economic growth, though program documents, outcomes reports, and comparable infrastructure funding programs highlight the role that public transit infrastructure plays in supporting environmental objectives. The distribution of CCBF funding and projects should not be used to conclude that any given national objective is over- or under-supported.
A survey of ultimate recipients found that overall, CCBF spending has been targeted more towards capital renewal and replacement needs (excluding operations) and increasing the net value of assets (after depreciation).
Figure A-13. CCBF investment ratings as identified by ultimate recipients via survey:
Overall and based on investments until today, how well did CCBF investments address the following in your community. (n=923).
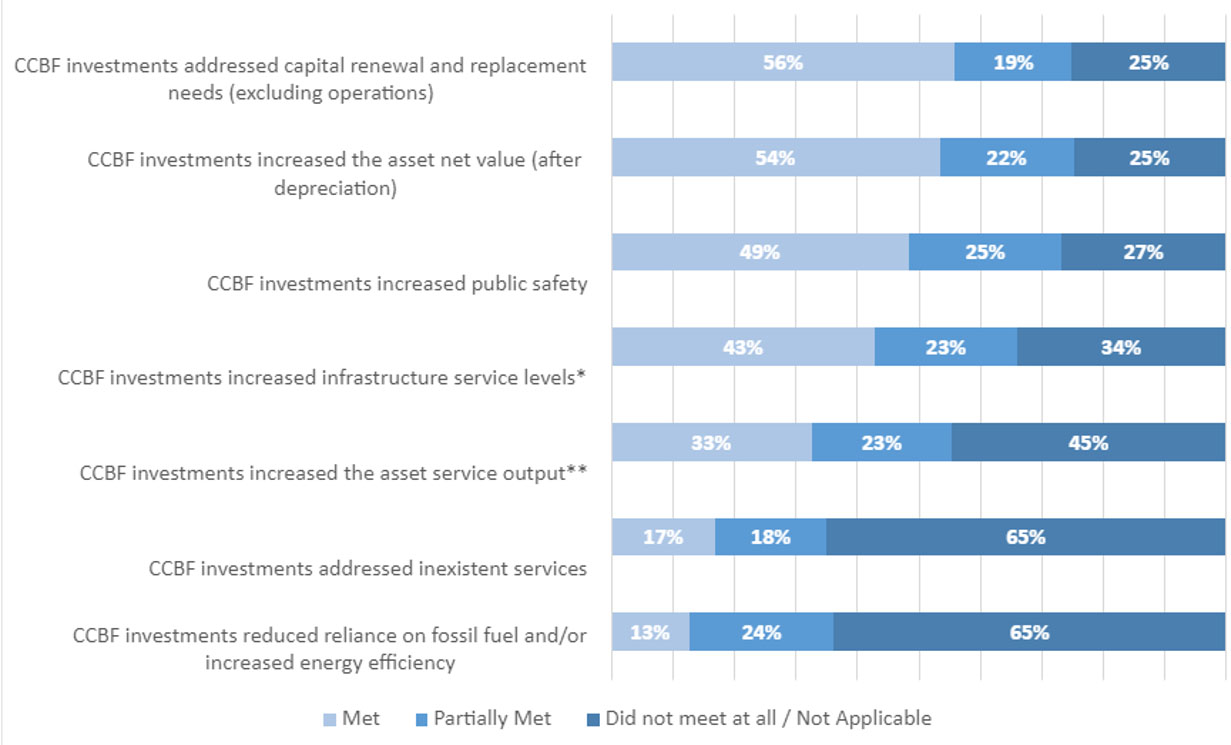
*Levels of service reflect social and economic goals of the community and may include any of the following parameters: safety, customer satisfaction, quality, quantity, capacity, reliability, responsiveness, environmental acceptability, cost, and availability.
**Service outputs refers to the quantity of services produced or provided to Canadians
Text description of Figure A-13
CCBF investments ratings as identified by ultimate recipients via survey
This figure shows the percentage of ultimate recipients who answered “met”, “partially met”, or “did not meet at all/ not applicable” in response to the question “overall and based on investments until today, how well did CCBF investments address the following in your community?” (n=923) for the following statements:
CCBF investments addressed capital renewal and replacement needs (excluding operations) – 56% met ; 19% partially met ; 25% did not meet at all / not applicable
CCBF investments increased the asset net value (after depreciation) - 54% met ; 22% partially met ; 25% did not meet at all / not applicable
CCBF investments increased public safety - 49% met ; 25% partially met ; 27% did not meet at all / not applicable
CCBF investments increased infrastructure service levels* - 43% met ; 23% partially met ; 34% did not meet at all / not applicable
CCBF investments increased the asset service output** - 33% met ; 23% partially met ; 45% did not meet at all / not applicable
CCBF investments addressed inexistent services - 17% met ; 18% partially met ; 65% did not meet at all / not applicable
CCBF investments reduced reliance on fossil fuel and/or increased energy efficiency - 13% met ; 24% partially met ; 65% did not meet at all / not applicable
Productivity and economic growth
Projects within the category supporting long-term economic growth contributed to job creation and GDP growth, as well as improved road infrastructure, improved capacity and quality of public transit, and improved air and rail infrastructure that reduce commute times and increase efficiency and productivity. CCBF funding also supported active transit infrastructure by enabling more bike lanes, trails, and sidewalks. Funding in Broadband Connectivity also increased access to high-speed internet that facilitates remote working, flexibility, increased productivity, and the creation of new jobs.
Table A-6. Contribution of CCBF spending towards productivity and economic growth.
| GDP | Jobs |
|---|---|
|
|
Urban mobility
CCBF expenditures account for 30.19% (equipment only*) of total public investment in public transit. Between 2014-2019, this contributed to improved urban mobility:
- 9% increase of the public transit service area
- 9.2% public transit commuter growth (% increase of commuters using public transit)
- 6.1% Public Transit Ridership growth (# of passengers boarding public transportation)
- 10.1% Vehicle Km Travelled (VKT) growth
*for public transit only equipment expenditures were considered for this assessment due to limited INFEA data on Public Transit structure
Key highlights:
- $2.76 billion was spent in the Local Roads and Highways category across 7,137 projects in all provinces and territories, excluding Quebec. In Quebec, $104 million was spent under the Gas Tax and Quebec Contribution Program (TECQ ) Priority 4 category between 2014-15 and 2018-19, which includes local roads and highways.
- The Northwest Territories presents a unique reporting variation, with $9 million in funding going to 29 projects in Active Transportation; this designation is typically included under the local roads and bridges CCBF category.
- $1.69 billion was spent on Public Transit and Short-Line Rail across 400 projects in AB, BC, NT, NS, ON, PEI, SK and YK. In Quebec, $248 million was spent on 100 maintenance, development and improvement projects for transportation organizations. CCBF contributed to 14% of the total public transit equipment and machinery investment in Canada from 2014-15 to 2018-19.
- $9.96 million was spent on in Regional and Local Airports across 33 projects in AB, BC, MB, NS, ON and SK.
CCBF funding in action:
BC Transit used CCBF funds to construct a compressed natural gas (CNG) fueling station in the Regional District of Nanaimo for their fleet of low-emission buses. The construction of this station supports environmentally friendly and cost-efficient buses, as CNG reduces fleet greenhouse gas and costs less than traditional diesel fuel. Feedback has shown that riders also experience a quieter ride with CNG-powered buses. The adoption of this fueling method for public transit also supports British Columbians across the province employed by the natural gas industry.
Clean environment
Projects within the category supporting clean environment contributed to: reduced GHG emissions; cleaner and safer water/wastewater including improved treatment levels to meet regulatory standards and reduce risk of leakage and collapsing lines; better solid waste management; increased waste diversion and recycling; technologies that aim to improve environmental sustainability (i.e., new methods of recycling, reductions in energy consumption); and reduced or remediated pollutants by brownfield redevelopment.
Key highlights:
- $130 million was spent on increased energy efficiency and community energy through 938 projects in all provinces and territories, excluding Quebec. In Quebec $104 million was spent under the TECQ Priority 4 category between 2014-15 and 2018-19 that includes energy improvement works of buildings.
- $792 million was spent on drinking water and wastewater across 2,797 projects in all provinces and territories, excluding Quebec. In Quebec $512 million was spent under the TECQ Priority 1 category between 2014-15 and 2018-19 that includes drinking water and wastewater treatment equipment. Additionally, Quebec spent $861 million under the TECQ Priority 3 category which includes renewal of drinking water and sewer mains.
- $186 million was spent on solid waste across 303 projects in all provinces and territories, excluding Quebec. CCBF contributed 5.83% of the total (private and public) funding towards new solid waste assets and asset improvement in Canada from 2014-15 to 2018-19, more than any other funding source.
- $6 million was spent on brownfield remediation across 10 projects in all provinces and territories, excluding Quebec.
CCBF funding in Action:
In Lutsel K’e (/loot-sel-kay/), Northwest Territories, the community installed 144 solar panels with CCBF funding. The solar array system is connected to the existing power grid to supplement the use of diesel power provided by the Northwest Territories Power Corporation. Through this project, Lutsel K’e Dene First Nation became the first community in the northern territories to be an independent power producer, supplying power to the community grid through a power purchase agreement with the Northwest Territories Power Corporation.
Strong cities and communities
Projects within the category supporting strong cities and communities contributed to: enhanced disaster mitigation; lowered levels of risk from natural or other disasters; increased recreational, sports, and cultural infrastructure to help more residents engage with their communities; and, tourism infrastructure to attract visitors and support local businesses.
Key highlights:
- $265 million in CCBF expenditure supporting 1,523 community projects in 11 provinces and territories. In Quebec, $268 million was spent under their TECQ priority 3 between 2014-15 and 2018-19, this includes the construction or renovation of municipal infrastructures with cultural, community, sport or leisure vocation and the deployment of a high-speed internet network.
CCBF funding in Action:
The Regional District of Central Kootenay, British Columbia, retrofitted the Nelson and District Community Aquatic Centre using CCBF funds. The renovations completely renewed the facility, extending its life expectancy by 40 years, improving access for those with mobility challenges, and improving all major pieces of mechanical equipment. Following the upgrades, attendance at and visits to the Aquatic Centre increased.
The communities of Hazelbrook and Kinkora, Prince Edward Island, used CCBF funds to develop Capacity Building Official Plans to guide the physical, social and economic development of these communities. The official plan will provide policy direction for council's actions well into the future.
Key finding #9: CCBF has contributed to capacity building and asset management practices.
Program agreements with signatories contain written requirements mandating asset management development. Requirements are intended to be flexible and tolerant of variations in asset management capacity and maturity. These requirements serve as driving motivators for the continued development of asset management practices across Canada. Progress towards asset management development is monitored via Outcomes Reports.
Program documents show that all provinces and territories have used CCBF funding in support of capacity building. Between 2014-19, this accounted for $68.4 million spread across 868 projects and 421 ultimate recipients, in addition to capacity building projects in Quebec.
While capacity building expenditures are not exclusively for asset management, they are inclusive of several asset management sub-categories (i.e., integrated community sustainability planning, land use planning, etc.). Flexibility to design asset management initiatives according to local realities is a purposeful design, as indicated by program documents, though it prevents a national analysis.
Ultimate recipients in five provinces used CCBF capacity building expenditures specifically towards the development of an asset management plan, including New Brunswick, Ontario, Saskatchewan, Alberta, and British Columbia.
Asset management plan development accounted for 89 projects totaling $11.49 million, roughly 17% of total CCBF capacity building expenditures.
Capacity Limitations in Asset Management
- Literature indicates that large municipalities are more likely to have sufficient resources and staff, whereas the most common barrier for many small and medium-sized municipalities is a lack of resources.
- 60% of Canadian municipalities, most of which are rural communities, have six or fewer staffFootnote4. Many communities lack the professional or financial capacity needed to build additional asset management. This results in limited capacity to oversee development and improvement of asset management plans.
Supporting Canadian Communities
Apart from the CCBF, ultimate recipients indicated that other mechanisms, programs, and funding sources exist in support of asset management. Many of these initiatives are at the local or regional levels.
At the national level, 24% of ultimate recipients indicated that the most common source of asset management support (outside of CCBF) asset management support (outside of CCBF) is the MAMP, a national program funded by INFC and delivered via the FCM. The MAMP was fully prescribed early due to a high demand for asset management support. As such, many communities have a continued need with support for awareness building and municipal capacity building.
The importance of CCBF asset management expenditure is highlighted by 26% of ultimate recipients identifying CCBF as the sole source of funding support for their asset management improvement.
Continued Asset Management Support
Signatories indicated that asset management requirements should retain their current flexibility as it accounts for existing variations in asset management maturity and capacity among provinces and territories.
Program signatories indicated a desire for continued asset management support, as well as the development of tools, resources, and national best practices to enhance support going forward.
Figure A-14: 72% of ultimate recipients indicated they have an asset management plan in place. (n = 923).
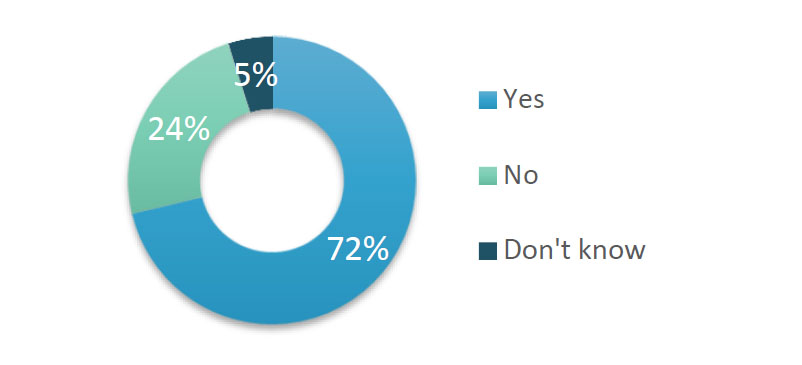
Text description of Figure A-14
Percentage of Ultimate Recipients who indicated they have an asset management plan in place (n=923)
This figure shows the percentage of ultimate recipients who have indicated that they have an asset management plan in place:
Yes: 72%
No: 24%
Don’t know: 5%
Case Study: Asset Management Practices in Quebec
The province of Quebec is a good example of where several asset management best practices are in place:
- Manages the entirety of CCBF expenditure via asset management plans.
- Specific to water and wastewater services, each ultimate recipient must retain an intervention plan defining expected dates for renewal work to be completed.
- Utilizes intervention plans with a tiered approval process, developed by a locally-appointed engineer and later approved by the provincial Ministry of Municipal Affairs and Housing.
Inclusivity
Key finding #10: There is limited understanding in how CCBF is benefitting diverse populations and communities. Signatories and ultimate recipients have expressed interest in exploring ways in which CCBF can support diverse populations and a diverse range of community types.
- Literature and interviews identify the inherent link between improved public infrastructure and benefits to diverse populations.
- Since the last agreements there are new federal requirements to consider GBA+ in program design, implementation and evaluation. Evolving needs and the changing social context of Canadians have also put a strong focus on addressing inequities (i.e., reduce gaps between urban and rural areas), in line with government commitments towards United Nations Sustainable Development Goals.
- While CCBF was not viewed as being specifically intended to benefit diverse populations, 74% of signatories and ultimate recipients believe that CCBF could be doing a better job in sufficiently supporting diverse populations.
- Literature, previous program evaluations, survey respondents and interviews identified the following demographic categories as the most relevant for CCBF:
- Small/rural/remote communities
- Northern communities
- Indigenous peoples
- Persons with disabilities
- Signatories and interviewees suggested targeted funding to address the infrastructure challenges of these diverse groups.
- Literature indicates that a one-size-fits all approach, including per-capita allocation, does not adequately support Canada’s diverse population.
- The CCBF is allocated on a per-capita basis for provinces and territories based on Statistics Canada data. Prince Edward Island and each of the three territories also receive an additional base funding amount of 0.75% of total annual CCBF funding. Provinces and territories allocate to communities through diverse formulas.
- 98.6% of the Canadian population and 76% of Canadian communities were eligible under CCBF from 2014-19.
- Not all eligible communities reported expenditures of CCBF funds from 2014-2019.
- First Nations on-reserve are served under CCBF by the First Nation Infrastructure Fund delivered by Indigenous Services Canada.
- Most ineligible communities under INFC’s CCBF are First Nation reserves and unorganized communities.
- Program data, though limited in illustrating impacts on diverse populations, shows CCBF funding infrastructure for Indigenous peoples in eligible communities:
- In the territories, funding goes towards communities with high populations of Indigenous peoples, as well as to 48 projects in 12 First Nations in the Yukon and the Northwest Territories.
- In Quebec, 14 northern Inuit communities in the Nunavik region received funding for 29 projects.
Key finding #11: Expenditure data indicates that smaller communities are less likely to spend CCBF funds, banking over multiple years to fund projects. Differences in per capita expenditure were noted between remote communities in provinces and in territories.
Smaller communities were more likely to bank their allocated CCBF funds.
Generally, annual CCBF contributions to small and rural communities (population below 30,000) are not large enough to fund entire projects. Banking across multiple fiscal years is used to accrue sufficient funding allowing these communities to entirely or partially fund infrastructure projects in their communities. In the survey, 84% of respondents with populations under 30,000 noted that it was important to save allocated money for future projects and 87% felt that this flexibility was a benefit to their community.
Of eligible communities, rural communities were least likely to spend CCBF funding between 2014-2019.
- Rural communities in Canada (those with a population of less than 1,000) are home to 16% of the Canadian population.
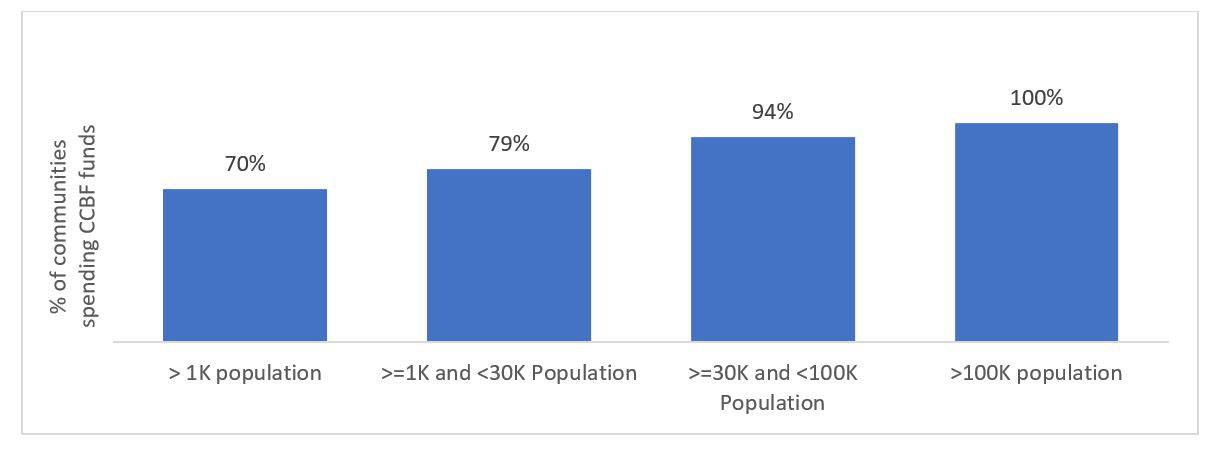
- 70% of eligible rural communities reported expenditure of CCBF funds from 2014-2019.
Figure A-15. The smaller the community, the less likely they were to spend CCBF funding between 2014-19.
Text description of Figure A-15
Proportion of eligible communities with CCBF expenditure by community size
This figure shows the proportion of communities that are eligible for CCBF funding who are spending CCBF funds across 4 population ranges: less than 1 thousand people, 1 thousand to 29. 9 thousand people, 30 thousand to 99.9 thousand people, and greater than or equal to 100 thousand people, and unknown.
Less than 1 thousand people: 70%
1 thousand to 29.9 thousand people: 79%
30 thousand to 99.9 thousand people: 94%
Greater than or equal to 100 thousand people: 100%
The majority of communities that did not spend their allocated CCBF funds from 2014-2019 were small and rural communities (population below 30,000).
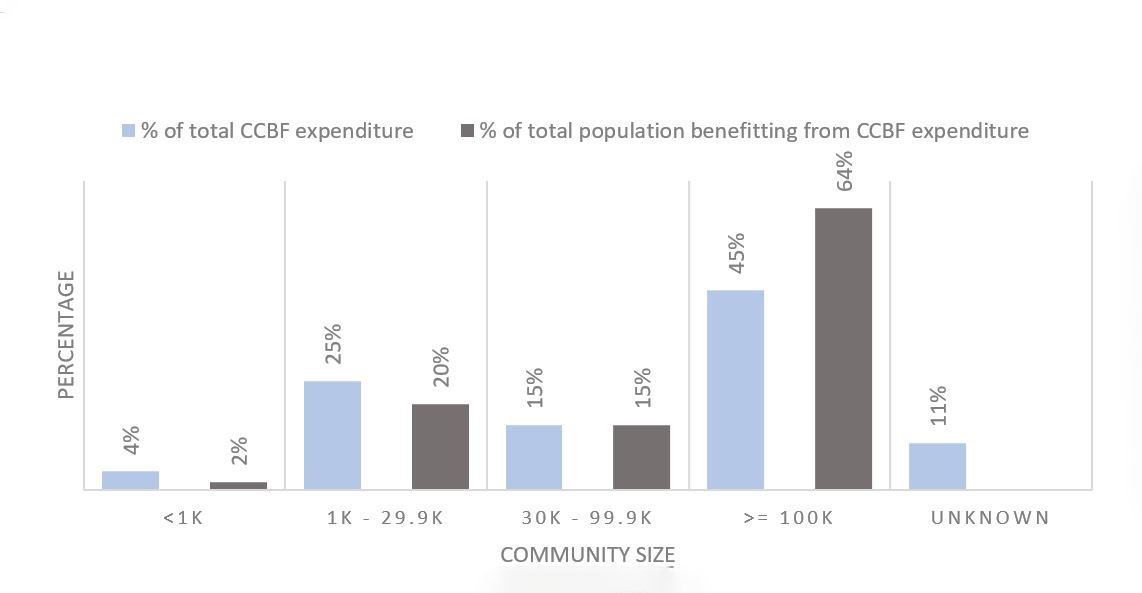
When smaller communities did spend CCBF funds, they spent greater amounts per capita likely due to banking funds over multiple years.
Figure A-16. Smaller communities with CCBF expenditures from 2014-2019 tend to report a greater expenditure share than larger communities.
Text description of Figure A-16
Rural and small communities have greater CCBF expenditure than their CCBF population share
This figure shows the percentage of total CCBF expenditure and the percentage of total population benefitting from CCBF expenditure across 5 populations ranges: less than 1 thousand people, 1 thousand to 29. 9 thousand people, 30 thousand to 99.9 thousand people, and greater than or equal to 100 thousand people, and unknown.
Less than 1 thousand people: 4% of total CCBF expenditure
2% of the total population benefitting from CCBF expenditure
1 thousand to 29.9 thousand people: 25% of total CCBF expenditure
20% of the total population benefitting from CCBF expenditure
30 thousand to 99.9 thousand people: 15% of total CCBF expenditure
15% of total population benefitting from CCBF expenditure
Greater than or equal to 100 thousand people: 45% of total CCBF expenditure
64% of total population benefitting from CCBF expenditure
Unknown: 11% of total CCBF expenditure
Northern communities typically experience higher infrastructure costs than larger urban centres. In the case of small and remote communities, costs for certain asset types may also be higher. In particular, as population density decreases, per capita costs increase. Infrastructure costs for these communities may be influenced by a variety of factors, some of which include:
- Servicing a larger geographic area with a smaller tax base
- Limited municipal capacity
- Distance from services
There is real and perceived disparity in per capita expenditure in remote communities.
Remote communities are in every province and territory, though some provinces have higher proportions of remote communities. Remoteness is measured using the Statistics Canada Remoteness Index, whereby communities are assigned a value between 0 and 1, with 1 being the most remote. This evaluation considered communities with a value above 0.6 in this analysis.
Expenditure data shows that as communities become smaller and more remote, their citizens are less likely to benefit from CCBF expenditure from 2014-2019.
- Of all communities (CSDs) that are classified as remote, 47% reported CCBF expenditure between 2014 and 2019. This compares to 100% expenditure in communities with populations greater than 100,000.
Figure A-17. Less than half of remote communities were spending CCBF funds between 2014-19, yet more than half of the remote population benefitted from CCBF expenditure.

Text description of Figure A-17
Proportion of Remote communities and population spending CCBF funds (2014-19)
This figure shows the proportion of remote communities with CCBF expenditure: 47% ; and the proportion of remote population in communities with CCBF expenditure: 55%
In the view of signatories, ultimate recipients and interviewees, per capita funding frameworks may be inequitable as they do not account for differences in geography, remoteness, and population density. This notion is also supported by the literature.
- Comparing per capita expenditure for populations with similar demographics, geographies and infrastructure challenges may identify whether some communities benefit more than others.
CCBF funding is allocated to the territories (as well as to Prince Edward Island) with a base funding amount of 0.75% of total annual funding, in addition to per capita allocation.
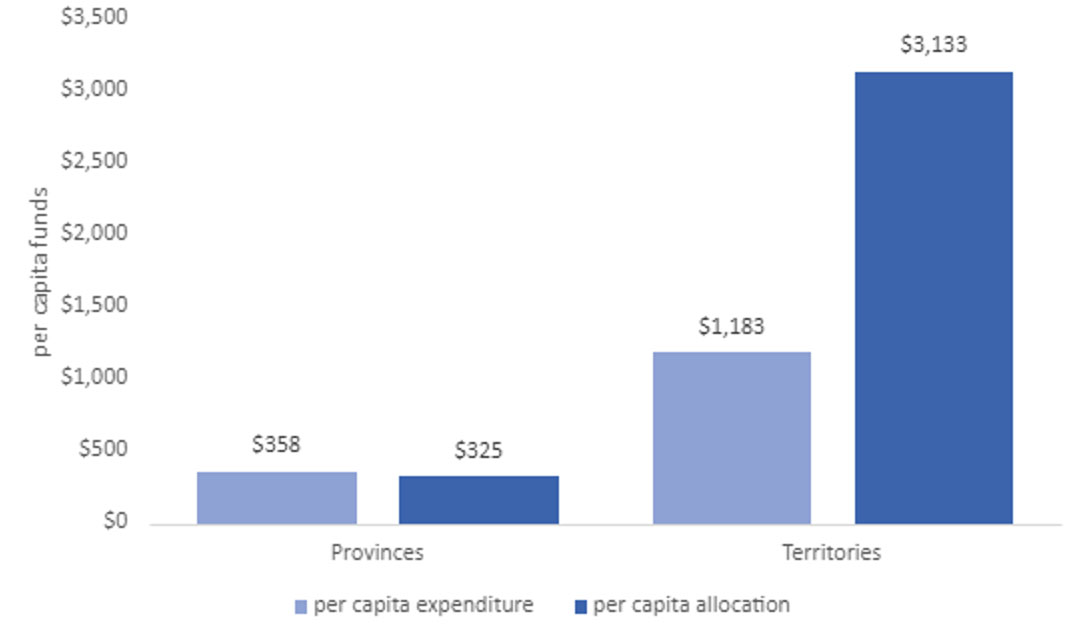
In figure A-18 below, the per capita allocation of CCBF funds is compared to the per capita expenditure for remote communities that reported expenditure between 2014-19. Communities that did not report any expenditure in those years are not included. Per capita allocation and expenditure is higher for remote communities in the territories than remote communities in the provinces. Remote communities in the provinces spent more CCBF funds than they were allocated in that time period. Remote communities in the territories spent less CCBF funds than they were allocated in that time period. The difference between allocation and expenditure is likely a reflection of how communities bank and spend CCBF funds.
Figure A-18. Differences in per capita CCBF expenditure and allocation for remote communities in the provinces and the territories.
Text description of Figure A-18
Per capita expenditure for remote communities in provinces and territories
This figure shows the differences in the per capita expenditure and allocation for remote communities.
Provinces: $358 per capitaCCBF expenditure ; $325 per capita CCBF allocation
Territories: $1,183 per capita CCBF expenditure ; $3,133 per capita CCBF allocation
For remote communities, 85% of survey respondents noted that it was important to save allocated money for future projects.
Annex B: Management Action Plan
Table B-1. Management Action Plan.
| Recommendation | Management Action Plan | Office of Primary Interest and Due Date | |
|---|---|---|---|
| 1 | It is recommended that INFC ensure that resources are made available and kept up to date in support of both signatories and ultimate recipients. These resources could include clear and consistent reporting guidelines established and communicated in advance of a reporting cycle; a regularly updated list of key contacts within INFC and at the signatory level and with participating CCBF ultimate recipients; key roles and responsibilities for all parties; documents/tools that provide information on eligibility. | Agreed. The Communities and Infrastructure Programs Branch (CIP) will develop and post online reference resources supporting the CCBF program, in consultation with CIP program delivery partners and CCBF signatories. | Responsible: Assistant Deputy Ministers (ADM), Communities and Infrastructure Programs CIP Timelines: December 2022 |
| 2 | In future negotiations, it is recommended that INFC strengthen the reporting framework and requirements to move towards the establishment and use of common indicators for outcomes reporting. These indicators should be clearly aligned with the desired outcomes and objectives of CCBF, as well as INFC. It would be worth examining the indicators already in place for other programs to determine if they can be applied towards CCBF. | Agreed. The Communities and Infrastructure Programs Branch will refine the outcomes definitions in anticipation of the next Outcomes Report cycle in 2023. This will inform a revised indicator/output/outcome structure that will be considered as a part of the CCBF program renewal process for 2024. | Responsible: ADMs, CIP Timelines: April 2023 |
| 3 | To better align to evolving inclusiveness priorities, it is recommended that INFC conduct a GBA+ analysis for the upcoming renewal of CCBF. This could include exploring the specific needs and geographic contexts of small/rural/remote and Northern communities, as well as how those communities and Indigenous persons and persons with disabilities are impacted by the CCBF. | Agreed. The Communities and Infrastructure Programs Branch will complete a GBA+ analysis to support policy development for the upcoming renewal of the CCBF program. | Responsible: ADMs, CIP Timelines: December 2022 |
Annex C: Methodology
Lines of Evidence
Multiple lines of evidence have drawn on both quantitative (i.e., administrative and financial data) and qualitative data (i.e., key informant interviews). The analytical methods used for this evaluation were tailored to the nature of the data available. The evaluation design and level of effort was calibrated with available INFC resources. The following lines of evidence were used for data collection:
Document Review
The document review examined fundamental documents to provide context and understanding of the CCBF and activities undertaken over the last 5 years. Notable documents included TB Submission, Terms and Conditions, Performance Information profile and CCBF outcomes reports (from 2014 & 2018), as well as external reports such as the 2016 OAG report and 2019 PBO report on IICP, in order to assess the INFC, signatories and ultimate recipients' roles and responsibilities, as well as the progress towards expected outcomes.
Literature Review
The literature review consisted of reviewing the academic literature to identify infrastructure gaps, links between infrastructure projects, and INFC’s outcomes and efficient program delivery mechanisms.
Interviews
Key informant interviews were conducted to identify key informants’ needs, progress made toward CCBF outcomes, and possible improvements to the CCBF. Key informant groups include INFC officials and representatives from the FCM. Several municipal associations were also given a series of similar questions to those asked during the interview process and asked to compose written responses for INFC to review.
Program & External Data Review
The program and external data review consisted of reviewing administrative and financial data, through CCBF databases (i.e., CCBF project lists for 2014-15 to 2018-19), the province of Quebec databases (i.e., SOFIL, MTQ), Public Accounts and Main Estimates, and the 2014-15 to 2019-20 AERs related to the CCBF. The data was first reviewed to correct errors and inconsistencies as well as to understand the scope of what was available. Following the review, data standardization and indicator selection took place to ensure comparability and successful analysis. Program data was used to support in-depth analytical research done by INFC officials as well as providing financial information related to CCBF at the provincial/territorial and ultimate recipients' levels. Outside of the findings directly informed by data analysis, program data was also used to contextualize other lines of evidence and provide a national-level understanding of program performance.
Survey
Two surveys, one for signatories and another for ultimate recipients were conducted to support the evaluation. A 3rd party contractor, was contracted to work with INFC and its various stakeholders to design and implement the survey. Pre-notification emails were sent by INFC prior to the survey being sent out. Surveys were conducted electronically, with reminder notifications sent approximately one week apart. During the fielding period, the contractor also phoned ultimate recipients to complete the survey by phone or collect a new email address at which to send the survey. Responses were completed by members from all provinces and territories apart from Quebec. The response rate for signatories was approximately 50% and 43% for ultimate recipients.
Evaluation Limitations/Risks and Mitigation Strategy
Nine (9) limitations were encountered throughout the evaluation:
Data consistency: the lack of uniformity in reporting practices presented unique challenges in ensuring data comparability. Comparability issues were addressed and methodological details were provided in the analysis where appropriate.
Additionally, data submitted by the province of Quebec differs from that of other signatories, yielding comparability issues. This is due to the way the 18 asset categories are grouped. In Quebec they are arranged under the following four priorities: Water and Wastewater Filtration Equipment (TECQ-1); Capacity Building/Awareness (TECQ-2); Water and Wastewater Mains (TECQ-3); and Local Roads, Solid Waste, Telecommunications, Energy, Recreation , Sports and Culture (TECQ-4). This was mitigated by reporting on projects and funding separately where possible. However, it was not possible to include the Quebec data in the national level analysis (i.e. INFEA, expenditures by CCBF objective).
Indigenous data availability: the central challenge with respect to Indigenous data was building alignment between program and census data. Initial data analysis utilized formulas that estimated the Indigenous population per census sub-divisions but results were not comparable to census Indigenous data. A review of this analysis is currently underway by INFC officials.
Literature availability: the literature review had some overlap with the document review, as a significant portion of literature available covering CCBF was often published by provincial and/or municipal governments. While topics such as inclusivity were covered extensively in a non-CCBF context, very little literature existed connecting topics of interest to CCBF specifically; it was, however, more common for literature to cover connections between relevant topics and infrastructure in general and high-level comparisons could be made.
Document review scope: given the design of the CCBF, program documentation on projects is limited. For example, it did not include ultimate recipient information on asset management practices or relationships between signatories and ultimate recipients. Although not a program requirement, this limited the evaluators’ depth of analysis. The survey was able to mitigate the lack of ultimate recipient documentation, providing a mechanism for gathering their perspectives. It was difficult to ascertain progress using the Outcomes Reports given the variation across provinces and territories. As such, the review of financial program and INFEA data was used to demonstrate results.
Ultimate recipient survey respondent availability: missing information for Nunavut sample. In the original sample file of URs, only two of the eight URs in Nunavut had a name or contact information. Approximately four weeks into fielding the survey, additional contact information was obtained for the remaining six URs in Nunavut, which resulted in two completed surveys. Additionally, analyses informed by survey results are exclusive of Quebec due to a nil response.
Ultimate recipient survey results reliability: assessing results for groups with limited sample size. Several key points of analysis for this survey were examining results by URs in remote communities and those in Northern communities. Results for those groups are quite small, with just 16 communities in the three territories and 34 communities with a remote index greater than 0.60 completing the survey. Although the response rate for these groups was in line with results for URs as a whole, the reliability of results for groups this small can be low relative to larger groups.
Signatory survey sample size: the primary challenge with the survey is the small sample size (n = 37) and number of responses (n = 19). Although all signatories were provided the opportunity to complete the survey, a 51% response rate was lower than hoped. However, given feedback from signatories during the survey phase (along with the fact that at least one survey was completed in each province/territory), it appears that in provinces/territories with multiple signatories, there may have been a decision for collaboration among signatories to provide a single response rather than completing separate surveys. In addition, analyses informed by survey results are exclusive of Quebec due to a nil response. This was mitigated through interviews with Quebec representatives.
Signatory survey question design: the difficulty in identifying clear themes for open-ended questions was a limitation, as not all signatories provided responses to open-ended questions (either because they were unsure of an answer or did not have a relevant response). Therefore, signatories’ verbatim comments to open-ended questions were presented throughout the report.
Annex D: Program Funding
Program Overview
CCBF Funding
Federal budget allocations to the CCBF total $21.80 billion between 2014-15 and 2023-2024. An additional $4.4 billion was allocated to the CCBF via two ‘top-ups’, in 2019-20 and 2021-22, each valued at $2.2 billion. With these top-ups, the total CCBF budget allocation from 2014-15 to 2023-2024 is $26.2 billion.
CCBF transfers to signatories with Infrastructure Canada, both actual and forecasted, total $25.93 billion from 2014-15 to 2023-24. The remaining $270 million in funding is mostly managed by Indigenous Services Canada, as they also administer the CCBF to First Nations communities via the FNIF. Also included in the $270 million are transfers of uncommitted funds from legacy programs (totaling $81 million) transferred to INFC signatories in 2016-2017 and 2021-2022.
Table D-1. CCBF Funding
(In billions of $)
| Fiscal Years | Federal Budget Allocation | Additional Top-up Allocation | Actual and Forecasted CCBF Transfers to Signatories by INFC |
|---|---|---|---|
| 2014-15 | 2.00 | - | 1.97 |
| 2015-16 | 2.00 | - | 1.97 |
| 2016-17 | 2.10 | - | 2.10 |
| 2017-18 | 2.10 | - | 2.07 |
| 2018-19 | 2.20 | - | 2.17 |
| Sub-total | $10.40 | - | $10.29Footnote5 |
| 2019-20 | 2.20 | 2.20 | 4.34 |
| 2020-21 | 2.20 | - | 2.17 |
| 2021-22Footnote6 | 2.30 | 2.20 | 4.49 |
| 2022-23 | 2.30 | 2.27 | |
| 2023-24 | 2.40 | - | 2.37 |
| Sub-total | $11.40 | $4.40 | $15.64Footnote7 |
| TOTAL | $21.80 | $4.40 | $25.93 |
Sources of data: Public Accounts of Canada, 2021-22 Main Estimates and Supplementary Estimates, Annual Reference Level Update
The two following tables provide the current status of the Annual Expenditures Reports from 2014-15 to 2018-19, which are provided by the signatories.
Those reports provide financial statements at the provincial/territorial and ultimate recipient levels.
Provincial and territorial level
Table D-2. Provincial and territorial level funding
(in millions of $)
| Provincial and territorial level | 2014-15 | 2015-16 | 2016-17 | 2017-18 | 2018-19 | Total 2014-19 |
2019-20 |
|---|---|---|---|---|---|---|---|
| Opening Balance | 826.5 | 1,348.3 | 1,225.0 | 1,430.0 | 1,197.5 | 1,063.8 | |
| Adjustments from previous year | 0.4 | (2.8) | (0.3) | 0.0 | (114.8) | 0.0 | |
| Revised opening balance | 826.9 | 1,345.4 | 1224.6 | 1429.8 | 1082.6 | 1,063.8 | |
| Plus: Received from CCBF funding | 1,980.8 | 1,973.3 | 2,071.9 | 2,074.7 | 2,162.3 | 10,263.0 | 4,456.0 |
| Plus: Unused legacy funding | 0.0 | 0.0 | 23.9 | 6.3 | 30.2 | ||
| Minus: Transferred to URs | (1,458.6) | (2,092.4) | (1,888.3) | (2,311.5) | (2,182.8) | (9,933.6) | (3,144.3) |
| Plus: Interest Earned | 15.2 | 11.9 | 13.1 | 20.2 | 34.8 | 95.2 | 50.8 |
| Minus: Administration Costs | (10.2) | (7.8) | (9.7) | (10.0) | (10.3) | (48.1) | (10.7) |
| Minus: Transferred to SOFIL | (5.2) | (5.3) | (5.4) | (11.6) | (22.7) | (50.3) | (34.9) |
| Plus: Transferred from reserve (AMO) | 0 | 0 | 0 | 0 | 0 | 0 | 8.8 |
| Minus: Capacity Building | (0.5) | (0.2) | (0.2) | (0.7) | (0.6) | (2.2) | (1.1) |
| Closing balance | 1,348.3 | 1,225.0 | 1,430.0 | 1,197.5 | 1,063.8 | 2,388.6 |
Ultimate recipient level
Table D-3. Ultimate recipient level funding
(in millions of $)
| Ultimate recipient level | 2014-15 | 2015-16 | 2016-17 | 2017-18 | 2018-19 | Total 2014-19 |
2019-20 |
|---|---|---|---|---|---|---|---|
| Opening Balance | 1,536.8 | 1,468.6 | 1,691.9 | 1,564.5 | 1,882.2 | 2,217.7 | |
| Adjustments from previous year | (10.0) | (2.3) | (6.0) | (3.7) | 2.9 | (66.8) | |
| Revised opening balance | 1,526.8 | 1,466.3 | 1,685.9 | 1,560.8 | 1,885.1 | 2,150.9 | |
| Plus: Received from PTs | 1,436.6 | 2,095.4 | 1,859.6 | 2,285.7 | 2,162.1 | 9,840.5 | 2,289.0 |
| Minus: Spent on eligible projects | (1,521.0) | (1,893.4) | (2,005.4) | (1,991.7) | (1,865.8) | (9,277.3) | 2,047.6 |
| Plus: Interest earned | 26.2 | 23.5 | 24.4 | 26.4 | 36.2 | 136.7 | 44.5 |
| Closing balance | 1,468.6 | 1,691.9 | 1,564.5 | 1,882.2 | 2,217.7 | 2,436.9 |
* Annual closing balance calculations may differ due to rounding.
- From 2014-15 to 2018-19, CCBF signatories:
- Received $10.3 billion from Infrastructure Canada.
- Transferred a total of $9.9 billion to ultimate recipients, representing 96% of total CCBF funding received from INFC.
- Spent a total of $48 million on administration costs.
- Transferred $50 million to SOFIL, separate from CCBF funds transferred to QC ultimate recipients.
- Used just over $2 million on capacity building at the provincial/territorial level.
- Banked between $1 billion and $1.4 billion annually, generating $95 million in interest between 2014-19.
- From 2014-15 to 2018-19, CCBF ultimate recipients:
- Received $9.8 billion from provinces and territories
- Spent $9.3 billion on eligible projects
- Banked between $1.5 billion and $2.2 billion annually, generating $137 million in interest between 2014-19
- A program top up of $2.2 billion was transferred to signatories at the end of fiscal year 2019-20 but was not spent in that year given when the money was provided.
- The 2019-20 closing balance at the provincial and territorial level is roughly $2.4 billion, inclusive of approximately $1.2 billion of top up money.
- The remaining $1 billion of top up money was transferred to ultimate recipients but because spending fell outside of the scope of this evaluation, no insight as to when, where, and how this additional $1 billion was spent at the ultimate recipient level.
Report a problem on this page
- Date modified:
