
Shelter Capacity Report 2022

On this page
- Acknowledgements
- Introduction
- Context on data source and use
- Scope of data
- Emergency shelter capacity in Canada from 2020 to 2022
- Emergency shelter capacity by province and territory from 2020 to 2022
- Impact of COVID-19 on emergency shelter capacity from 2020 to 2022
- Emergency shelter capacity per 10,000 population from 2020 to 2022
- Distribution of emergency shelters and beds by community size in 2022
- Emergency shelter capacity by clientele served in Canada from 2020 to 2022
- Emergency shelter capacity by clientele served, per province and territory in 2022
- Annex A: Transitional housing capacity by province and territory from 2020 to 2022
- Annex B: Transitional housing capacity by clientele served, per province and territory in 2022
- Annex C: Domestic violence shelter capacity by province and territory from 2020 to 2022
- Annex D: Domestic violence shelter capacity by clientele served, per province and territory in 2022
- Annex E: Shelter capacity changes from 2021 to 2022, by province and territory
- Key Findings
- Appendix A: Glossary
- For more information
- References
Acknowledgements
We would like to thank service providers and communities across Canada for their annual and continued collaboration in the development of the National Service Provider List. This support is key to advancing the understanding of homelessness in Canada.
Introduction
The Shelter Capacity Report is an annual descriptive account of capacity statistics for emergency homeless shelters in Canada. This report provides information on the number of emergency shelter facilities and permanent beds by province and territory, clientele served, and trends in shelter capacity from 2020 to 2022. This report also includes a comparison of bed count availability to population estimates and the distribution of shelters and beds by community size. Annual statistics on transitional housing facilities and domestic violence shelters are provided in Annexes.
In addition to the Shelter Capacity Report, census subdivision-level capacity statistics for emergency shelters, transitional housing, and domestic violence shelters are available on the Statistics Canada website as a customizable tableFootnote1 and as a datasetFootnote2 on the Open Government website. These related data provide detailed and accessible information regarding the shelter landscape at various geographical levels, over a longer reference period (2016 to 2022).
Context on data source and use
Shelter capacity statistics are derived from the National Service Provider List, which serves as the annual comprehensive dataset of permanent homelessness shelter services in Canada. The data includes information on bed capacity, location, and the clientele served by these shelters. The 2022 comprehensive list of emergency and transitional servicesFootnote3, including program names and addresses, is available on the Open Government website.
Maintained and regularly updated by the Homelessness Policy Directorate of Infrastructure Canada, the National Service Provider List is a cornerstone in understanding and addressing homelessness. The annual updates are made possible through collaborative efforts, relying on data contributions from service providers, communities, and various partners. This multifaceted information is gathered through a combination of primary and secondary research methods, as well as through collaborative data-sharing initiatives with jurisdictions utilizing the Homeless Individuals and Families Information System (HIFIS) or comparable administrative systems for tracking homelessness data. The data from the National Service Provider List is not only used for reporting changes in national capacity but also for estimations of shelter useFootnote4 and chronic homelessnessFootnote5.
Scope of the data
The 2022 emergency shelter capacity data reflects the capacity as of December 31, 2022. It includes shelters that meet the following criteria:
- Operational year-round, providing emergency beds at no cost to the client
- Open as of year-end (December 31, 2022)
Transitional housing facilities and domestic violence shelters included in this report must also be operational year-round and open as of December 31, 2022. They are generally offered at no cost to the client but are still included if the cost is not tied to a lease contract.
The report presents statistics from 2020 to 2022 to examine trends over time in the shelter system. The 2020 statistics represent capacity data from February 2020 (prior to the COVID-19 pandemic), while the 2021 statistics follow the same shelter criteria as the 2022 statistics (open as of year-end).
Some shelter services are not included in the analysis, including:
- Temporary emergency shelters, including COVID-19 isolation sites and hotel spaces provided as shelter
- Supportive housing facilities
- Immigrant and refugee shelters
- Correctional services
How INFC classifies shelters
- Shelters providing services under the same umbrella organization but to different target populations and/or genders, even if located at the same address, are listed as separate shelters.
- Shelters that provide different services at the same location, such as offering both emergency services and transitional beds, are listed as separate services in the National Service Provider List due to the nature of the service.
Data limitations
Changes in the number of shelters and beds are the result of a variety of changes in the shelter system within a year, including the opening and closure of shelters, changes or updates in the type of service, and the separation or collapsing of services' capacity information based on the level of detail that service providers are able to offer. Also, new services included in the analysis may have been opened in previous years but reported for the first time in the National Service Provider List this year.
Emergency shelter capacity in Canada from 2020 to 2022
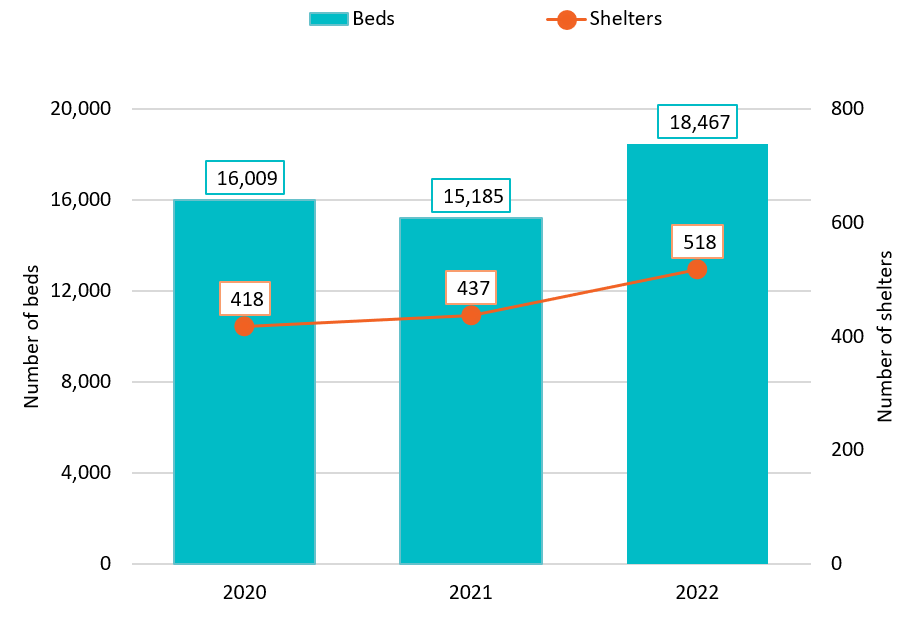
In 2022, there were 18,467 beds across 518 permanent emergency shelters in Canada. This represents a 18.5% increase in the number of emergency shelters and a 21.6% increase in the number of beds from 2021. These numbers also exceed pre-pandemic emergency shelter capacity from February 2020, and demonstrate a national growth in shelter capacity.
Figure 1: Number of emergency shelters and permanent beds in Canada from 2020 to 2022
-
Figure 1 - Text version
Year Number of permanent beds Number of emergency shelters 2020
16,009
418
2021
15,185
437
2022
18,467
518
Emergency shelter capacity by province and territory from 2020 to 2022
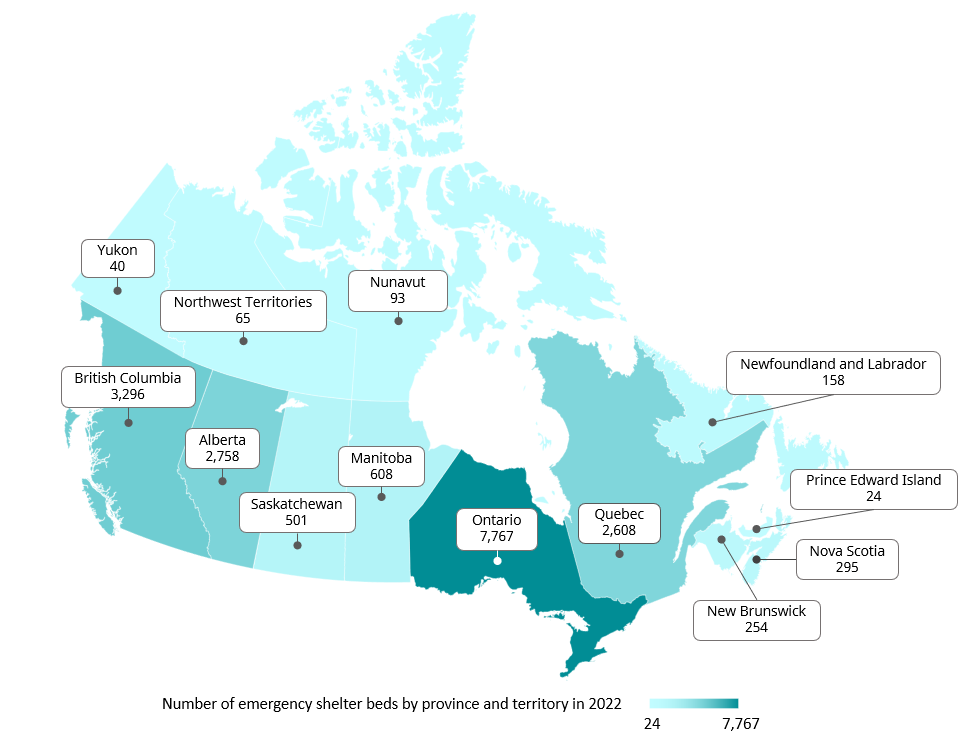
In 2022, the majority of shelter beds (89%) were located in the provinces of Ontario (42%), British Columbia (18%), Alberta (15%), and Quebec (14%). Among these, Ontario showed the smallest bed increase (14%) and British Columbia has the largest increase (34%). These provinces accounted for 87% of the Canadian population in 2022 based on quarterly population estimatesFootnote6 in the fourth quarter (Q4) of 2022.
Overall, nine provinces and territories have had bed capacity increases of 22% or more. A notable increase in bed capacity was seen in Nunavut (58%), Saskatchewan (54%), British Columbia (34%), Newfoundland and Labrador (34%), Quebec (30%), Nova Scotia (28%), and Manitoba (26%).
Figure 2: Number of emergency shelter beds by province and territory in 2022
-
Figure 2 - Text version
Province and territory
Number of emergency shelter beds in 2022
Newfoundland and Labrador
158
Prince Edward Island
24
Nova Scotia
295
New Brunswick
254
Quebec
2,608
Ontario
7,767
Manitoba
608
Saskatchewan
501
Alberta
2,758
British Columbia
3,296
Yukon
40
Northwest Territories
65
Nunavut
93
| Province and territory | Shelters | Beds | ||||
|---|---|---|---|---|---|---|
| 2020 | 2021 | 2022 | 2020 | 2021 | 2022 | |
| Newfoundland and Labrador | 14 |
14 |
17 |
125 |
118 |
158 |
| Prince Edward Island | 2 |
3 |
3 |
18 |
26 |
24 |
| Nova Scotia | 11 |
11 |
14 |
243 |
230 |
295 |
| New Brunswick | 8 |
9 |
11 |
253 |
323 |
254 |
| Quebec | 74 |
92 |
112 |
1,658 |
2,009 |
2,608 |
| Ontario | 160 |
157 |
173 |
7,351 |
6,793 |
7,767 |
| Manitoba | 16 |
19 |
15 |
436 |
484 |
608 |
| Saskatchewan | 15 |
16 |
25 |
407 |
329 |
501 |
| Alberta | 30 |
26 |
33 |
2,784 |
2,254 |
2,758 |
| British Columbia | 79 |
81 |
103 |
2,534 |
2,456 |
3,296 |
| Yukon | 3 |
3 |
3 |
59 |
39 |
40 |
| Northwest Territories | 3 |
3 |
3 |
88 |
65 |
65 |
| Nunavut | 3 |
3 |
6 |
53 |
59 |
93 |
| Canada | 418 |
437 |
518 |
16,009 |
15,185 |
18,467 |
Impact of COVID-19 on emergency shelter capacity from 2020 to 2022
The COVID-19 pandemic had short and medium-term impacts on shelter capacity in Canada. Permanent shelter capacity for the year 2020 was collected at two points in the year: February 2020 ("pre-COVID-19") and August 2020 ("during COVID-19"). The February 2020 data represent the official data for the year 2022 because the August 2020 data is the result of a compilation of actual values and approximated values to measure the impact of COVID-19 on shelter capacity. The capacity data collected during the COVID-19 pandemic (August 2020) shows that bed capacity reduced significantly across most jurisdictions (an average reduction of 22%) due in part to isolation and physical distancing protocols. Many shelters were able to extend their services to temporary locations such as leased hotels/motels. However, beds corresponding to these COVID-19 temporary response sites are not included in this analysis as they are not offered on a permanent basis.
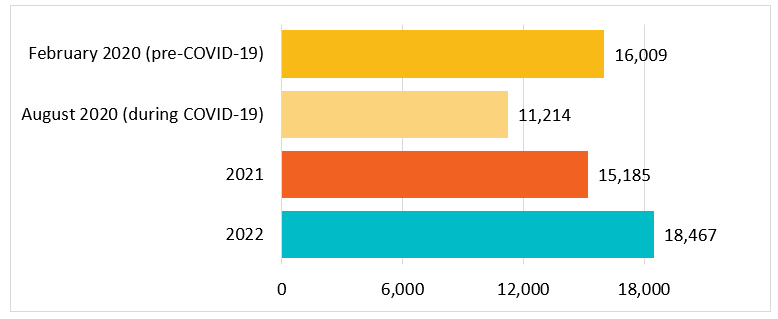
Figure 3 demonstrates the national permanent bed capacity changes between 2020 and 2022. In 2022, there were 18,467 beds representing an increase of 21.6% from 2021 (15,185). These numbers also exceed pre-pandemic emergency shelter capacity from February 2020 (16,009) by 15.5% and demonstrate a full recovery of national permanent capacity from the impact of the pandemic.
Figure 3: Impact of COVID-19 - Number of emergency beds in Canada from 2020 to 2022
-
Figure 3 - Text version
Impact of COVID-19 - Number of emergency beds in Canada from 2020 to 2022
February 2020 (pre-COVID-19)
August 2020 (during COVID-19)
2021
2022
Canada
16,009
11,214
15,185
18,467
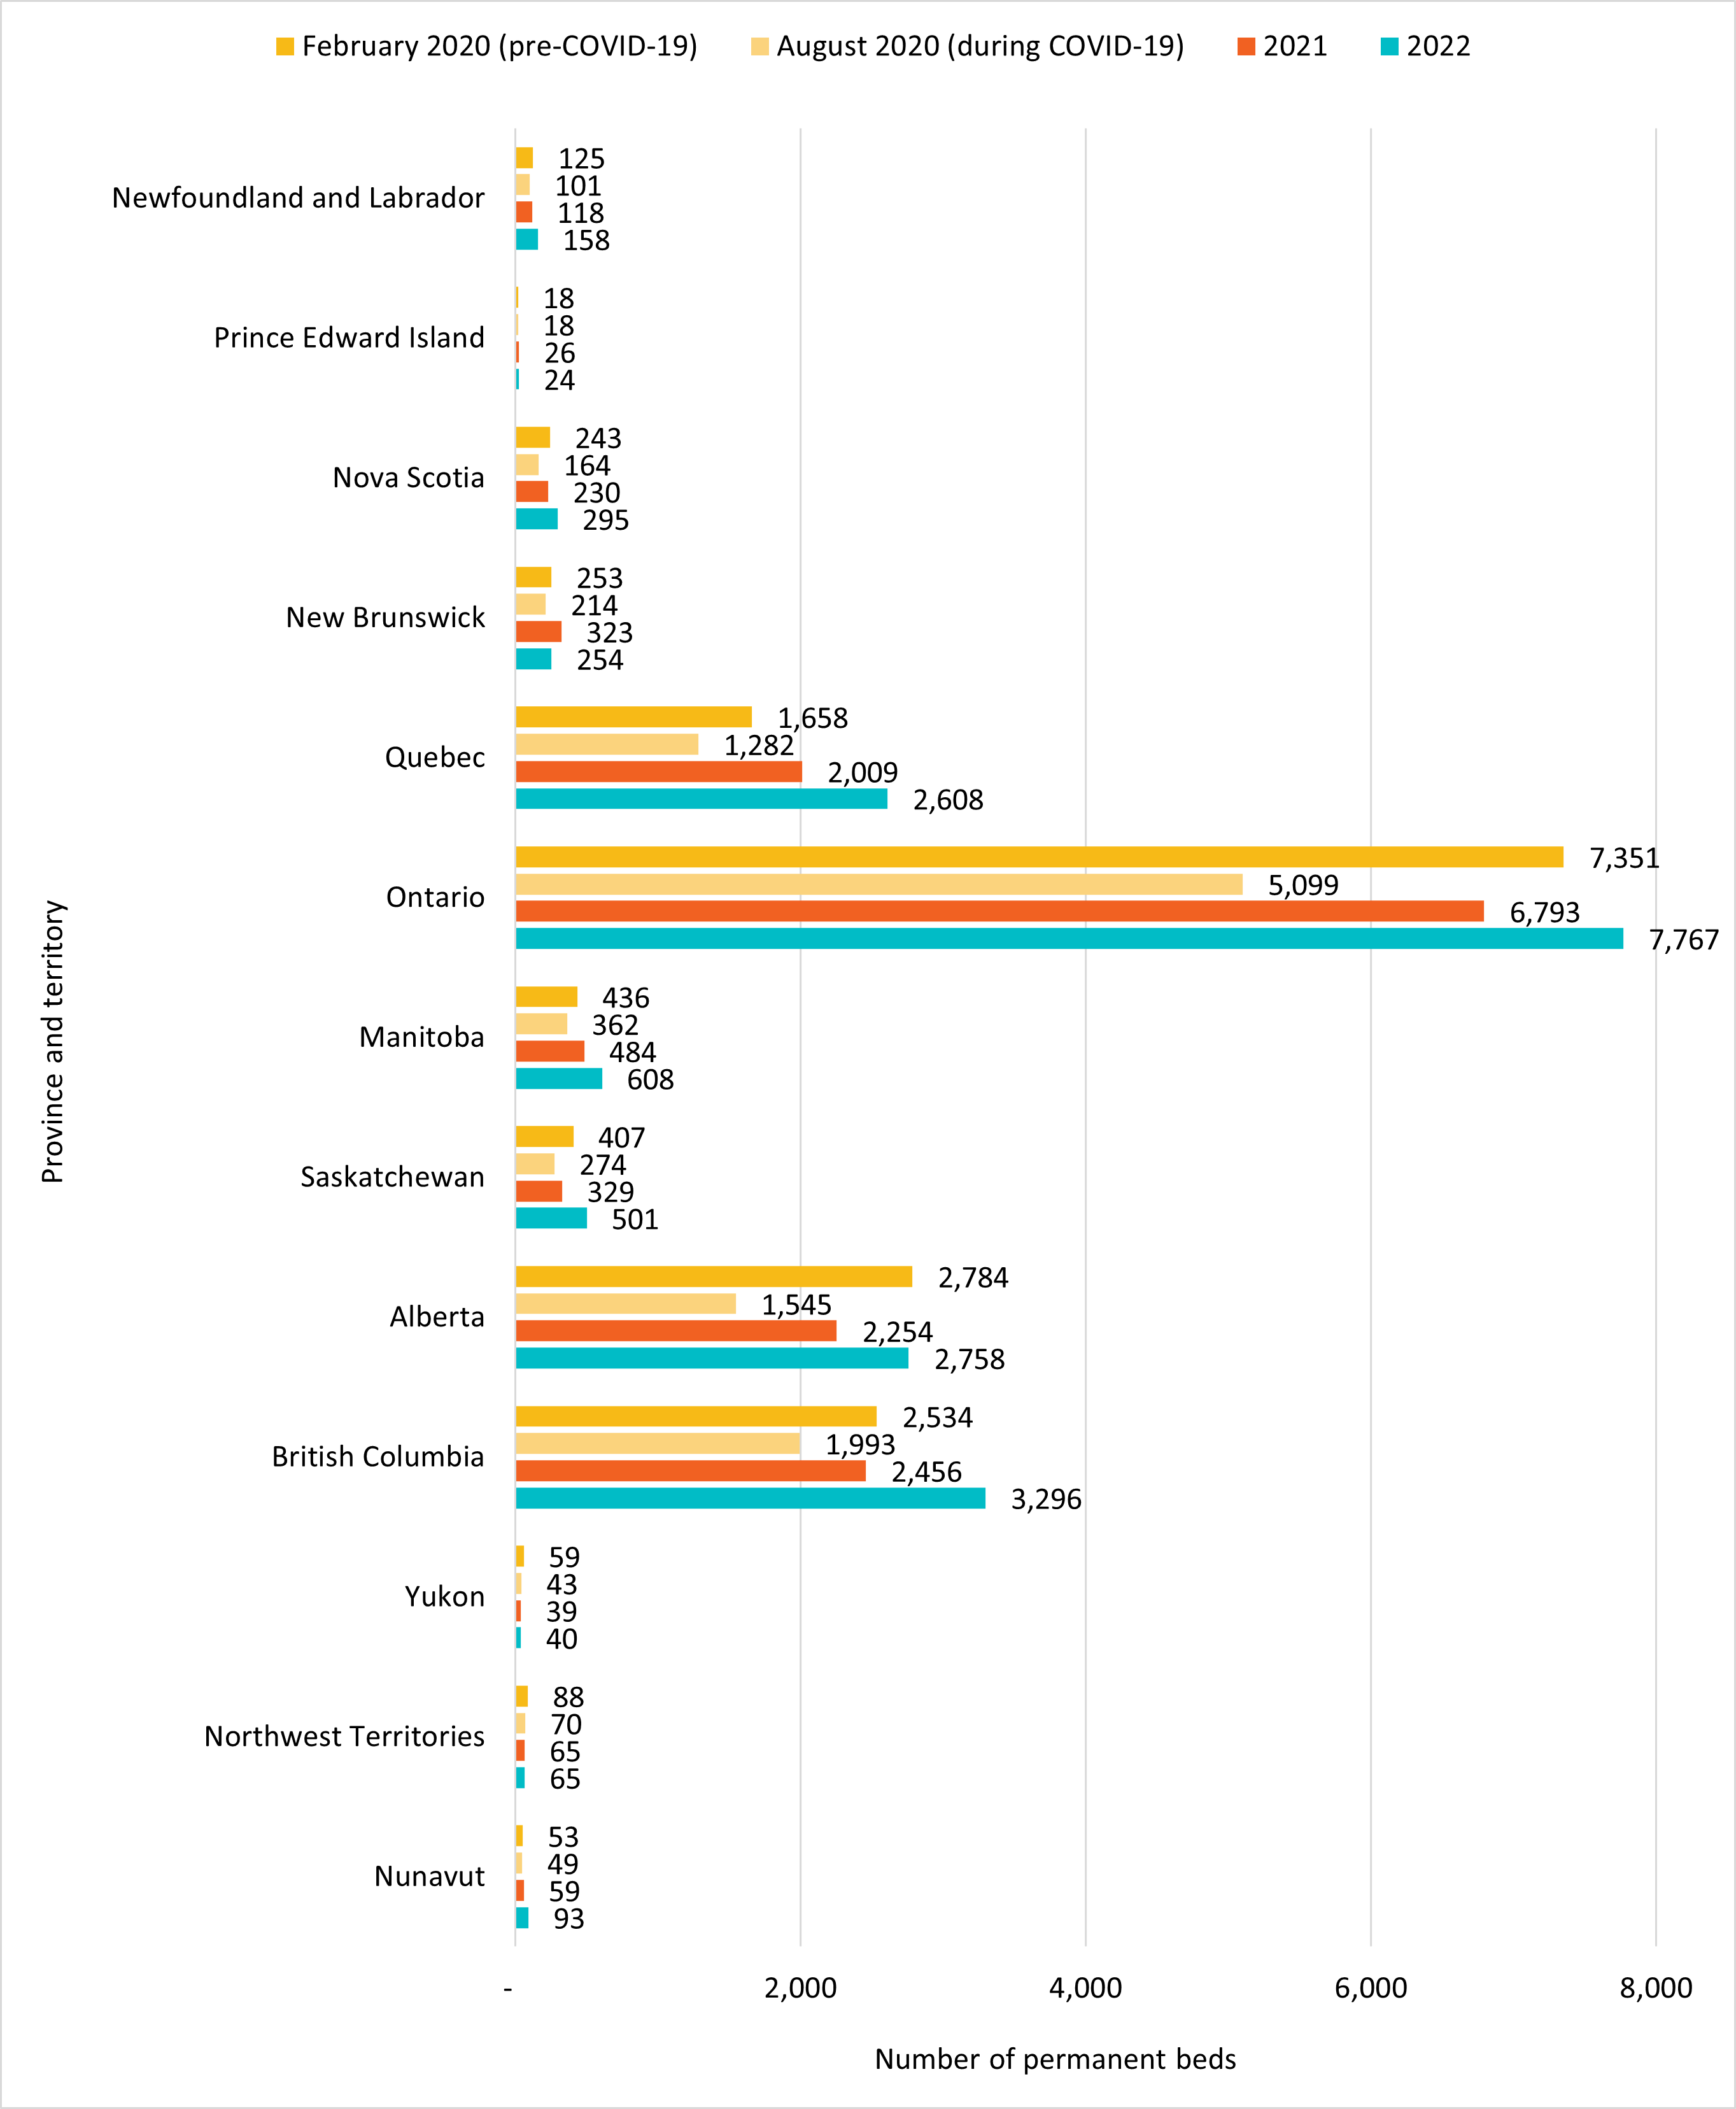
Figure 4 demonstrates provincial permanent bed capacity changes between 2020 and 2022. Results show that by the end of 2021, some jurisdictions including Nunavut, Prince Edward Island, New Brunswick, Manitoba, and Quebec had more emergency shelter beds than before the pandemic. This showed a gradual stabilization of bed capacity from the effects of the COVID-19 pandemic. Results by the end of 2022 showed that shelter capacity recovered or surpassed pre-pandemic capacity in almost every province and territory.
Figure 4: Impact of COVID-19 - Number of emergency beds by province and territory from 2020 to 2022
-
Figure 4 - Text version
Province and territory
February 2020 (pre-COVID-19)
August 2020 (during COVID-19)
2021
2022
Newfoundland and Labrador
125
101
118
158
Prince Edward Island
18
18
26
24
Nova Scotia
243
164
230
295
New Brunswick
253
214
323
254
Quebec
1,658
1,282
2,009
2,608
Ontario
7,351
5,099
6,793
7,767
Manitoba
436
362
484
608
Saskatchewan
407
274
329
501
Alberta
2,784
1,545
2,254
2,758
British Columbia
2,534
1,993
2,456
3,296
Yukon
59
43
39
40
Northwest Territories
88
70
65
65
Nunavut
53
49
59
93
Emergency shelter capacity per 10,000 population from 2020 to 2022
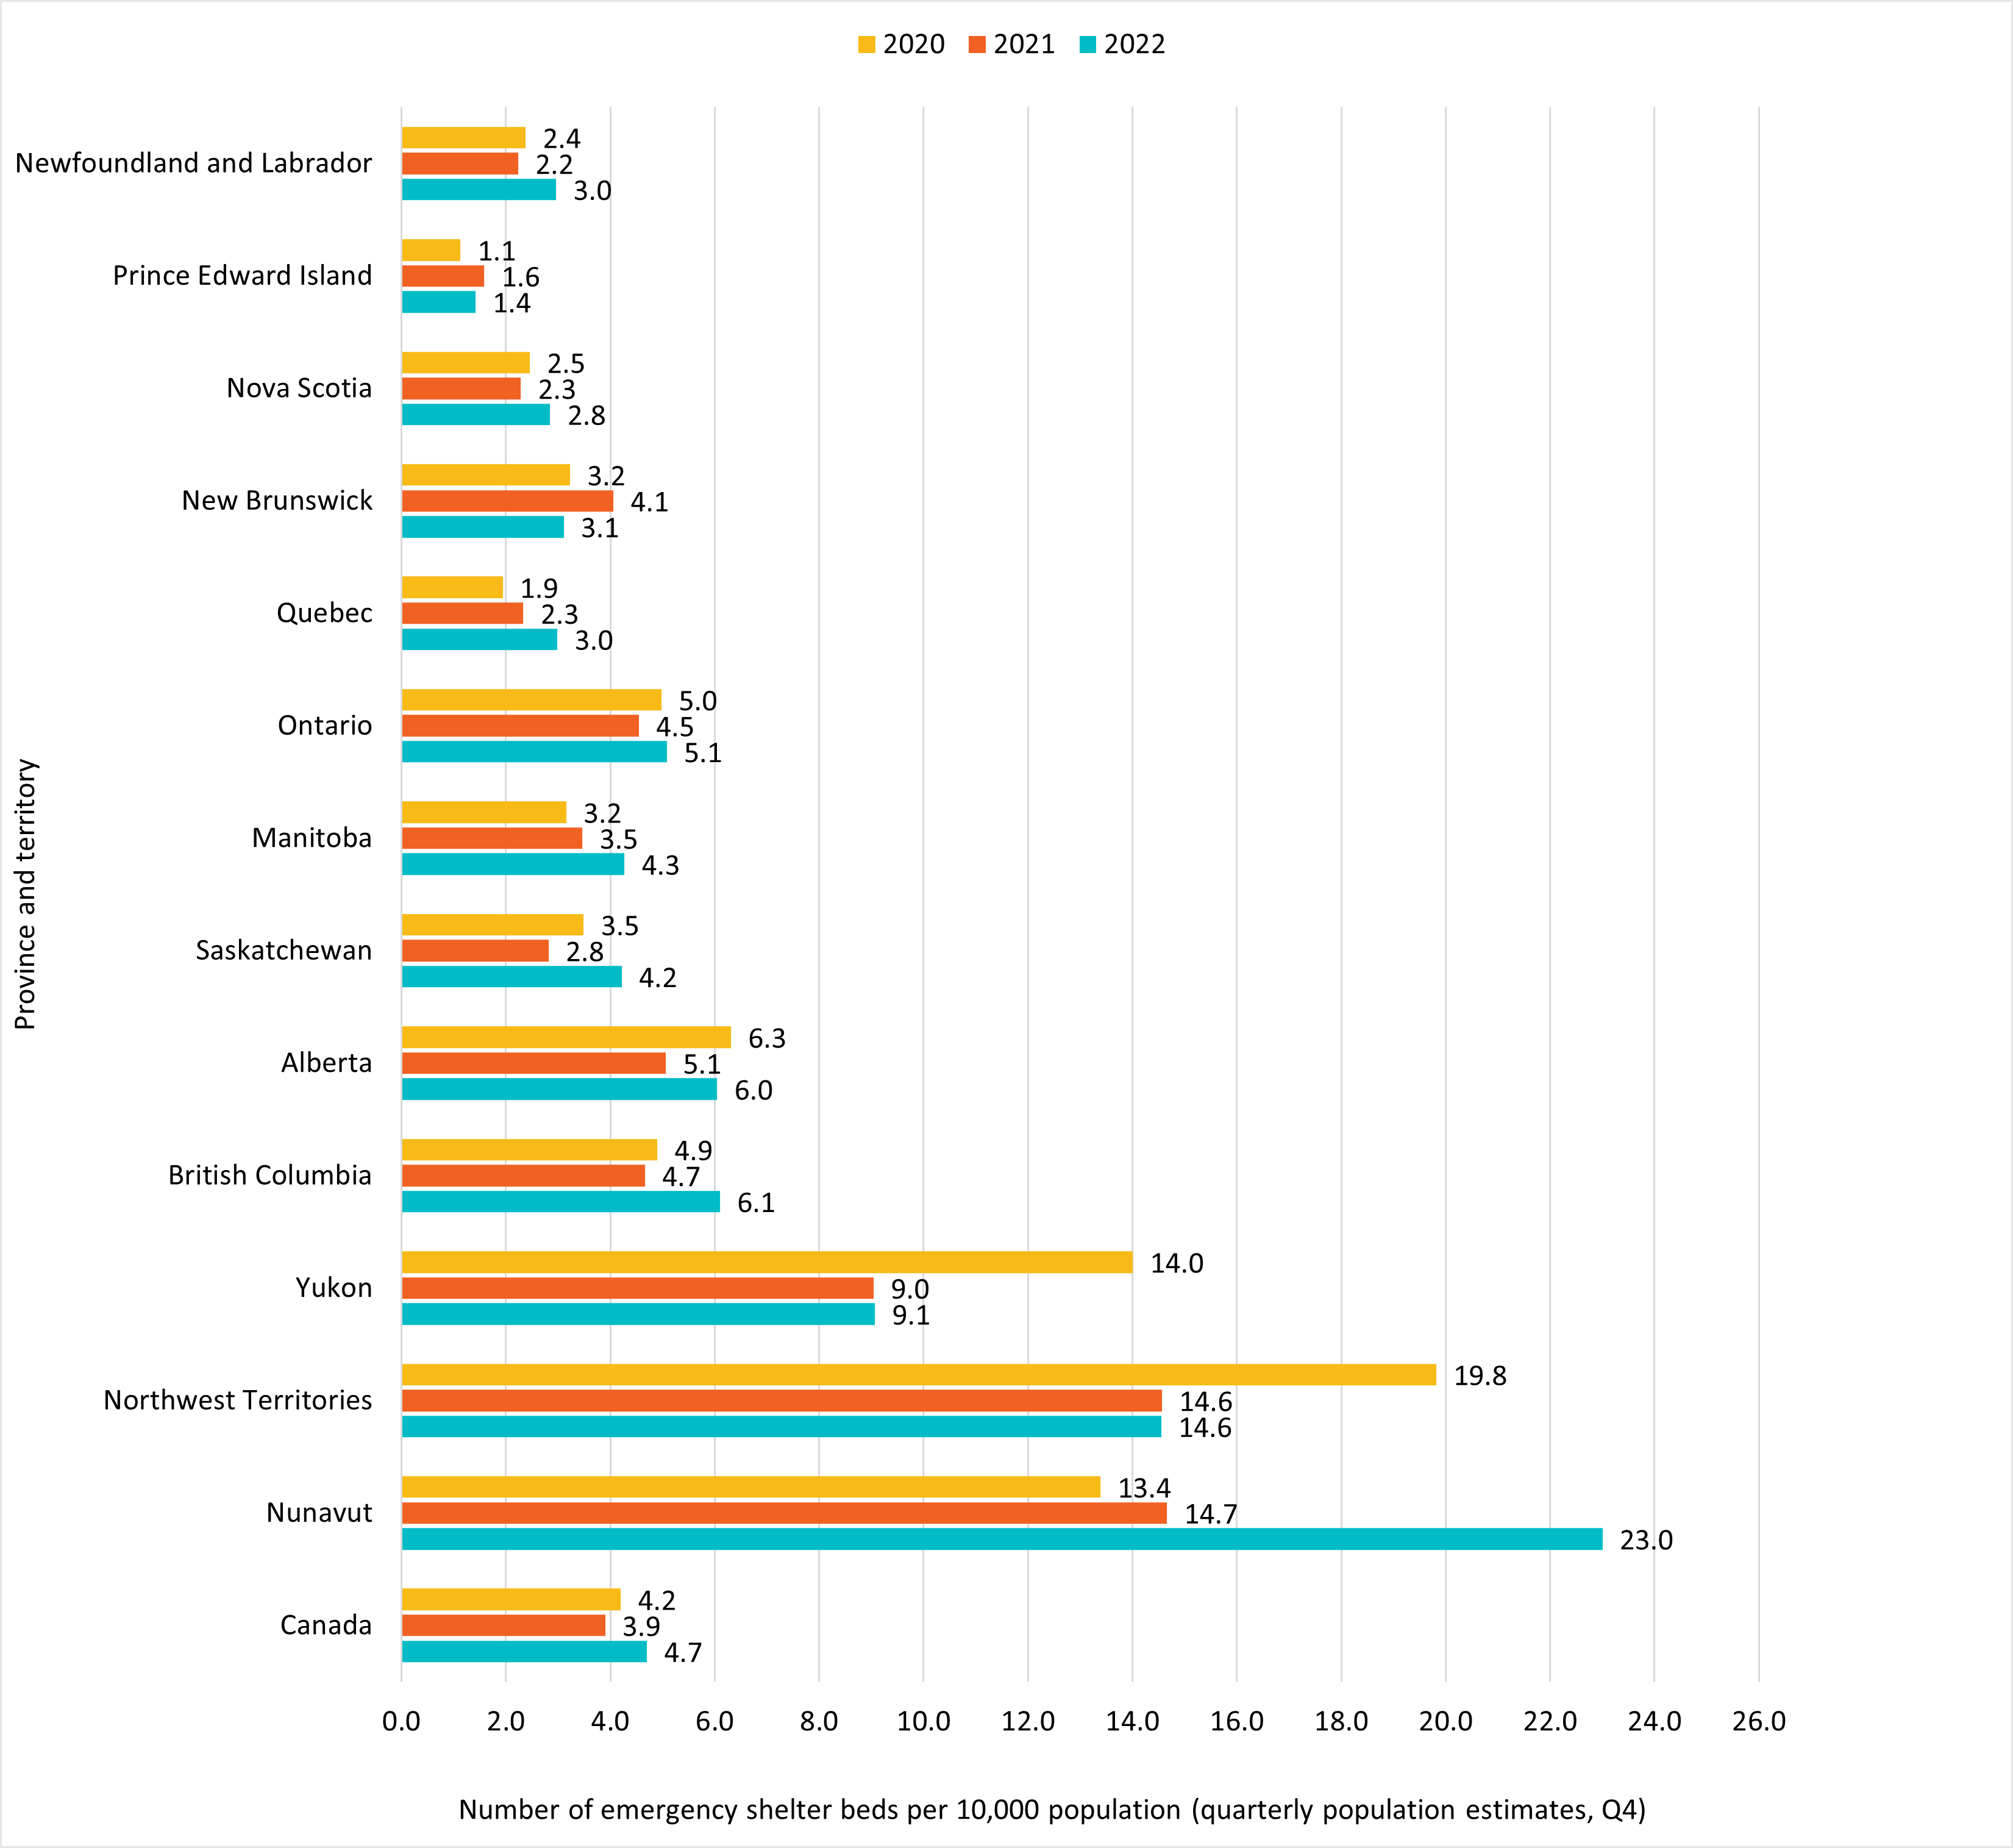
While bed counts are a measure of total capacity within each province and territory, per capita counts are an indicator of relative demand for shelter in each region. This rate can change over time as bed numbers and population numbers fluctuate. In Figure 5, the number of emergency shelter beds per 10,000 population (as measured by using Q4 population estimates) is provided by province and territory.
The number of emergency shelter beds per 10,000 people in Canada increased by 20.5% from 3.9 in 2021 to 4.7 in 2022. This increase in shelter beds per capita may demonstrate efforts to address an increased demand for shelter capacity.
Figure 5: Number of emergency shelter beds per 10,000 population by province and territory from 2020 to 2022
-
Figure 5 - Text version
Province and territory
2020 (with population estimates Q4 2020)
2021 (with population estimates Q4 2021)
2022 (with population estimates Q4 2022)
Newfoundland and Labrador
2.4
2.2
3.0
Prince Edward Island
1.1
1.6
1.4
Nova Scotia
2.5
2.3
2.8
New Brunswick
3.2
4.1
3.1
Quebec
1.9
2.3
3.0
Ontario
5.0
4.5
5.1
Manitoba
3.2
3.5
4.3
Saskatchewan
3.5
2.8
4.2
Alberta
6.3
5.1
6.0
British Columbia
4.9
4.7
6.1
Yukon
14.0
9.0
9.1
Northwest Territories
19.8
14.6
14.6
Nunavut
13.4
14.7
23.0
Canada
4.2
3.9
4.7
Distribution of emergency shelters and beds by community size in 2022
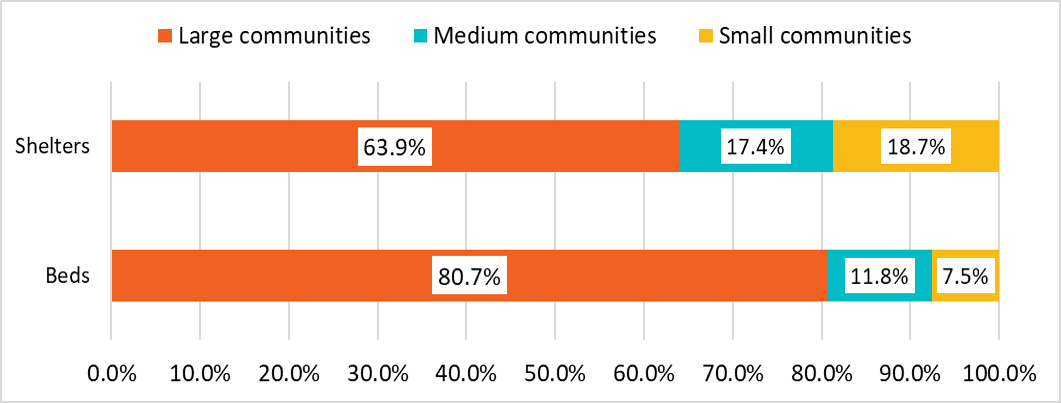
There were 78 communitiesFootnote7 across Canada that had one or more permanent emergency shelters in 2022. Of all permanent emergency beds (18,467), large communities held 80.7%, medium communities 11.8%, and small/rural communities 7.5%.
Although the majority of beds are in large communities, smaller communities have a higher rate of beds per population. In large communities this rate is 6.7 per 10,000 people, whereas it is 9.1 in medium communities and 15.3 in small communities. These findings are consistent with the higher availability of beds per capita in regions without large communities, such as Nunavut, Yukon, and the Northwest Territories.
The proportion of permanent emergency shelters in medium and small communities compared to their proportion of beds demonstrates that shelters tend to be smaller in these communities, while it is more common to have larger shelters with greater capacity in large/urban centres.
Figure 6: Distribution of emergency shelters and permanent beds by community size in 2022
-
Figure 6 - Text version
Distribution of emergency shelters and beds by community size, 2022
Percentage of all beds
Percentage of all shelters
Large communities
80.7%
63.9%
Medium communities
11.8%
17.4%
Small communities
7.5%
18.7%
Emergency shelter capacity by clientele served in Canada from 2020 to 2022
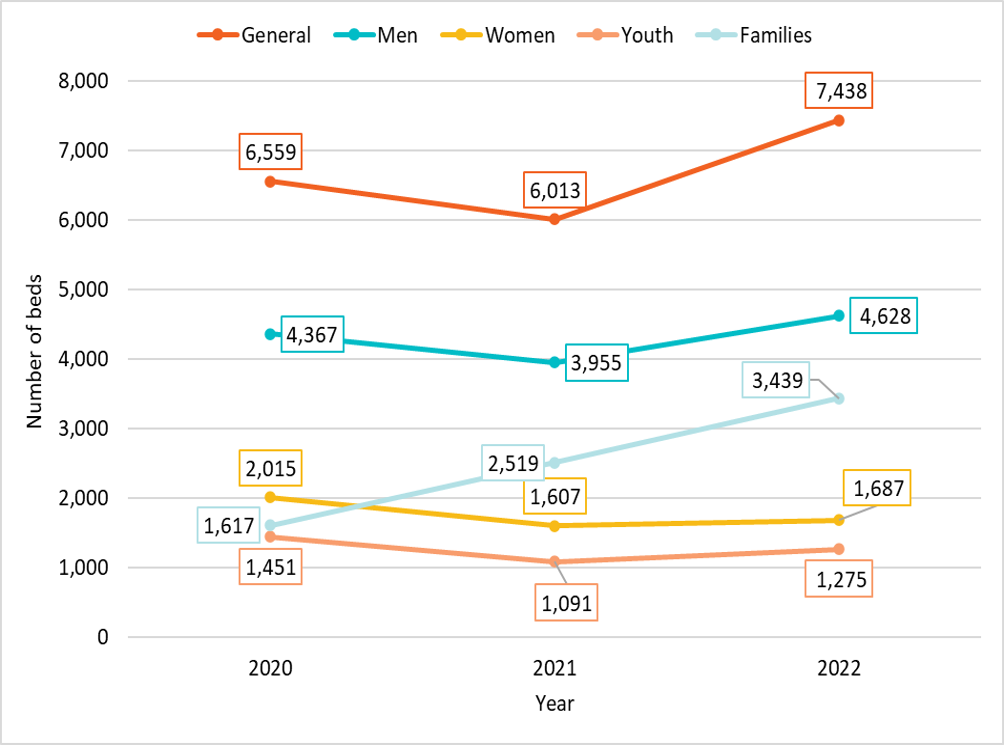
Rates of increase of beds from 2021 to 2022 differed by population served. Data reveals a 24% increase in the number of beds in shelters serving the general adult population, 17% in men’s shelters, 5% in women’s shelters, 17% in youth shelters, and 37% in family shelters. General shelters, as well as those serving men and families, saw a full recovery in bed capacity relative to February 2020, prior to the COVID-19 pandemic.
Figure 7: Number of emergency shelter beds by clientele served from 2020 to 2022
-
Figure 7 - Text version
Clientele served
2020
2021
2022
General
6,559
6,013
7,438
Men
4,367
3,955
4,628
Women
2,015
1,607
1,687
Youth
1,451
1,091
1,275
Families
1,617
2,519
3,439
Emergency shelter capacity by clientele served, per province and territory in 2022
In 2022, beds serving the general adult population (all genders) accounted for 40% of all beds across Canada. General beds in Newfoundland and Labrador, Nova Scotia, and Saskatchewan saw an increase of over 50% from 2021. General beds in New Brunswick decreased by 55%, while Ontario and Quebec saw increases of 410 and 256 general beds respectively.
In 2022, Ontario held the largest number of men’s beds compared to other provinces and territories; men’s beds accounted for over 40% of total beds in both New Brunswick and Prince Edward Island, and for over 70% in Northwest Territories and Nunavut.
Family shelters in 2022 increased by more than 40% from 2021 in Quebec, Alberta, and British Columbia. Notably, Saskatchewan saw a significant decrease of 46% in family beds. This is aligned with a notable increase in the number of women’s beds, where shelters may classify themselves as women’s shelters more often than serving female-only families.
Of all beds in 2022, women’s beds made up only 9%, where Ontario had the largest number and Prince Edward Island had the largest proportion (33%). Beds serving youth accounted for 7% of all beds in 2022.
| Province and territory | General shelters | General beds | Men's shelters | Men's beds | Women's shelters | Women's beds | Youth shelters | Youth beds | Family shelters | Family beds | Total shelters | Total beds |
|---|---|---|---|---|---|---|---|---|---|---|---|---|
| Newfoundland and Labrador | 13 |
135 |
0 |
0 |
0 |
0 |
3 |
20 |
1 |
3 |
17 |
158 |
| Prince Edward Island | 0 |
0 |
1 |
10 |
1 |
8 |
0 |
0 |
1 |
6 |
3 |
24 |
| Nova Scotia | 6 |
148 |
3 |
79 |
2 |
34 |
2 |
28 |
1 |
6 |
14 |
295 |
| New Brunswick | 4 |
111 |
3 |
102 |
3 |
35 |
1 |
6 |
0 |
0 |
11 |
254 |
| Quebec | 47 |
1,086 |
14 |
751 |
12 |
252 |
22 |
216 |
17 |
303 |
112 |
2,608 |
| Ontario | 37 |
1,675 |
45 |
2,335 |
29 |
947 |
32 |
576 |
30 |
2,234 |
173 |
7,767 |
| Manitoba | 9 |
420 |
1 |
75 |
0 |
0 |
3 |
30 |
2 |
83 |
15 |
608 |
| Saskatchewan | 1 |
106 |
5 |
145 |
3 |
58 |
13 |
135 |
3 |
57 |
25 |
501 |
| Alberta | 15 |
1,818 |
3 |
510 |
3 |
192 |
7 |
77 |
5 |
161 |
33 |
2,758 |
| British Columbia | 52 |
1,915 |
12 |
496 |
5 |
151 |
15 |
160 |
19 |
574 |
103 |
3,296 |
| Yukon | 1 |
24 |
1 |
5 |
0 |
0 |
1 |
11 |
0 |
0 |
3 |
40 |
| Northwest Territories | 0 |
0 |
1 |
49 |
1 |
10 |
1 |
6 |
0 |
0 |
3 |
65 |
| Nunavut | 0 |
0 |
4 |
71 |
0 |
0 |
1 |
10 |
1 |
12 |
6 |
93 |
| Canada | 185 |
7,438 |
93 |
4,628 |
59 |
1,687 |
101 |
1,275 |
80 |
3,439 |
518 |
18,467 |
Annex A: Transitional housing capacity by province and territory from 2020 to 2022
There was a 46.4% increase in the number of transitional beds from 2021, along with an increase in the number of transitional shelters of 33.2%. With the exception of Prince Edward Island and the Territories, all provinces showed increases, ranging from 25% to 223%. Transitional capacity in the Territories remained relatively stable.
| Province and territory | Shelters | Beds | ||||
|---|---|---|---|---|---|---|
| 2020 | 2021 | 2022 | 2020 | 2021 | 2022 | |
| Newfoundland and Labrador | 4 |
4 |
8 |
32 |
32 |
72 |
| Prince Edward Island | 0 |
1 |
1 |
0 |
9 |
4 |
| Nova Scotia | 10 |
12 |
22 |
125 |
148 |
286 |
| New Brunswick | 7 |
13 |
14 |
48 |
66 |
128 |
| Quebec | 116 |
153 |
198 |
2,358 |
2,796 |
3,841 |
| Ontario | 116 |
149 |
171 |
2,128 |
2,764 |
3,642 |
| Manitoba | 11 |
16 |
24 |
441 |
297 |
504 |
| Saskatchewan | 20 |
22 |
49 |
235 |
244 |
789 |
| Alberta | 38 |
35 |
39 |
1,108 |
711 |
887 |
| British Columbia | 41 |
43 |
71 |
1,179 |
1,017 |
1,695 |
| Yukon | 2 |
0 |
1 |
4 |
0 |
1 |
| Northwest Territories | 5 |
4 |
3 |
97 |
66 |
60 |
| Nunavut | 0 |
0 |
1 |
0 |
0 |
26 |
| Canada | 370 |
452 |
602 |
7,755 |
8,150 |
11,935 |
Annex B: Transitional housing capacity by clientele served, per province and territory in 2022
In 2022, 40% of beds in transitional housing facilities served the general adult population, corresponding to an 80% increase from 2021. Men’s beds accounted for 20% of total beds. Notably, the number of beds serving families increased by 74% from 2021. Family transitional beds in Saskatchewan made up 42% of the provincial total, 31% in Nova Scotia, and only 6% for Ontario.
| Province and territory | General shelters | General beds | Men's shelters | Men's beds | Women's shelters | Women's beds | Youth shelters | Youth beds | Family shelters | Family beds | Total shelters | Total beds |
|---|---|---|---|---|---|---|---|---|---|---|---|---|
| Newfoundland and Labrador | 1 |
4 |
0 |
0 |
0 |
0 |
5 |
54 |
2 |
14 |
8 |
72 |
| Prince Edward Island | 0 |
0 |
0 |
0 |
0 |
0 |
0 |
0 |
1 |
4 |
1 |
4 |
| Nova Scotia | 5 |
40 |
2 |
26 |
4 |
44 |
6 |
86 |
5 |
90 |
22 |
286 |
| New Brunswick | 6 |
59 |
1 |
10 |
1 |
12 |
5 |
37 |
1 |
10 |
14 |
128 |
| Quebec | 63 |
1,339 |
23 |
771 |
9 |
106 |
40 |
483 |
63 |
1,142 |
198 |
3,841 |
| Ontario | 49 |
1,443 |
32 |
901 |
22 |
345 |
54 |
735 |
14 |
218 |
171 |
3,642 |
| Manitoba | 14 |
364 |
4 |
70 |
1 |
8 |
2 |
30 |
3 |
32 |
24 |
504 |
| Saskatchewan | 5 |
130 |
6 |
74 |
5 |
74 |
16 |
180 |
17 |
331 |
49 |
789 |
| Alberta | 8 |
169 |
6 |
381 |
2 |
100 |
17 |
157 |
6 |
80 |
39 |
887 |
| British Columbia | 38 |
1,192 |
6 |
161 |
4 |
47 |
16 |
156 |
7 |
139 |
71 |
1,695 |
| Yukon | 0 |
0 |
1 |
1 |
0 |
0 |
0 |
0 |
0 |
0 |
1 |
1 |
| Northwest Territories | 0 |
0 |
1 |
32 |
0 |
0 |
1 |
10 |
1 |
18 |
3 |
60 |
| Nunavut | 0 |
0 |
1 |
26 |
0 |
0 |
0 |
0 |
0 |
0 |
1 |
26 |
| Canada | 189 |
4,740 |
83 |
2,453 |
48 |
736 |
162 |
1,928 |
120 |
2,078 |
602 |
11,935 |
Annex C: Domestic violence shelter capacity by province and territory from 2020 to 2022
There was a 1.2% increase in domestic violence shelter beds from 2021, despite a 1.1% decrease in the number of domestic violence shelters. This is a modest increase compared to the 9% increase from 2020 to 2021. Of note, given that the majority (92%) of domestic violence shelters serve families, bed capacity may vary based on the diverse composition of families seeking shelter. Infrastructure Canada considers capacity for parents and children encompassing provisions such as cribs. Notably, capacity is configured to account for shared usage; for instance, a bed capable of accommodating three members of the same family is tallied as three beds, in an effort to accurately reflect the shelter's capacity to meet the needs of diverse family units.
| Province and territory | Shelters | Beds | ||||
|---|---|---|---|---|---|---|
| 2020 | 2021 | 2022 | 2020 | 2021 | 2022 | |
| Newfoundland and Labrador | 14 |
20 |
18 |
191 |
187 |
163 |
| Prince Edward Island | 3 |
3 |
2 |
43 |
43 |
30 |
| Nova Scotia | 16 |
23 |
20 |
242 |
309 |
285 |
| New Brunswick | 18 |
20 |
19 |
303 |
283 |
287 |
| Quebec | 104 |
138 |
129 |
1,466 |
1,776 |
1,757 |
| Ontario | 134 |
159 |
150 |
2,629 |
2,896 |
2,970 |
| Manitoba | 19 |
20 |
23 |
414 |
353 |
366 |
| Saskatchewan | 16 |
17 |
17 |
277 |
322 |
338 |
| Alberta | 52 |
57 |
57 |
1,329 |
1,297 |
1,334 |
| British Columbia | 109 |
141 |
155 |
1,329 |
1,601 |
1,583 |
| Yukon | 8 |
6 |
6 |
101 |
65 |
108 |
| Northwest Territories | 6 |
5 |
5 |
44 |
34 |
38 |
| Nunavut | 4 |
3 |
4 |
41 |
31 |
52 |
| Canada | 503 |
612 |
605 |
8,409 |
9,197 |
9,311 |
Annex D: Domestic violence shelter capacity by clientele served, per province and territory in 2022
In 2022, 92% of beds in domestic violence shelters served families, a decrease from 98% in 2021. This can be explained by an increase in the number of those serving the general adult population and those serving adult women only.
| Province and territory | General shelters | General beds | Men's shelters | Men's beds | Women's shelters | Women's beds | Youth shelters | Youth beds | Family shelters | Family beds | Total shelters | Total beds |
|---|---|---|---|---|---|---|---|---|---|---|---|---|
| Newfoundland and Labrador | 0 |
0 |
0 |
0 |
1 |
9 |
0 |
0 |
17 |
154 |
18 |
163 |
| Prince Edward Island | 0 |
0 |
0 |
0 |
0 |
0 |
0 |
0 |
2 |
30 |
2 |
30 |
| Nova Scotia | 0 |
0 |
0 |
0 |
3 |
40 |
0 |
0 |
17 |
245 |
20 |
285 |
| New Brunswick | 0 |
0 |
0 |
0 |
2 |
18 |
0 |
0 |
17 |
269 |
19 |
287 |
| Quebec | 2 |
27 |
2 |
9 |
2 |
22 |
1 |
2 |
122 |
1,697 |
129 |
1,757 |
| Ontario | 3 |
21 |
1 |
2 |
28 |
494 |
3 |
50 |
115 |
2,403 |
150 |
2,970 |
| Manitoba | 0 |
0 |
0 |
0 |
0 |
0 |
0 |
0 |
23 |
366 |
23 |
366 |
| Saskatchewan | 0 |
0 |
0 |
0 |
0 |
0 |
0 |
0 |
17 |
338 |
17 |
338 |
| Alberta | 3 |
44 |
0 |
0 |
0 |
0 |
0 |
0 |
54 |
1,290 |
57 |
1,334 |
| British Columbia | 1 |
15 |
1 |
8 |
2 |
32 |
0 |
0 |
151 |
1,528 |
155 |
1,583 |
| Yukon | 0 |
0 |
0 |
0 |
0 |
0 |
0 |
0 |
6 |
108 |
6 |
108 |
| Northwest Territories | 0 |
0 |
0 |
0 |
0 |
0 |
0 |
0 |
5 |
38 |
5 |
38 |
| Nunavut | 0 |
0 |
0 |
0 |
0 |
0 |
0 |
0 |
4 |
52 |
4 |
52 |
| Canada | 9 |
107 |
4 |
19 |
38 |
615 |
4 |
52 |
550 |
8,518 |
605 |
9,311 |
Annex E: Shelter capacity changes from 2021 to 2022, by province and territory
The tables below indicate the number of year-round beds available in emergency shelter, transitional housing and domestic violence shelters in 2021 and 2022, and the associated year-over year percentage change in capacity.
| Province and territory | Emergency shelter beds | ||
|---|---|---|---|
| 2021 | 2022 | Percentage change | |
| Newfoundland and Labrador | 118 |
158 |
33.9% |
| Prince Edward Island | 26 |
24 |
-7.7% |
| Nova Scotia | 230 |
295 |
28.3% |
| New Brunswick | 323 |
254 |
-21.4% |
| Quebec | 2,009 |
2,608 |
29.8% |
| Ontario | 6,793 |
7,767 |
14.3% |
| Manitoba | 484 |
608 |
25.6% |
| Saskatchewan | 329 |
501 |
52.3% |
| Alberta | 2,254 |
2,758 |
22.4% |
| British Columbia | 2,456 |
3,296 |
34.2% |
| Yukon | 39 |
40 |
2.6% |
| Northwest Territories | 65 |
65 |
0.0% |
| Nunavut | 59 |
93 |
57.6% |
| Canada | 15,185 |
18,467 |
21.6% |
| Province and territory | Transitional housing beds | ||
|---|---|---|---|
| 2021 | 2022 | Percentage change | |
| Newfoundland and Labrador | 32 |
72 |
125.0% |
| Prince Edward Island | 9 |
4 |
-55.6% |
| Nova Scotia | 148 |
286 |
93.2% |
| New Brunswick | 66 |
128 |
93.9% |
| Quebec | 2,796 |
3,841 |
37.4% |
| Ontario | 2,764 |
3,642 |
31.8% |
| Manitoba | 297 |
504 |
69.7% |
| Saskatchewan | 244 |
789 |
223.4% |
| Alberta | 711 |
887 |
24.8% |
| British Columbia | 1,017 |
1,695 |
66.7% |
| Yukon | 0 |
1 |
no beds in 2021 |
| Northwest Territories | 66 |
60 |
-9.1% |
| Nunavut | 0 |
26 |
no beds in 2021 |
| Canada | 8,150 |
11,935 |
46.4% |
| Province and territory | Domestic violence shelter beds | ||
|---|---|---|---|
| 2021 | 2022 | Percentage change | |
| Newfoundland and Labrador | 187 |
163 |
-12.8% |
| Prince Edward Island | 43 |
30 |
-30.2% |
| Nova Scotia | 309 |
285 |
-7.8% |
| New Brunswick | 283 |
287 |
1.4% |
| Quebec | 1,776 |
1,757 |
-1.1% |
| Ontario | 2,896 |
2,970 |
2.6% |
| Manitoba | 353 |
366 |
3.7% |
| Saskatchewan | 322 |
338 |
5.0% |
| Alberta | 1,297 |
1,334 |
2.9% |
| British Columbia | 1,601 |
1,583 |
-1.1% |
| Yukon | 65 |
108 |
66.2% |
| Northwest Territories | 34 |
38 |
11.8% |
| Nunavut | 31 |
52 |
67.7% |
| Canada | 9,197 |
9,311 |
1.2% |
Key Findings
- In 2022, there were 18,467 permanent emergency shelter beds across 518 shelters, representing an increase of 21.6% from 2021 (15,185). These numbers also exceed pre-pandemic emergency shelter capacity from February 2020 (16,009) by 15.5% and demonstrate a full national recovery from the impact of the pandemic.
- Of all 13 provinces and territories, increases in shelter capacity from 2021 were found in 10, while 3 showed decreases or no changes.
- The number of emergency shelter beds per 10,000 people in Canada increased from 3.9 in 2021 to 4.7 in 2022.
- The increase in beds across Canada from 2021 to 2022 is the result of a 24% increase in general beds, 17% in men’s beds, 5% in women’s beds, 17% in youth beds, and a 37% increase in family beds.
- Most beds and shelters were found in large (urban) communities (80.7%). Medium and small (rural) communities tend to have numerous smaller shelters, while large communities tend to have shelters with larger capacity.
- An increase in capacity was also found for transitional housing beds (increase of 46.4%), while the capacity of domestic violence shelters remained relatively stable (increase of 1.2%).
Appendix A: Glossary
- Homelessness
- The living situation of an individual or family who does not have stable, permanent, appropriate housing, or the immediate prospect, means and ability of acquiring a home.
- Large population centres
- Communities with a population greater than 100,000.
- Medium population centres
- Communities with a population between 30,000 and 99,999.
- Small population centres
- Communities with a population between 1,000 and 29,999.
- Youth shelters
- Provide services to youth. Some serve all genders, others only serve girls/women or boys/men. Shelters have varying definitions of youth, often ranging from 12 to 29 years of age.
- Women's shelters
- Provide services to adults identifying as women. Some also accept girls.
- Men's shelters
- Provide services to adults identifying as men. Some also accept boys.
- General shelters
- Provide services to adults of all genders. Some also accept youth of all genders.
- Family shelters
- Provide services to families and adults with dependents. Some also accept single adult women without dependents.
- Homelessness service providers
- Service provider organizations that provide services to homeless individuals and families, and persons at risk of homelessness.
- Emergency shelters
- Permanent facilities that provide temporary, short-term accommodation (typically less than 3 months in duration) for homeless individuals and families. There is no cost to service users and no referral or entry application is necessary to access the service. Counselling, treatment and other support services including food and clothing may be available to the people who access the service, but participation is not mandatory. Often, only a place to sleep is provided.
- Transitional Housing
- Permanent facilities that provide temporary, longer-term accommodation for individuals and/or families experiencing homelessness or at risk of homelessness. Transitional housing is typically an intermediate step between emergency shelter and permanent housing. They differ from emergency shelters by allowing a longer length of stay and greater intensity of support services. For example, programming could focus on developing the necessary skills to be able to live more independently. Stays typically last between 3 months and 3 years.
- Domestic violence shelter
- Permanent facilities that provide temporary accommodation that offer support for individuals and/or families fleeing domestic abuse or the threat of violence, either as a crisis capacity (typically less than three months) or as transitional/second stage housing. Second stage housing refers to facilities that offer longer stays and greater intensity of services, providing an intermediate step before permanent housing. Stays are typically between three months and three years.
For more information
To find out more about homelessness research, visit the Data analysis, reports and publications page.
If you have any questions about this report, contact us.
References
Statistics Canada. (2023). “Population estimates, quarterly” Q4 2022, 2021, and 2020. Statistics Canada Catalogue no. 17-10-0009-01. Ottawa, Ontario. September 27. Retrieved from: Table 17-10-0009-01 Population estimates, quarterly
Statistics Canada. (2022). “Population and dwelling counts: Canada and population centres” 2021 Census. Statistics Canada Catalogue no. 98-10-0011-01. Ottawa, Ontario. February 9. Retrieved from: Table 98-10-0011-01 Population and dwelling counts: Canada and population centres
Statistics Canada. (2022). "Population and dwelling counts: Canada, provinces and territories” 2021 Census. Statistics Canada Catalogue no. 98-10-0001-01. Ottawa, Ontario. February 9. Retrieved from: Table 98-10-0001-01 Population and dwelling counts: Canada, provinces and territories
Copyright
© 2023 HIS MAJESTY THE KING IN RIGHT OF CANADA as represented by the Minister of Housing, Infrastructure and Communities.
Catalogue No. Em9-3E-PDF 1925-718X
Report a problem on this page
- Date modified: