Homelessness data snapshot: Analysis of the inflow of shelter users in Canada 2018 – 2022
On this page
- Introduction
- Data and methods
- Research findings
- Year-over-year and quarterly analysis of inflow from 2018 to 2022
- Inflow and chronic homelessness
- Stay length analysis
- Demographic analysis
- Key findings
- For more information
- Annex
Introduction
This analysis outlines the inflow of shelter users in the emergency shelter system in Canada between 2018 and 2022. Inflow is the rate at which people are entering into the shelter system for the first time. This analysis provides insight into how inflow influenced trends of shelter use over this period. It can help measure progress in the goal of reducing homelessness and provide insights on how to work upstream to prevent it.
The analysis also examines chronic homelessness among newly and previously identified shelter users, as well as differences in stay length.
Data and methods
The study period for this analysis was between January 1st, 2018 and December 31st, 2022.
Inflow was calculated using data from a subset of communities that had complete coverageFootnote 1 of their permanent emergency shelter system for three consecutive years. The data were collected by service providers using the Homeless Individuals and Families Information System (HIFIS) and through data-sharing partnerships with jurisdictions that use alternative Homelessness Information Management systems.
The 2022 dataset of communities with complete data coverage included 47,098 unique individuals in 17 communities across 316 shelters, representing 37.7% of the national emergency shelter capacity. While this sample represented a significant portion of shelter user experiences, there may be some regional trends that are not captured. Since these results do not include shelter stays outside of the selected communities, shelter users within this dataset that have accessed shelters in other communities will not have those experiences reflected in the results. A list of the communities included in the analysis is provided in the Annex below for reference.
To determine inflow, a shelter user was either newly or previously identified in the shelter system:
- Previously identified: A shelter user was considered to be previously identified in the shelter system if they had stays prior to 2022 within the study period.
- Newly identified: A shelter user was considered newly identified in the shelter system if their first stay in shelter within the study period was in 2022.
To be considered newly identified, a person’s first day in shelter needed to start in 2022. Shelter users who had a stay prior to 2022 would be considered previously identified. If their first stay in shelter overlapped into 2022, they were considered to be previously identified since their stay started prior to 2022.
Research findings
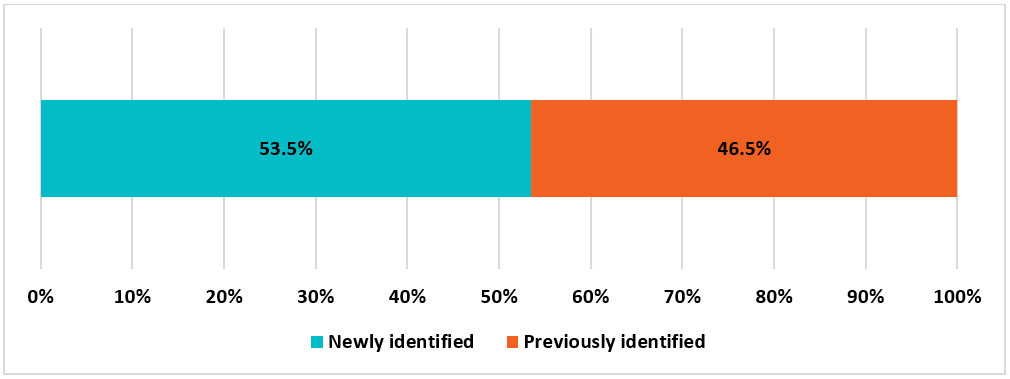
Among the 47,098 unique individuals who accessed a shelter in 2022, 25,216 (53.5%) of them were newly identified in the shelter system.
Figure 1: Inflow in 2022

Figure 1 – Text version
Inflow |
Newly identified |
Previously identified |
|---|---|---|
Proportion |
53.5% |
46.5% |
Year-over-year and quarterly analysis of inflow from 2018 to 2022
Out of the 17 communities that had complete data coverage for 2022, seven of them satisfied the data coverage criteria for 2018 up to 2022. This subset of communities was used to analyze the year-over-year and quarterly trend for inflow.
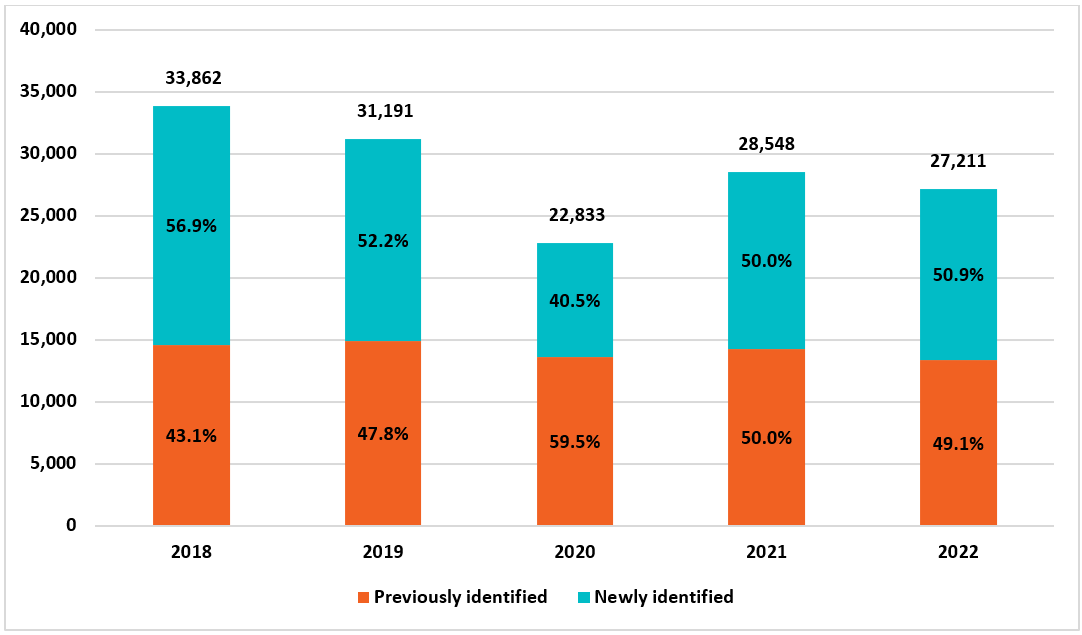
In general, the majority of shelter users were newly identified in the shelter system. However, this was not the case in 2020, where the majority of shelter users were previously identified.
Figure 2: Year-over-year inflow from 2018 to 2022

Figure 2 – Text version
Year |
Newly identified |
Previously identified |
|---|---|---|
2018 |
56.9% |
43.1% |
2019 |
52.2% |
47.8% |
2020 |
40.5% |
59.5% |
2021 |
50.0% |
50.0% |
2022 |
50.9% |
49.1% |
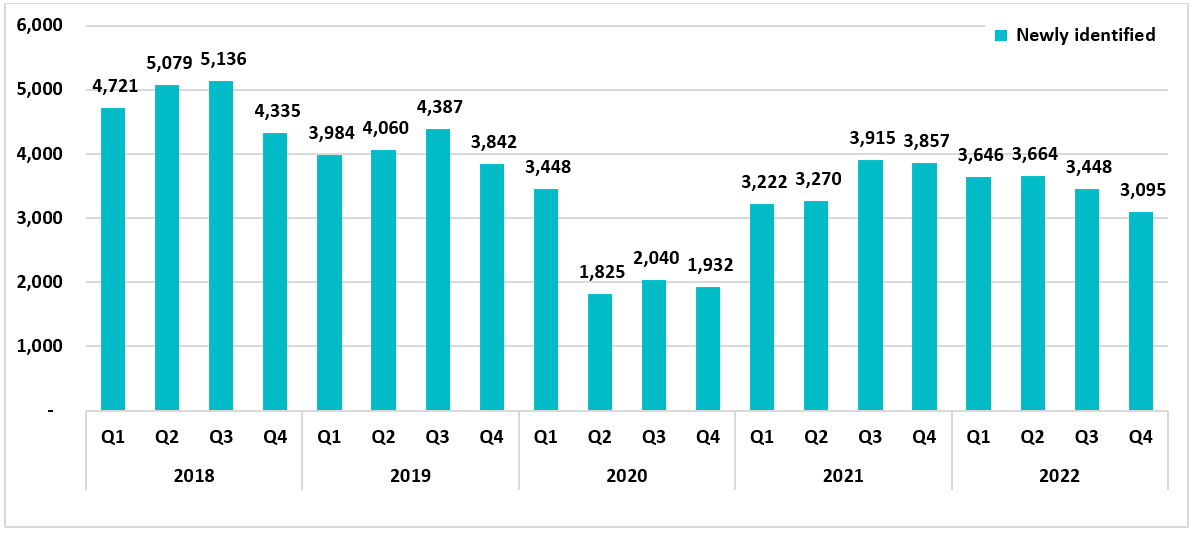
The quarterly breakdown of the year-over-year trend for newly identified shelter users is shown below. There was a substantial drop in the number of newly identified shelter users in the second quarter of 2020, as shelter capacity was reduced due to COVID-19 restrictions throughout the country. Temporary pandemic responses, such as the Canada Emergency Response Benefit (CERB) and eviction moratoria may have further reduced inflow. The number of newly identified shelter users increased back to its pre-pandemic levels in 2021, as emergency shelter capacity recovered and pandemic responses ended.Footnote 2
There appears to be a decreasing trend post-pandemic from the third quarter of 2021 from 3,915 newly identified shelter users to 3,095 newly identified shelter users in the last quarter of 2022.
Overall, the number of newly identified shelter users decreased substantially from 2018 to 2022, with 5,136 newly identified shelter users in the third quarter of 2018 to 3,095 in the last quarter of 2022. In the National Shelter Study 2022 Update , the estimated number of emergency shelter users in the post-pandemic years is also considerably lower compared to pre-pandemic, so this decreasing trend among newly identified shelter users reflects the overall trend among all emergency shelter users.
Figure 3: Quarterly inflow for newly identified shelter users from 2018 to 2022

Figure 3 – Text version
Year |
Quarter |
Newly identified |
|---|---|---|
2018 |
Q1 |
4,721 |
Q2 |
5,079 |
|
Q3 |
5,136 |
|
Q4 |
4,335 |
|
2019 |
Q1 |
3,984 |
Q2 |
4,060 |
|
Q3 |
4,387 |
|
Q4 |
3,842 |
|
2020 |
Q1 |
3,448 |
Q2 |
1,825 |
|
Q3 |
2,040 |
|
Q4 |
1,932 |
|
2021 |
Q1 |
3,222 |
Q2 |
3,270 |
|
Q3 |
3,915 |
|
Q4 |
3,857 |
|
2022 |
Q1 |
3,646 |
Q2 |
3,664 |
|
Q3 |
3,448 |
|
Q4 |
3,095 |
Inflow and chronic homelessness
Emergency shelter users were considered chronically homeless if they met at least one of the following criteria:
- Acute chronicity: used a shelter for six months (180 days) or more in the past year
- Prolonged instability: had shelter stays in each of the last three years
Shelter users were categorized under one of four distinct groups:
- Acute chronicity only,
- Prolonged instability only,
- Combined chronic homelessness (both acute chronicity and prolonged instability), and
- Not chronically homeless.
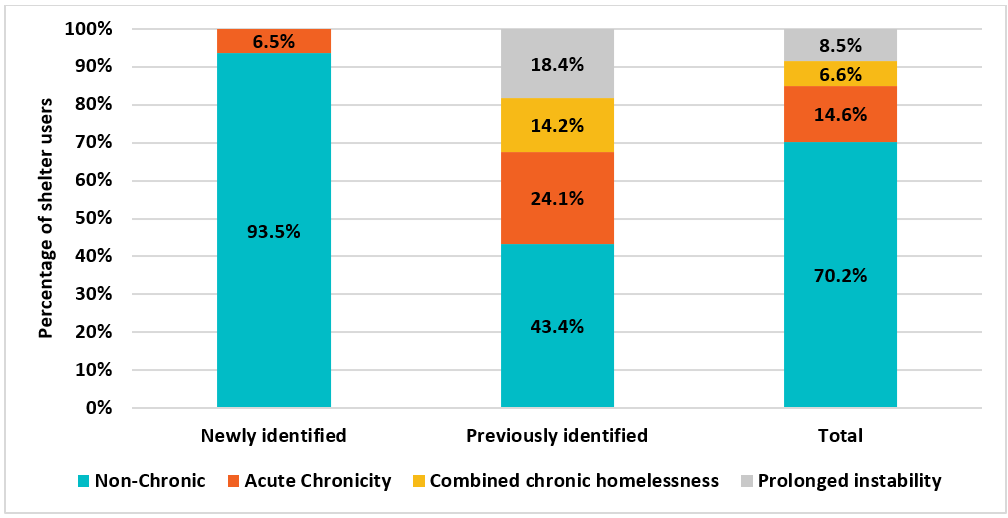
According to Homelessness data snapshot: Analysis of chronic homelessness among shelter users in Canada 2017 to 2021 , the total rate of chronic homelessness among shelter users in 2022 was 29.8%. Among the newly identified shelter users, 6.5% were chronically homeless. In comparison, 56.7% of previously identified shelter users were chronically homeless.
However, since the definition of chronic homelessness is dependent on the length of stay, newly identified shelter users could not meet the criteria for prolonged instability nor combined chronic homelessness. Thus the 6.5% of newly identified shelter users who experienced chronic homelessness fell into the acute chronicity category.
Among the previously identified shelter users, 24.1% of them experienced acute chronicity. 18.4% of them experienced prolonged instability, and 14.2% of them experienced combined chronic homelessness.
Figure 4: Acute chronicity and prolonged instability among newly and previously identified shelter users in 2022

Figure 4 – Text version
Chronic status |
Newly identified |
Previously identified |
Total |
|---|---|---|---|
Non-chronic |
93.5% |
43.4% |
70.2% |
Acute chronicity |
6.5% |
24.1% |
14.6% |
Combined chronic homelessness |
0.0% |
14.2% |
6.6% |
Prolonged instability |
0.0% |
18.4% |
8.5% |
Stay length analysis
Previously identified clients spent significantly more days in shelter on average compared to newly identified clients. Over the course of the study period from 2018 to 2022, the median stay length for each grouping was found:
- Newly identified shelter users: 21 days
- Previously identified shelter users: 202 days
For more details regarding stay length in shelter, please refer to Homelessness Data Snapshot: The National Shelter Study 2022 Update.
Demographic analysis
A demographic analysis of the sample showed similar findings to results from analyses of chronic homelessness, with newly identified shelter users having findings similar to non-chronically homeless shelter users. A table comparing the proportions of newly identified and previously identified shelter users is provided in the Annex below .
For more information regarding shelter use among different demographic groups, please refer to Homelessness data snapshot: Analysis of chronic homelessness among shelter users in Canada 2017 to 2021 and Homelessness Data Snapshot: The National Shelter Study 2022 Update.
Key findings
- In 2022, over half (53.5%) of the shelter users were new to the shelter system.
- A year-over-year analysis from 2018 to 2022 shows that a majority of shelter users were new to the shelter system in most years, except for 2020, where 59.5% of shelter users were previously identified from other years .
- A quarterly breakdown of the year-over-year analysis for newly identified shelter users shows a substantial drop in newly identified shelter users in the second quarter of 2020, while the number increases throughout 2021. There was an overall decreasing trend in the number of newly identified shelter users from 2018 to 2022.
- The substantial drop in newly identified shelter users in 2020 is likely due to pandemic measures during COVID-19 that led to reduced shelter capacity and emergency responses such as CERB and eviction moratoria.
- Among newly identified shelter users, 6.5% experienced chronic homelessness. In particular, they were experiencing acute chronicity only, due to the nature of the definitions of acute chronicity and being newly identified. Among previously identified clients, 24.1% experienced acute chronicity, 18.4% experienced prolonged instability, and 14.2% experienced combined chronic homelessness.
- Previously identified clients spent more time in shelter on average, with a median stay length of 202 days. In comparison, newly identified clients had a median stay length of 21 days.
A summary table (Table 1) with the estimated rates of inflow among the different demographic populations and a list of communities included in this analysis are provided in the Annex.
For more information
Find out more about homelessness research.
If you have any questions about this report, contact us.
Annex
Comparison of rates of inflow within each population
Table 1: Summary of the rates of inflow among specific populations in 2022
|
Proportion among newly identified shelter users |
Proportion among previously identified shelter users |
|---|---|---|
Children (0-16 Accompanied) |
68.1% |
31.9% |
Youth (13-24 Unaccompanied) |
60.4% |
39.6% |
Adults (25-49) |
52.6% |
47.4% |
Older adults (50-64) |
45.6% |
54.4% |
Seniors (65+) |
52.1% |
47.9% |
Men |
52.0% |
48.0% |
Women |
59.2% |
40.8% |
Gender Diverse |
57.3% |
42.7% |
Non-Indigenous |
56.1% |
43.9% |
Indigenous |
50.3% |
49.7% |
Non-veteran |
58.4% |
41.6% |
Veteran |
52.7% |
47.3% |
Canadian citizen |
54.1% |
45.9% |
Permanent Resident/Immigrant |
61.8% |
38.2% |
Refugee/Refugee Claimant |
78.3% |
21.7% |
Visa holders |
84.3% |
15.7% |
List of communities included in the analysis
We would like to thank the communities who provided the quality data that made it possible to complete this analysis.
- Halifax
- Kamloops
- Kelowna
- Moncton
- Nelson
- Niagara Region
- Ottawa
- Peel Region
- Peterborough
- Prince George
- Saint John
- Sault Ste Marie
- Toronto
- Vancouver
- Waterloo Region
- Wellington-Guelph
- York Region
Report a problem on this page
- Date modified:
