Homelessness Data Snapshot: Findings from the 2022 National Survey on Homeless Encampments
On this page
- Introduction
- Background
- Data
- Status of homeless encampments in Canada
- Encampment trends and COVID-19
- Factors contributing to encampment use
- Community responses to encampments
- Resources and barriers
- Successful responses and future strategies
- Key Findings
- For more information
Introduction
Communities across Canada reported an increase in homeless encampments since the beginning of the COVID-19 pandemic. The growth of encampments reflects a complex set of factors associated with the pandemicFootnote 1, including the strain on public healthcare and social services systems, the challenging housing market, the economic contraction in 2020 and subsequent increase in the cost of living, and the persistence of chronic homelessness. The National Shelter Study 2021 updateFootnote 2 and the 2020-2022 Point-in-Time Count preliminary reportFootnote 3 provide additional context on the state of homelessness in Canada during the pandemic.
To better understand the growth of homeless encampments in Canada and community responses, Infrastructure Canada coordinated a National Survey on Homeless Encampments. The Ministry of Health and Social Services coordinated survey distribution and data collection in the province of Quebec.
Background
The National Survey on Homeless Encampments was distributed to representatives from 94 unique communities and regionsFootnote 4. Respondents were asked to provide information on the status of homeless encampments during one month of 2022 (October in the case of Quebec, August for all other provinces and territories), as well as changes since the onset of the COVID-19 pandemic, factors contributing to encampment use, local community responses, the effectiveness of different response strategies, and barriers to successfully addressing homeless encampments.
Data
This report contains findings from the National Survey on Homeless Encampments, including responses from 72 unique communities, representing a 77% response rate. Of these communities, 35 were urban and 37 were rural. Footnote 5, Footnote 6, Footnote 7, Footnote 8 Communities with more than one official representative were invited to work together on a single survey submission or submit responses independent of one another. In total, 75 responses were received, as representatives from three communities chose to submit independent submissions.
Status of homeless encampments in Canada
Nearly all communities (94%, or 68 out of 72 communities) responding to the survey reported having current or historical homeless encampments. The findings in this report reflect responses from 71 survey respondents in 68 communities.
Almost two thirds (61%) of respondents reported regularly tracking information on the number and size of encampments.
In the 37 communities that reported both their estimated homeless population and rates of encampment use, the average estimated proportion of the homeless population staying in encampments was between 14-23%. This is consistent with findings from the 2020-2022 Nationally Coordinated Point-in-Time Count, where 25% of people experiencing homelessness on a given night were enumerated in unsheltered locations, including encampments.Footnote 9
In all 68 communities that reported having homeless encampments, small encampments tended to be most numerous. Almost two thirds (63%) reported having small encampments (2-10 people), about a third (35%) reported having mid-sized encampments (11-49 people), and approximately 10% of communities reported having large encampments (over 50 people). While small encampments were similarly likely to appear in both urban and rural communities, urban communities were over 50% more likely than rural communities to have mid-sized encampments. All large encampments were located in urban communities.
Two thirds (66%) of respondents reported that the majority of encampments were located in relatively urban areas of the community. Of these, 55% reported that the majority of encampments were out of sight of the general public (e.g., on abandoned properties, near waterways) and 45% reported that the majority of encampments were in plain sight of the general public (e.g., in a town square, on a major boulevard). However, other locations were also reported (e.g. rural areas, outskirts of urban areas, private or government-owned property). Almost three quarters (73%) of respondents reported three or more location types where encampments exist in their community.
About two thirds (65%) of respondents reported a decrease in the population size or number of encampments during colder months. Encampment use tended to be more affected by seasonal changes in rural communities, which were more likely to report that decreases during the winter were “significant”.
Encampment trends and COVID-19
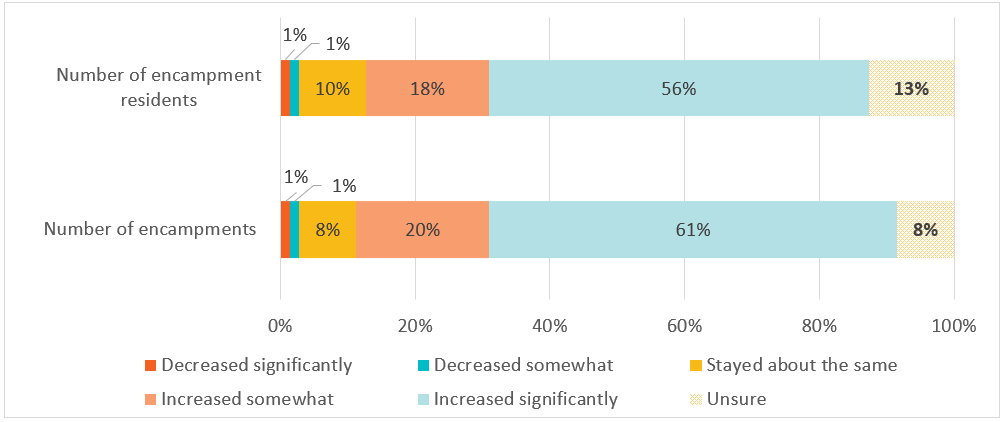
The majority of respondents reported increases in the population size and number of encampments since the beginning of the COVID-19 pandemic (75% and 80%, respectivelyFootnote 10), and 63% of respondents indicated that the population size and/or number of encampments “increased significantly” (Figure 1). The increase was most pronounced in urban communities.
Figure 1. Change since the beginning of the COVID-19 pandemic (N=71)Footnote 11

-
Figure 1 - Text version
Number of encampments
Number of encampment residents
Increased significantly
61%
56%
Increased somewhat
20%
18%
Stayed about the same
8%
10%
Decreased somewhat
1%
1%
Decreased significantly
1%
1%
Unsure
8%
13%
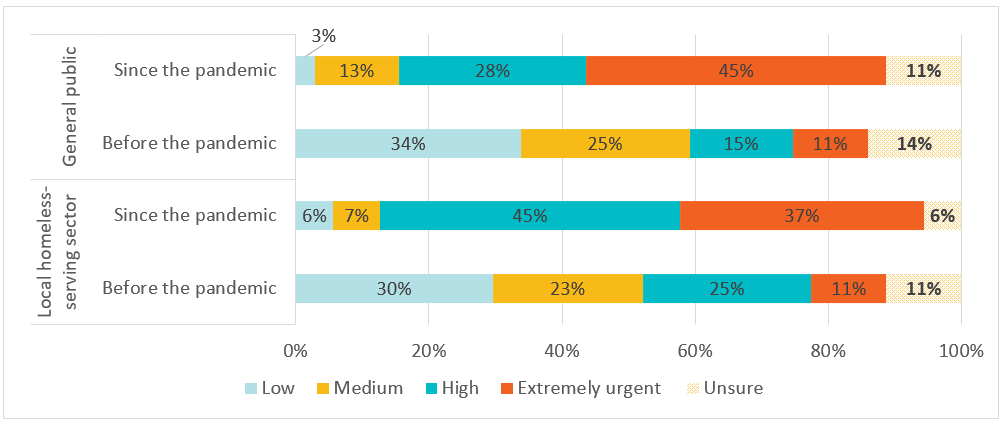
According to survey respondents, addressing homelessness in encampments has become a higher priority since the COVID-19 pandemic among both the local homeless-serving sector and the general public (Figure 2). However, within a given community, reported concerns around encampments tended on average to shift more drastically among the general public than within the local homeless-serving sector. This may be partly attributable to the effects of the pandemic, namely that encampments may have become more visible to the public in some communities, or that workers in the sector may perceive that the general public has been more vocal in expressing concerns about encampments through print, social media, and public forums in recent years.
Figure 2. Encampment homelessness as a community priority (N=71)

-
Figure 2 - Text version
Local homeless-serving sector
General public
Before the pandemic
Since the pandemic
Before the pandemic
Since the pandemic
Extremely urgent
11%
37%
11%
45%
High
25%
45%
15%
28%
Medium
23%
7%
25%
13%
Low
30%
6%
34%
3%
Unsure
11%
6%
14%
11%
Factors contributing to encampment use
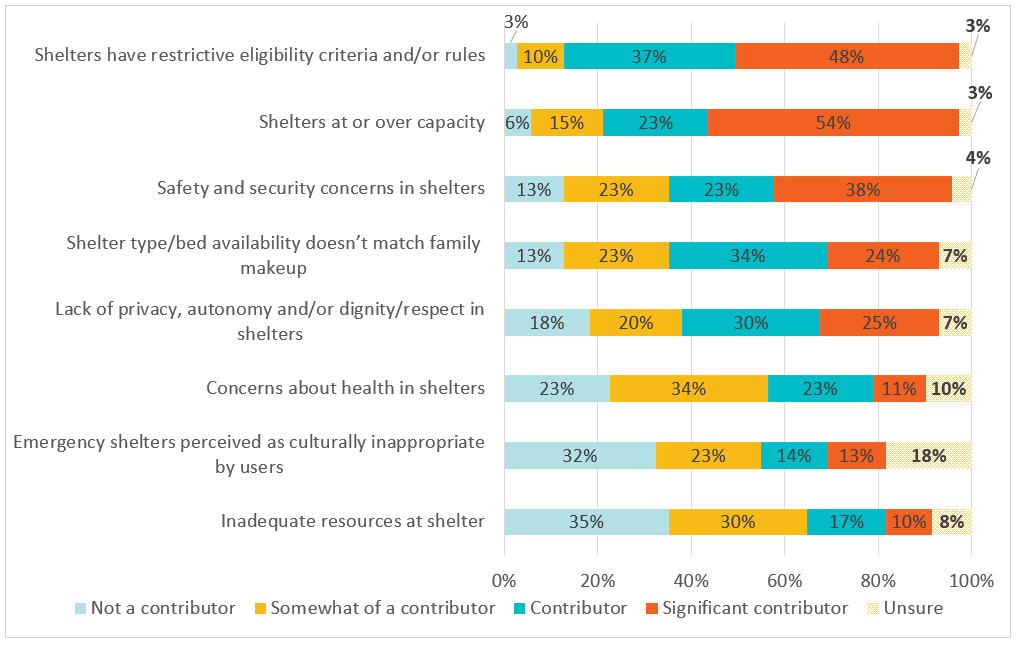
According to respondents, the key reasons why people were staying in encampments instead of using the local shelter system were: restrictive rules and eligibility criteria at shelters (85% of respondents indicated this was a “contributor” or “significant contributor” to encampment use), shelters being at or over capacity (76%), and safety and security concerns in shelters (61%). Shelter type or bed availability not matching family makeup (58%) and lack of privacy, autonomy, dignity, or respect at shelters (55%) were also commonly reported as contributing factors to encampment use (Figure 3).
Figure 3: Contributors to encampment use rather than shelter use (N=71)

-
Figure 3 - Text version
Not a contributor
Somewhat of a contributor
Contributor
Significant contributor
Unsure
Shelters have restrictive eligibility criteria and/or rules
3%
10%
37%
48%
3%
Shelters at or over capacity
6%
15%
23%
54%
3%
Safety and security concerns in shelters
13%
23%
23%
38%
4%
Shelter type/bed availability doesn’t match family makeup
13%
23%
34%
24%
7%
Lack of privacy, autonomy and/or dignity/respect in shelters
18%
20%
30%
25%
7%
Concerns about health in shelters
23%
34%
23%
11%
10%
Emergency shelters perceived as culturally inappropriate by users
32%
23%
14%
13%
18%
Inadequate resources at shelter
35%
30%
17%
10%
8%
Respondent comments
In some cases, respondents identified additional drivers of encampment use outside of those presented in the survey, including a lack of affordable, safe, stable, and suitable housing (reported by 37% of respondents) and local mental health and/or addictions crises (reported by 32% of respondents). Since these findings are based on voluntary comments, the impact of these factors may be underestimated.
Community responses to encampments
The most commonly reported community responses to encampments were to close or clear out encampments with temporary support offered to residents to aid a transition to shelter or housing (54% of respondents), to tacitly accept encampment use (i.e., lack of enforcement; non-intervention) (54%), and to close or clear out encampments with long-term support offered to residents (41%). Communities with larger encampments were less likely to offer long-term support upon encampment closure. Conversely, communities with larger encampments were more likely to practice tacit acceptance.
Health and safety concerns for encampment residents was the most commonly reported factor influencing a community’s encampment response (80% of respondents), followed by visibility to the general public (76%), and reports and complaints to municipal government staff (76%).
Over a quarter of respondents (28%) reported having an official encampment response plan with protocols in place in their community.
Some respondents (20%) reported offering on-site or on-call services and facilities for encampment residents in a thorough and consistent manner (e.g., mental/physical healthcare, storage, food service, potable water, sanitation and hygiene services, pest control, solid waste disposal, etc.). The majority (58%) of respondents reported that the services offered were basic or inconsistent over time.
Community responses to encampments were most commonly carried out by front-line service providers (96% of respondents) and by the police (83%). Encampment residents were least commonly reported as active participants in local encampment responses (34%).
Resources and barriers
The most common sources of community funding for encampment responses were: federal funding from the Reaching Home program (39% of respondents), followed by homelessness-specific provincial funding (38%), municipal funding (35%), other provincial funding (27%), local funders (e.g., United Way) (20%), and other federal funding sources (4%). Urban respondents were more likely than rural respondents to have access to funding from any given source.
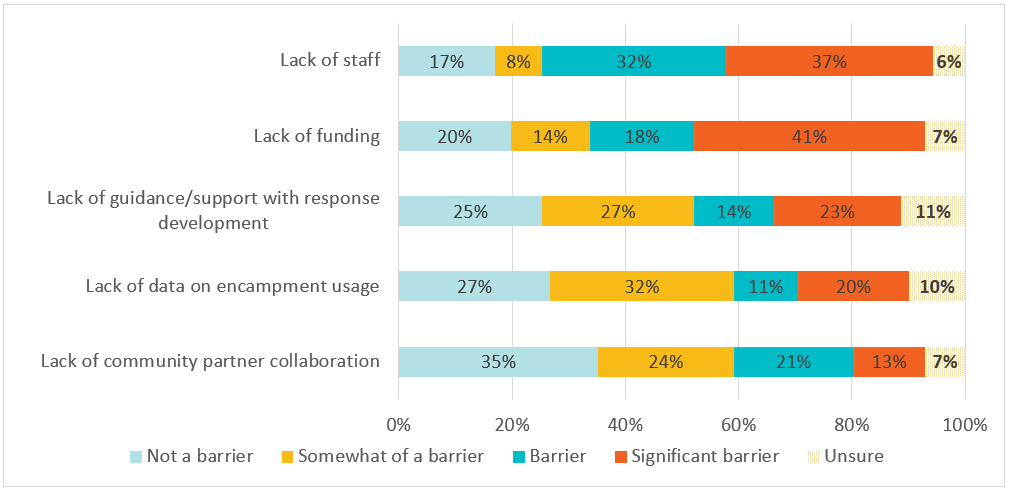
The most commonly reported barriers to responding to encampments since the beginning of the pandemic were: lack of staff (69% of respondents indicated this as a “barrier” or “significant barrier”), followed by lack of funding (59%). Lack of guidance or support with response development (37%), lack of data on encampment use (31%), and lack of community partner collaboration (34%) were less commonly reported as barriers (Figure 4). The above factors all tended to be reported as greater barriers in rural areas than urban areas, with the exception of lack of staff, which was reported as a greater barrier in urban areas than rural areas.
Figure 4: Barriers to community encampment responses (N=71)

-
Figure 4 - Text version
Not a barrier
Somewhat of a barrier
Barrier
Significant barrier
Unsure
Lack of staff
17%
8%
32%
37%
6%
Lack of funding
20%
14%
18%
41%
7%
Lack of guidance/support with response development
25%
27%
14%
23%
11%
Lack of data on encampment use
27%
32%
11%
20%
10%
Lack of community partner collaboration
35%
24%
21%
13%
7%
Respondent comments
Comments also provided further details to contextualize responses to the survey question on barriers. For example, some respondents commented on the challenges associated with inconsistent or unpredictable funding, ineffectively allocated funding, or funding that is inconsiderate of inflation. Concerns around staffing challenges included understaffing, lack of qualified staff, lack of relevant or standardized training, lack of measures to ensure worker safety and well-being, and reliance on volunteers.
Respondents also identified additional barriers to responding to encampments, including the impacts of local attitudes and perceptions (reported by 38% of respondents), such as political inertia and inconsistency or unresponsiveness from local leadership, stigma and discrimination against individuals experiencing homelessness, racism, interference from third parties, controversy regarding best practices, lack of trust between institutions and individuals, and lack of clear responsibilities or authorities.
Approximately 20% of respondents also commented that there was a lack of system capacity to adequately respond to the needs and interests of high-acuity populations, including those experiencing chronic homelessness. Respondents indicated that these limitations throughout the continuum of homelessness services – including outreach, shelter entry, case management, housing, wrap-around supports, follow-up, and viable transportation options – hindered efforts to address encampment homelessness.
Respondents indicated that barriers exacerbate each other, compounding their effect on the efficacy of attempts to address encampments. Respondents cited several interdependent, discrete problems and systemic gaps causing bottlenecks in service provision. For example, barriers related to funding may affect an organization’s capacity to address staffing- or data-related issues, which may in turn hinder the ability to collaborate with partners.
Successful responses and future strategies
The most commonly reported response strategies implemented by communities were: increased coordination amongst service providers (93% of respondents), referrals to shelter/housing programs (87%), increasing outreach activities (83%), and harm reduction services (83%). The community response strategies most likely to succeed in reducing encampment numbers were: creating new shelters (59% of respondents), increasing availability of public and/or transitional housing (57%), increasing capacity in existing shelters (54%), and creating or transitioning to low-barrier shelters (52%).Footnote 12
Encampment Response Strategy |
Reported useFootnote 13 |
Reported success rateFootnote 14 |
|---|---|---|
Creating new shelters* |
55% (27 out of 49) |
59% |
Increasing availability of public and/or transitional housing |
47% (28 out of 60) |
57% |
Increasing capacity of existing shelters |
65% (41 out of 63) |
54% |
Creating/transitioning to low-barrier shelters* |
48% (21 out of 44) |
52% |
Converting existing buildings to COVID shelters* |
60% (27 out of 45) |
48% |
Increased coordination amongst service providers |
93% (56 out of 60) |
46% |
Adding/increasing case management services (related to housing, occupation, family, rehabilitation and recovery, etc.) |
78% (46 out of 59) |
46% |
Expanding outreach activities or increasing outreach workers |
83% (52 out of 63) |
42% |
Enhancing resources/facilities of existing shelters |
57% (34 out of 60) |
41% |
Increasing availability of housing programs (e.g., Housing First, rapid rehousing)* |
57% (27 out of 47) |
33% |
Engagement with encampment residents to help inform local responses |
58% (31 out of 53) |
32% |
Relocation support services (e.g., transportation, storage) |
59% (32 out of 54) |
31% |
Referrals to shelter/housing programs for encampment residents* |
87% (41 out of 47) |
27% |
Harm reduction services* |
83% (35 out of 42) |
26% |
Referrals to treatment programs for encampment residents* |
58% (22 out of 38) |
23% |
Expanded health supports* |
60% (27 out of 45) |
15% |
Legal assistance/representation* |
30% (10 out of 33) |
10% |
*Response options not included in Quebec survey.
The most commonly reported strategies planned to be implemented by communities within the next 6-12 months were: increasing affordable housing supply and/or supportive and transitional housing (61% of respondents), increasing shelter capacity (54%), increasing outreach capacity (39%), engagement with encampment residents (37%), and partnership-building with relevant actors (37%).
Key Findings
- Encampments were reported in 68 out of 72 communities. During one month of 2022, an estimated 14-23% of the homeless population were reported to be staying in encampments. However, less than two thirds of respondents reported regularly tracking information related to encampment use.
- The population size and/or number of encampments increased significantly in 63% of communities since the beginning of the COVID-19 pandemic.
- The key factors perceived to contribute to encampment use over shelter use were restrictive rules and eligibility criteria at shelters (85% of respondents), shelters being at or over capacity (76%), and safety and security concerns in shelters (61%). Supplementary drivers of encampment use were lack of affordable, safe, stable, and suitable housing (37% of respondents) and local mental health and addictions crises (32%).
- The most commonly reported community responses to encampments were to close or clear out encampments with temporary support offered to residents to aid a transition to shelter or housing (54% of communities), to tacitly accept encampment use (i.e., lack of enforcement; non-intervention) (54%), and to close or clear out encampments with long-term support offered to residents (41%).
- Over a quarter of respondents (28%) reported that their community has an official encampment response plan with protocols in place.
- Front-line service providers were the most common actor in local encampment responses (96% of communities), followed by police (83%). Encampment residents were least commonly reported as being actively involved in local encampment responses (34%).
- The key barriers to responding to encampments since the beginning of the pandemic were inadequate staff (69% of respondents) and inadequate funding (59%). Supplementary barriers include the impacts of local attitudes, perceptions, and controversy (38% of respondents).
- The response strategies with the highest reported success rates in reducing encampment numbers were: creating new shelters (59% of respondents), increasing availability of public and/or transitional housing (57%), increasing capacity in existing shelters (54%), and creating or transitioning to low-barrier shelters (52%).
For more information
To find out more about homelessness research, visit the Data analysis, reports and publications page.
If you have any questions about this report, contact us.
Report a problem on this page
- Date modified: